Mid-infrared Variability of Low-redshift Active Galactic Nuclei : Constraints on a Hot Dust Component with a Variable Covering Factor
Abstract
We utilize mid-infrared multi-epoch data from Wide-field Infrared Survey Explorer (WISE) over a -year period in W1 (3.4m) and W2 (4.6m) bands to investigate the structure of dusty torus in low-redshift () active galactic nuclei (AGN). We calculate a Spearman correlation coefficient () between W1 magnitude and W1W2 color based on the light curve in individual objects. Interestingly, spans a broad range from to , and is detected to be correlated with mean W1W2 color and AGN bolometric luminosity, in the sense that objects with blue W1W2 color and low AGN luminosity tend to become redder (bluer) with increasing (decreasing) W1 brightness in the light curve (i.e. ), although the correlation of with the bolometric luminosity is relatively weak. The fit for the spectral energy distribution reveals a significant contribution from the host galaxy in the W1 and W2 bands. However, the dependencies of on W1W2 color and AGN luminosity still persist even after careful elimination of the host light contribution. We propose that this result can be explained if covering factor of the hot dust component decreases as AGN luminosity increases.
1 Introduction
An accretion disk in the vicinity of a supermassive black hole and dense gas clouds known as the broad line region (BLR), is assumed to make up the central part of the active galactic nucleus (AGN), which is surrounded by a dusty torus. According to the unification model, the structures of type 1 and type 2 AGN are identical but the AGN type is solely determined by a viewing angle to the opening angle of the dusty torus (Antonucci, 1993; Urry & Padovani, 1995). In this regard, it is critical to understand the detailed structure of the torus to examine the AGN unification model.
While clumpy dust instead of smooth dust may mimic the geometrical structure of the torus (e.g., Pier & Krolik, 1992; Fritz et al., 2006; Nenkova et al., 2008; Hönig & Kishimoto, 2010; Stalevski et al., 2016), several critical concerns about the structure of the torus structure remain unresolved. For example, the covering factor of the torus is one of the most essential parameters to determine the torus structure. Various observational studies reached somewhat different conclusions. Some studies claimed that the covering factor is somewhat linked with Eddington ratio (e.g., Ricci et al., 2017; Ezhikode et al., 2017; Zhuang et al., 2018) and independent of AGN luminosity (e.g., Hao et al., 2010, 2011; Mor & Netzer, 2012; Netzer et al., 2016). However, using the ratio of mid-infrared luminosity and AGN bolometric luminosity, various other studies demonstrated that the covering factor is anti-correlated with AGN luminosity (e.g., Maiolino et al., 2007; Mor & Trakhtenbrot, 2011; Lusso et al., 2013; Roseboom et al., 2013), favoring a receding torus model (Lawrence, 1991; Simpson, 2005; Hönig & Beckert, 2007).
Spectral energy distribution (SED) of near-infrared (NIR) and mid-infrared (MIR) is critical for constraining the physical properties of the dusty torus as the dust heated by the immense energy from the accretion disk re-radiates thermal emission in the infrared (IR). It is well known that the IR SED can be represented by hot and warm components (e.g., Barvainis, 1987; Suganuma et al., 2006; Mor & Netzer, 2012), although an additional contribution from a polar dust may not be insignificant (e.g., Hönig et al., 2013; Lyu & Rieke, 2018; Yang et al., 2020; Mountrichas et al., 2020; Buat et al., 2021; Toba et al., 2021). Several observational studies discovered a population of AGN lacking the hot dust component at moderate and high redshift, based on the IR SED of AGN (e.g., Jiang et al., 2010; Hao et al., 2010, 2011). In addition, Hao et al. (2011) claimed that a fraction of hot-dust-deficient (HDD) AGN in the distant Universe is greater than that in the local universe. However, other studies demonstrated that a population of HDD AGN may not be correlated with the redshift but firmly connected to the physical properties of AGN, such as bolometric luminosity and Eddington ratio (e.g., Mor & Netzer, 2012; Jun & Im, 2013; Lyu et al., 2017).
Despite various previous studies, it is still vital to understand the structure of the dusty torus and how it relates to the physical properties of AGN. In this study, we utilize an independent approach based on the characteristics of MIR variability to investigate the physical properties of the dusty torus. The sample selection and multi-epoch data are presented in Section 2. We describe the approach to quantify the characteristics of MIR variability in Section 3. In section 4, we discuss the physical origin of our finding. Throughout the study, we assume a cosmology with km s-1 Mpc-1, , and .
2 Sample and Data
2.1 Sample
Our sample is drawn from the Sloan Digital Sky Survey (SDSS). We select type 1 and type 2 AGN from the SDSS Data Release 14 (DR14) quasar catalog (Pâris et al., 2018) and the SDSS Max Planck Institute for Astrophysics-Johns Hopkins University (MPA-JHU) Data Release 8 (DR8) catalog (Kauffmann et al., 2003; Brinchmann et al., 2004), respectively. Because the MPA-JHU catalog contains all types of galaxies, we utilized only galaxies classified as AGN according to the Baldwin-Phillips-Terlevich (BPT) diagram (Baldwin et al., 1981) in MPA-JHU classifications (BPTCLASS = 4; Brinchmann et al. 2004). For both types of AGN, we impose a minimum redshift of 0.15 to minimize the host galaxy contamination from extended features in W1 (3.4 m) and W2 (4.6 m) bands, and a maximum redshift of 0.4 to ensure that H is covered by the SDSS spectrum for the AGN classification using the BPT diagram. For type 2 AGN, 402 duplicates were removed in the MPA-JHU catalog. We find that 922 type 2 AGN initially selected from the MPA-JHU catalog are also classified as type 1 in the SDSS QSO catalog, which are regarded as type 1 in this study, yielding an initial sample of 7443 type 1 and 5531 type 2 AGN.
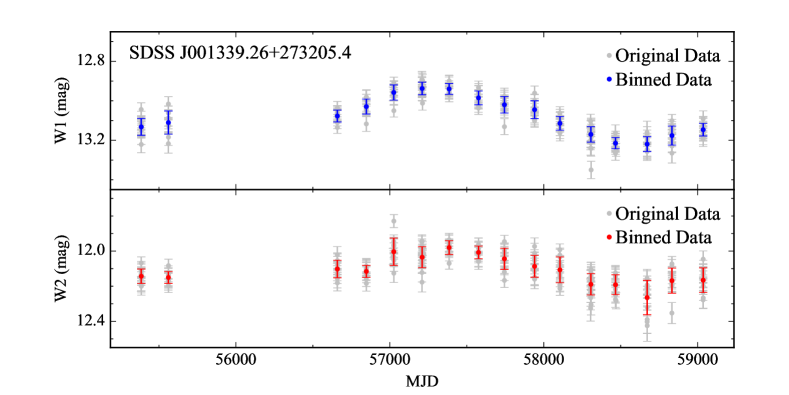
To investigate mid-infrared (MIR) variability of SDSS-selected AGN, we employed photometric data of W1 and W2 bands from the Wide-field Infrared Survey Explorer (WISE; Wright et al. 2010). Multi-epoch data are retrieved from the AllWISE Multiepoch Photometry Table and the NEOWISE-R Single Exposure (L1b) Source Table at the NASA/IPAC Infrared Science Archive (IRSA; https://irsa.ipac.caltech.edu/) with a matching radius of 2′′. Sources with detection in W1 band typically have an astrometric uncertainties less than 05 (Cutri et al., 2013), indicating the matching radius is sufficient to capture the IR counterpart (see also Assef et al. 2013). Among the initial sample, 7368 type 1 and 5491 type 2 AGN were detected by WISE or NEOWISE. WISE visited a particular field in the sky every six months, and typically observed that field 14 times for three days in each visit. As a result, we bin the photometric data into days to obtain a representative magnitude in each visit. To remove poor-quality data, only the photometry flagged with , , , , and were averaged after 3 sigma clipping in a single visit (Fig. 1). Following Lyu et al. (2019), we evaluated the magnitude uncertainty for each epoch as follows: where and denote the magnitude and its uncertainty at each observation, respectively in the Vega magnitude system, denotes the mean magnitude at each epoch, and denotes the system stability ( and mag for WISE and NEOWISE, respectively). The light curve typically spans a baseline of 10 yr with a cadence of 6 months. Note that there is a -month gap between WISE and NEOWISE.
2.2 MIR Variability
To identify variable objects, we utilize the of the light curve: , where represents the mean magnitude over the entire epochs and is the uncertainty in each epoch. Following the recipe in Sánchez et al. (2017), we defined , where is the probability that the computed or lower value can be obtained by chance from an invariable source (see also McLaughlin et al. 1996). Therefore a low (high ) implies that the object is likely to be variable. We classified it as a variable object if both for W1 and W2 (Lanzuisi et al., 2014; Cartier et al., 2015; Sánchez et al., 2017; Kim et al., 2018). Note that we utilized a sample with a sufficiently large number of epochs (). Due to larger uncertainty in W2 compared to W1 as shown in Figure 1, the main reason for the rejection is relatively smaller in W2 band. Finally, a total of 2114 type 1 AGN and 623 type 2 AGN were identified as variable sources. We conducted further investigation for these sources.
2.3 AGN properties
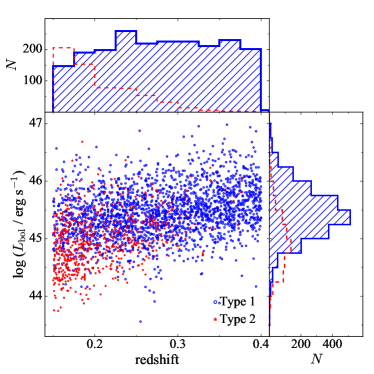
We estimated the bolometric luminosity using [O III]5007 luminosity by adopting a conversion of (Heckman et al., 2004). Note that the conversion factor can be significantly smaller or dependent upon the AGN luminosity for the extinction corrected for [O III] luminosity (Kauffmann & Heckman, 2009; Trump et al., 2015; Kong & Ho, 2018). However, because our goal is to examine a trend of MIR variability as a function of , adopting a single universal bolometric correction from Heckman et al. (2004) is sufficient for that purpose. [O III] luminosity of type 1 and type 2 AGN were taken from Rakshit et al. (2020) and MPA-JHU DR8 catalog, respectively. The distributions of bolometric luminosity and redshift of the sample are shown in Figure 2. Note that there is a clear difference between type 1 and type 2 subsamples, in the sense that type 1 AGN have greater bolometric luminosity and larger redshift compared to type 2 AGN. Despite of this genuine difference, two samples show similar trends in the characteristics of MIR variability as shown in Section 3. It reveals that the main result of this study do not dependent on this bias.
For type 1 AGN, BH mass is calculated using the virial method, in which BH mass () can be inferred from the size () and velocity dispersion () of the BLR underneath the central black hole. Thanks to the tight correlation between and AGN luminosity ( relation), one can estimate BH mass using the single epoch spectrum. However, in the virial mass estimates, there is an unknown scaling factor , which is sensitive to geometry and kinematics of gas clouds in BLR. In general, is determined by assuming that host galaxies of AGN follow the same relation of normal galaxies (e.g., Onken et al., 2004; Woo et al., 2013). As a result, a single universal scaling factor is used to estimate BH mass, although it can depend on physical properties of AGN (e.g., Marconi et al., 2008). Therefore, in addition to the intrinsic scatter in the relation, the unknown scaling factor can naturally introduce an uncertainty ( dex) to BH mass derived from the virial method (e.g., Park et al., 2012).
Line width (full width at half maximum; FWHM) and flux of broad emissions (H and H) were taken from Rakshit et al. (2020), whose values are measured from the decomposition of SDSS spectra. The broad emission lines were fitted with multiple-Gaussian models. We adopted a calibration of BH mass estimator from Ho & Kim (2015) based on H and 5100Å AGN continuum luminosity (Kim et al., 2021a). We primarily utilized H line widths and H luminosity as H is minimally influenced by the complex Fe II multiplets than H. For the conversions of line luminosity to 5100Å AGN luminosity, and H line widths to H line widths, we employed the relations of Greene & Ho (2005). For those without reliable spectral measurements for H, we utilized H instead. Overall, BH mass can be calculated from the virial method for 2112 out of 2114 type 1.
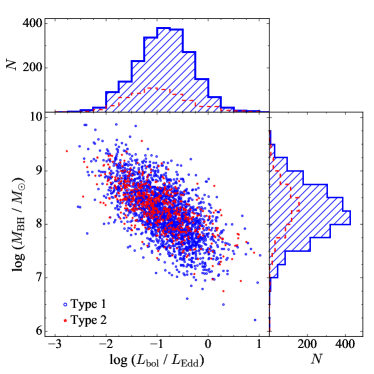
For type 2 AGN, BH mass was computed from the total stellar mass of the host galaxy using the relation. We adopted the relation from Greene et al. (2020) for all morphological types of galaxies. Note that the uncertainty of this BH mass estimate ( dex) is significantly greater than that ( dex) of the virial method due to the intrinsic scatter in the relation (Greene et al., 2020). The stellar mass, derived from the SED fit for the photometric data of ugriz, was taken from MPA-JHU catalog for 613 out of 623 type 2. Figure 3 shows the distributions of BH mass and Eddington ratio of the variable sources, in which there is little difference between type 1 and type 2 AGN, contrary to the distributions of bolometric luminosity and redshift,
3 Result
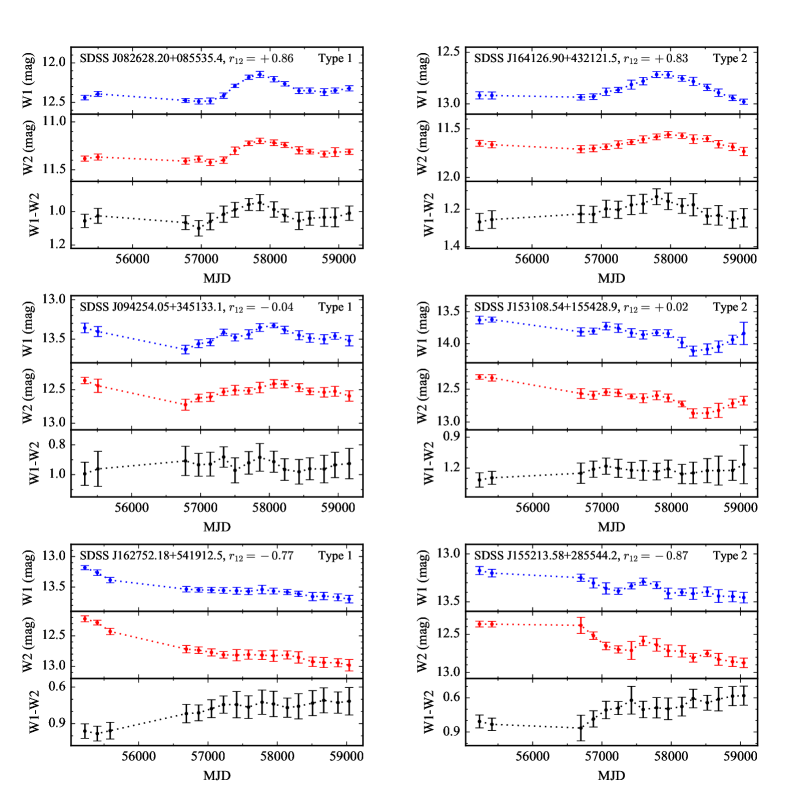
3.1 The Connection between MIR Variability and AGN Properties
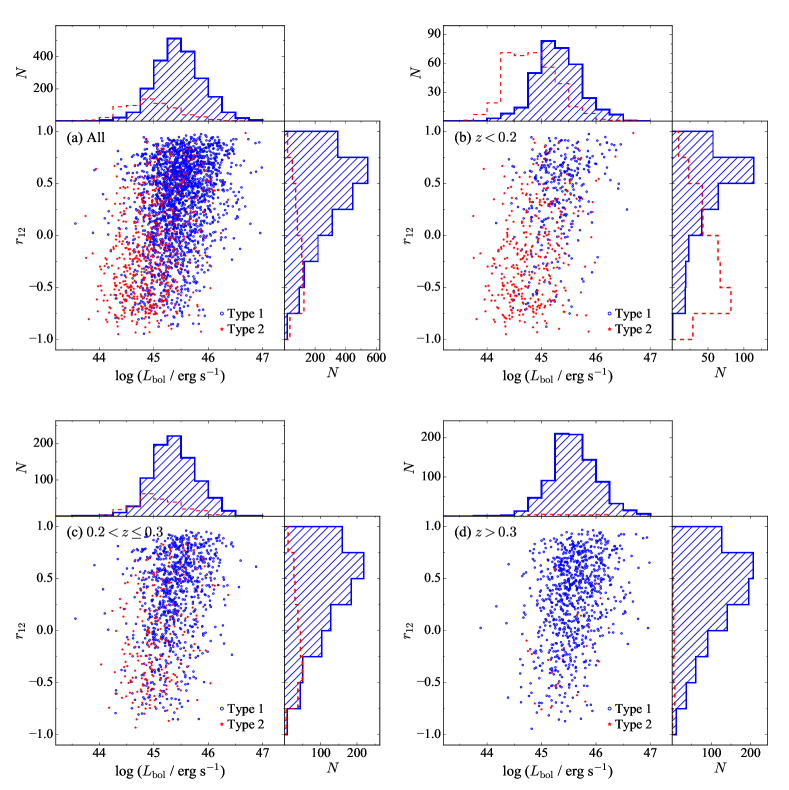
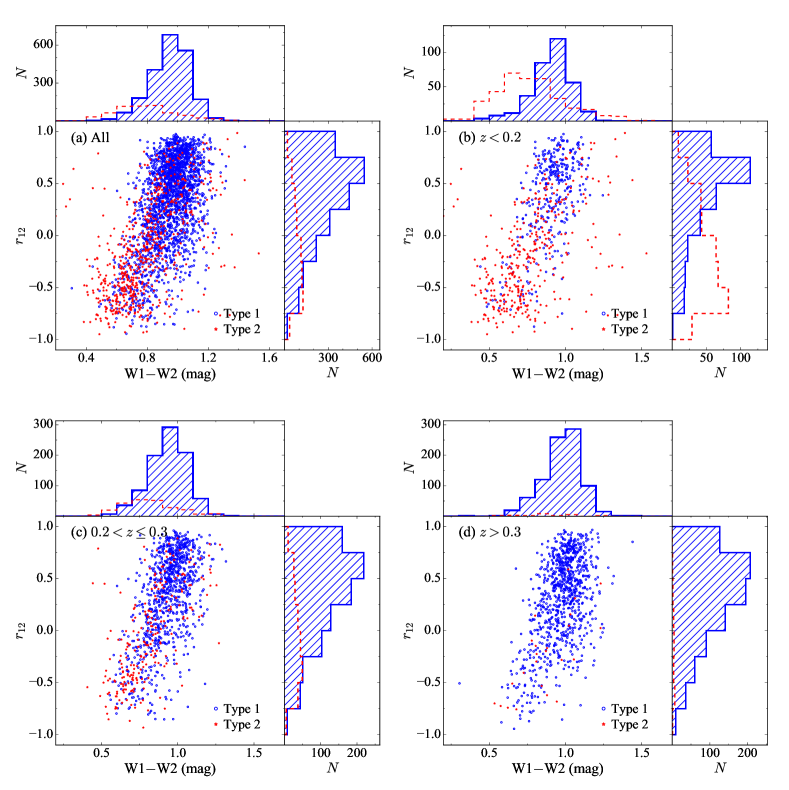
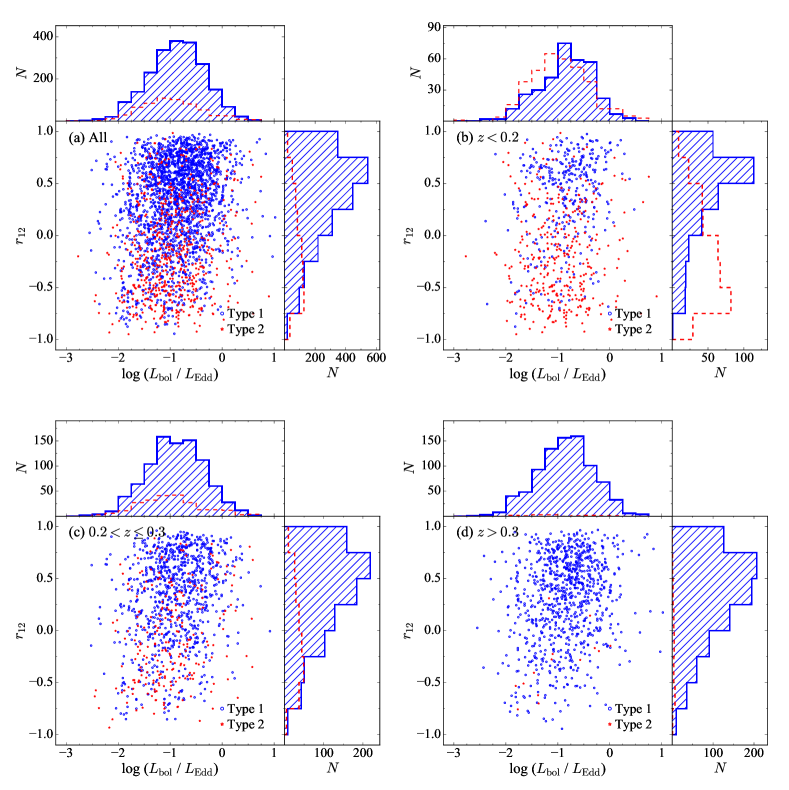
In order to quantify the characteristics of MIR variability of an individual AGN from the light curve, we utilized the Spearman correlation coefficient between W1 (mag) and W1W2 color (hereafter ). If W1W2 color decreases (i.e. bluer in color) with increasing AGN brightness in the light curve, is predicted to be positive (Fig. 4). However, if MIR color becomes redder as AGN brightness increases, is predicted to be negative. Surprisingly, is found to have a broad distribution from to 1, indicating the structure of the torus may be complicated and different between AGN possibly dependent upon AGN properties. To investigate the physical origin of the wide spread of , we performed the comparison of with various physical properties. We found that is moderately correlated with W1W2 color ( and for type 1 and type 2, respectively), and mildly correlated with the bolometric luminosity ( and 0.32 for type 1 and type 2, respectively; Figs. 5 and 6). P-values are smaller than in both cases, implying that the null hypothesis (no correlation) can be rejected. However, appears to be weakly or not correlated with the Eddington ratio (Fig. 7 and Tab. 1).
The rest-frame central wavelengths of W1 and W2 vary with the redshift and hence the light contamination from the host and accretion disk can also vary with the redshift. In addition, the distributions of bolometric luminosity and redshift is clearly different between type 1 and type 2 AGN. To minimize those biases, we divide our sample into three subsamples according to their redshift. Our finding that is correlated with W1W2 color and bolometric luminosity is the same regardless of the redshift (Figs. 5 and 6). At , where the difference between type 1 and type 2 AGN in the distribution of bolometric luminosity is minimized, the trend is almost identical for both AGN types. It may reveal that the overall trend may not be affected by the bias in the distribution of bolometric luminosity.
Interestingly, the distributions of are distinguishable between type 1 and type 2, in the sense that the mean of type 2 () is systematically smaller than that of type 1 (). This may be partly due to the fact that type 1 tends to have larger bolometric luminosity and redder W1W2 color compared to type 2. This may be due to the fact that SDSS spectroscopic data were obtained for a flux-limited sample (). Therefore, for type 2 objects, the sample is biased toward AGN with more luminous hosts, leading to bluer W1W2 color. On the contrary, for type 1 sources, owing to the light contribution from the AGN itself in the optical band, can be relatively free from this bias. While AGN tend to have red color in W1W2 (i.e. W1W2 ; Stern et al. 2012), a large fraction of type 2s appear to have W1-W2 less than 0.8, which again suggests the substantial contribution from the host in these objects. We will discuss this in more detail in §4.1. However, the correlation coefficient between and W1W2 color appeared to be systematically greater for type 2 than type 1 (0.59 vs. 0.45), possibly implying that the genuine torus structure or the viewing angles of type 1 and type 2 AGN are not identical. Because, however, not only the AGN properties of the sample (e.g., bolometric luminosity) are variable between type 1 and type 2, but also the host contamination is non-negligible in MIR, indicating the need for those factors to be fully taken into account to investigate the physical origin of our finding (see §4.1)
3.2 Composite Spectra
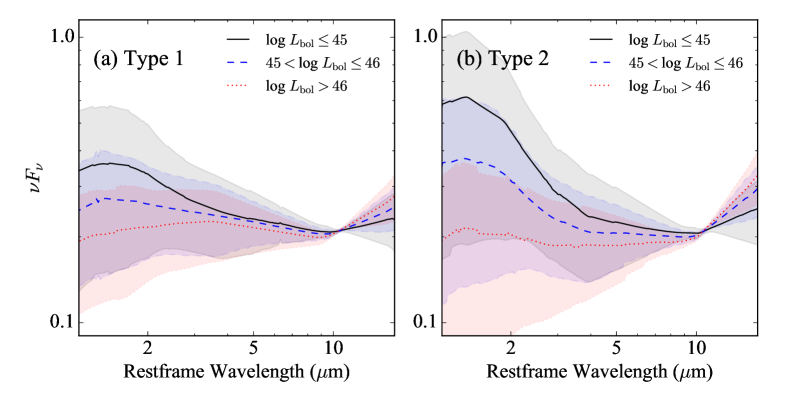
To investigate the origin of the observed dependence of on , we constructed NIR/MIR composite spectra employing the photometric data from 2MASS (; Skrutskie et al. 2006) and WISE (W1, W2, W3, and W4). We used a matching radius of 2′′ for the cross-correlation of WISE with 2MASS. Note that the optical data is excluded because the light contribution from the accretion disk is severe at short wavelenghts,which makes a direct comparison between two AGN types difficult. Following the method from Hickox et al. (2017), we included objects detected in all 7 bands (1866 type 1 and 559 type 2 AGN). For each object, the photometric data was converted to the rest-frame and fluxes in wavelengths ranging from m are calculated by interpolating the photometric data in log-log space. The interpolated spectrum of each object is normalized to integrated flux within m. The composite spectrum is established by averaging fluxes from all the sources in each spectral bin. To prevent the systematic bias owing to outliers, we exclude fluxes using iterations of clipping. We divide the sample into six subsamples based on AGN type and , to investigate how the SED shape depends on those parameters (Fig. 8). Overall, 252, 785, and 829 type 1 objects (321, 171, and 67 type 2 objects) were employed to generate the composite spectra for low-luminosity ( erg s-1), moderate-luminosity( erg s-1), and high-luminosity objects ( erg s-1), respectively. In both types of AGN, more luminous AGN tend have redder MIR color compared to less luminous AGN. In addition, the signature of the host galaxy light in NIR appeared to be more outstanding in type 2 AGN. This is likely because type 2 AGN are systematically biased toward having greater NIR emission from the host galaxy owing to the shallowness of t‘he 2MASS survey. It demonstrates the importance of quantifying the host contribution to understand the characteristics of the MIR variability.
4 Discussions
4.1 Host Contamination
We found that is strongly correlated with W1W2 color and bolometric luminosity. Objects with bluer MIR color or lower luminosity tend to have smaller than those with redder MIR color or higher luminosity. Taken at a face value, this may indicate that the structure of the dusty torus is directly dependent upon the bolometric luminosity and subsequently the MIR color. However, this trend can be naturally explained if MIR light is dominated by the host component. In contrast to the AGN light, the stellar light is intrinsically blue in MIR and does not vary on a time scale of years. As a result, if AGN outshines the host light in the low-luminosity and host-dominated AGN, MIR becomes brighter and redder (i.e. ). Therefore, it is crucial to robustly take the host contribution into account. Here, we utilized two different methods to estimate the relative host contribution in W1 and W2 band. First, to compute the predicted flux in W1 predominantly from the stellar light, we utilized the stellar mass inferred from the SED fit of the optical broad band (ugriz) photometry of type 2 AGN (Kauffmann et al., 2003). Note that the same method cannot be applied to type 1s because the light contribution from the accretion disk is significant.
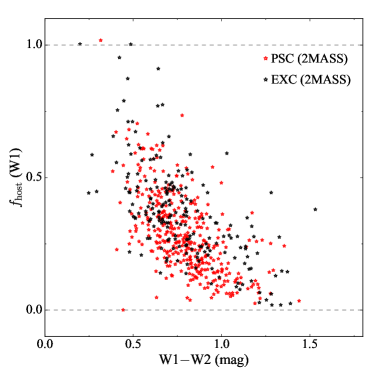
The mass-to-light ratio of passive galaxies () at the W1 band was adopted from Kettlety et al. (2018), as the MIR SED of the AGN host is established to be well fit with that of early-type galaxies (Hickox et al., 2017). correction is calculated by presuming that MIR SED took a power law following the recipe in Kettlety et al. (2018). We adopted the average flux in the W1 band over the entire period of the WISE survey to compute the host contribution. On average, the light fraction of the host galaxy in W1 band was , implying that the host contribution is substantial (Fig. 9). This fraction dramatically increases as W1-W2 decreases, revealing the MIR color is closely correlated with the host contribution, which needs to be properly accounted for when calculating . Note that due to the simplified assumptions on the galaxy template in this method, the result needs to be interpreted with caution.
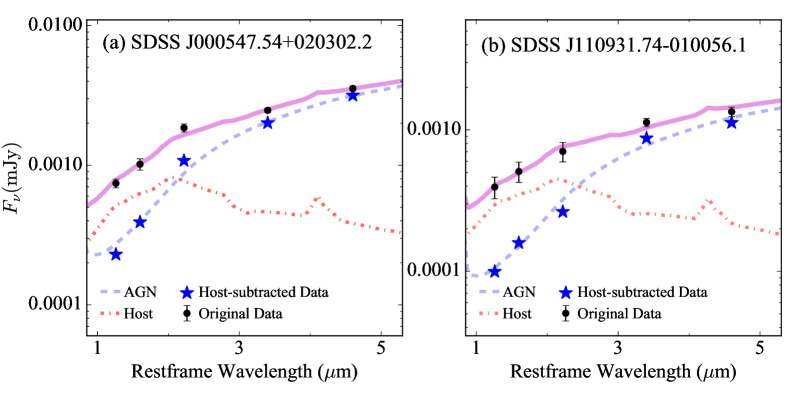
Second, to robustly remove the light contamination from the host, we applied the SED fit to the broadband photometry of each object. For the SED fit, we utilized photometric data from 2MASS () and WISE (W1 and W2 bands). Because the SED fit with W3 and W4 bands often leads to unsatisfactory results, those were excluded in this experiment. As W1 and W2 fluxes were measured through the PSF photometry, it can miss the flux from extended structures if present. Therefore, to keep the consistency between the photometric data, we only utilized the objects in the 2MASS point source catalog (PSC). We employed the template spectra for AGN and for an elliptical, spiral, and irregular galaxy from Assef et al. (2010). A broad range of galaxy types provides better coverage of the diverse stellar population expected for the host galaxies of type 1 and type 2 AGN (e.g., Kim & Ho 2019; Zhao et al. 2019, 2021). During the fit, the extinction for the AGN template is considered by varying . From the SED fit, we computed the light contributions from the host in W1 and W2 bands, and subtract those from photometric data in every epochs (Fig. 10). Finally, we recalculate using the host-subtracted magnitudes in W1 and W2 bands.
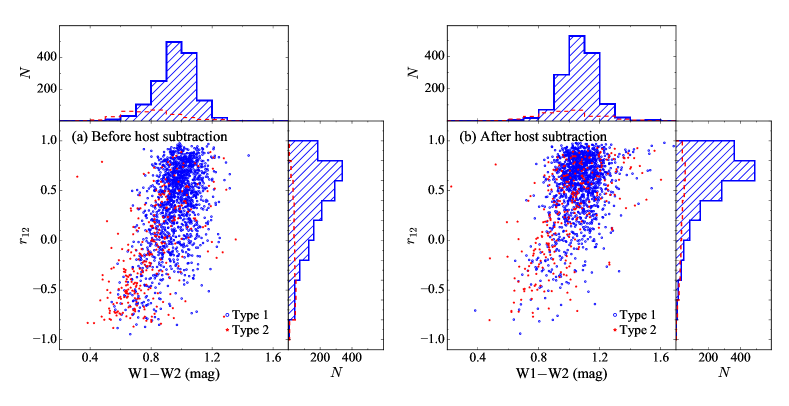
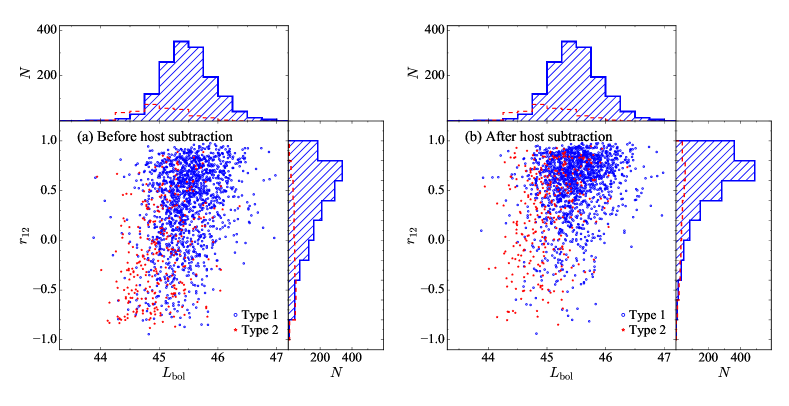
Figure 11 (Figure 12) show the correlations between and W1W2 color (bolometric luminosity) before and after the subtraction of host light. The fractions of host light in W1 were, on average, 22 and 39% in type 1 and type 2 AGN, respectively. This is in broad agreement with the results from the stellar mass for type 2 AGN. However, the SED fit yielded a slightly larger host fraction in W1, possibly because both methods used templates from the different types of host galaxies. The host light subtraction naturally resulted in a marginal increase in W1W2 color () and a more substantial increase in ( on average). Figure 11 clearly shows that, after the correction, the majority of the sample have W1W2 color larger than 0.8 mag, which is consistent with the previous criteria for the AGN selection (e.g., Stern et al. 2012). As a result, the level of dependence of on W1W2 color became slightly lower only for type 1. Before the host correction, for type 1 and for type 2, to be compared with for type 1 and for type 2 after the correction. However, the general trend, in which tends to decrease with decreasing W1W, remains the same. This experiment reveals that the dependency on W1W2 is not entirely due to the host contamination, rather it is more likely connected with the intrinsic properties of the dusty torus. Similarly, the trend for the dependence of on AGN luminosity also still remains the same after the correction for the host galaxy. The correlation coefficients between and physical parameters of AGN after the correction for the host galaxy are listed in Table 1.
4.2 Physical Origin of the Wide Range of
The brightness and color in W1 and W2, can be determined from several physical parameters, such as extinction for the AGN (), existence and covering factor of hot dust component, viewing angle, and host galaxy contamination (e.g., Nenkova et al. 2008; Stalevski et al. 2016; Hickox et al. 2017; Lyu et al. 2017). Our findings imply that the characteristics of variability in W1 and W2 are strongly dependent upon W1W2 color and AGN luminosity. In §4.1, we demonstrate that the host contamination cannot be a physical origin of such trends. In addition, the viewing angle may not change dramatically in a single object. Therefore, we conclude that the hot dust component or the obscuration may be the main driver of the variability of W1W2 color.
4.2.1 What makes positive?
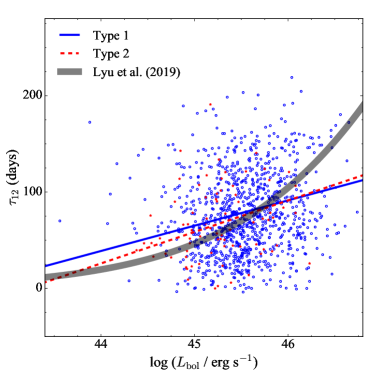
The innermost radius of the torus is determined by the sublimation of the dust (Barvainis, 1987; Suganuma et al., 2006). Therefore it is well known that hotter dust component have a smaller sublimation radius than warmer dust component, indicating that dust emission from shorter wavelength originates from an inner part of the torus (Koshida et al. 2014; Lyu et al. 2019). Therefore the reprocessed emission in W1 responded to the variation of the continuum from the accretion disk more quickly than that in W2. As a result, W1W2 color became blue (red) with increasing (decreasing) AGN luminosity, yielding a positive unless there is no change in the structure of the torus. To confirm this hypothesis, we estimate the time lag between W1 and W2 based on the light curve employing interpolated cross-correlation functions (ICCF; Peterson et al. 1998; Sun et al. 2018). We consider the centroid of the ICCF as the time lag. Errors on the time lags were estimated from Monte Carlo (MC) iterations (Gaskell & Peterson, 1987). Figure 13 shows that the time lag is greater than zero, revealing that W1 emission radiates from the inner part of the torus compared to W2. We also find that the time lag is correlated with , although with a large scatter, which is in broad agreement with the results from previous studies (Lyu et al. 2019). The correlation appears to be very weak due to the sparse sampling ( months) of the WISE light curves.
4.2.2 Viewing Angle and Obscuration
The level of dependence of W1W2 color and on is greater for type 2 than for type 1 AGN irrespective of taking the host contamination into account. This is partially owing to the fact that type 1 AGN lack objects with . Therefore it may indicate either the contribution from the accretion disk is not negligible even in W1 or the genuine structures of the dusty torus between type 1 and type 2 AGN may vary. The viewing angle and obscuration may also play an important role in shaping the NIR/MIR SED, in the sense that the smaller viewing angle and lower extinction can result in the bluer color in W1 and W2 (e.g., Nenkova et al. 2008; Stalevski et al. 2016). In this light, a marginal difference in distributions between type 1 and type 2 AGN can be described by those parameters.
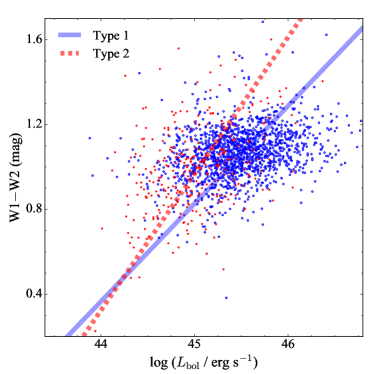
According to the AGN unification model, type 1 AGN is expected to have a smaller viewing angle and less obscuration than type 2 AGN. As a result, if the extinction and viewing angle is predominantly responsible for W1W2 color, type 1 AGN ought to have a bluer W1W2 color than type 2 AGN, which is inconsistent with our finding that type 2 AGN have a slightly bluer W1W2 color than type 1 AGN. In addition, Figure 14 demonstrates that higher luminosity AGN tend to have redder color, which is also contrary to the fact that the obscured AGN fraction decreases with the AGN luminosity (e.g., Maiolino et al. 2007; Lusso et al. 2013), if the red color is due to the high obscuration. It implies that neither the obscuration nor viewing angle play the primary role in determining W1W2 color.
4.2.3 Covering Factor of Hot Dust Component
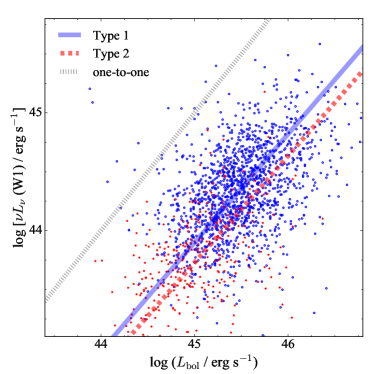
It is known that the NIR/MIR SED of AGN is well fit with two components: hot graphite dust component peaked around m (Richards et al. 2006; Netzer et al. 2007; Mor & Netzer 2012) and warm silicate-type dust component (e.g., Nenkova et al. 2008). Furthermore, the brightness in W1 and W2 are dominated by the emission from the hot dust component (Mor & Trakhtenbrot, 2011). Therefore the variability and SED shape are likely sensitive to the physical properties of the hot component. Mor & Trakhtenbrot (2011) demonstrated that the covering factor of the hot dust component is anti-correlated with the AGN bolometric luminosity (). This is consistent with our finding that less luminous AGN have bluer W1W2 owing to the greater contribution from the hot dust component (Fig. 13). This can be also confirmed from the composite spectra, in the sense that low-luminosity AGN tend to have bluer color in m. As a sanity check, we compared the AGN bolometric luminosity and the W1 luminosity (), which were calculated in the rest-frame. correction were computed using the observed W1W2 color. We found that the slopes between and ( and for type 1 and type 2, respectively) were smaller than 1 before taking account of the host contribution. However, after the subtraction of the host light, the slopes became 0.92 and 0.91 for type 1 and type 2, respectively (Fig. 15). This finding is in broad agreement with previous observational studies (Lusso et al., 2013), indicating that the covering factor of the hot dust decreases as AGN luminosity increases. Furthermore, there is a marginal discrepancy between type 1 and type 2 AGN in this correlation. This result likely supports the scenario of the clumpy torus in which the hot component is less obscured than in the smooth torus model.
In addition, the sublimation radius () of the hot dust component is correlated with , given by :
| (1) |
where denotes a sublimation temperature of pure-graphite grains (Mor & Netzer, 2012). Therefore, low-luminosity AGN tends to have a smaller innermost radius compared to high-luminosity AGN. One of the most interesting finding in our study is that, for low-luminosity AGN with blue W1W2, W1W2 color becomes redder with increasing AGN luminosity in the light curve (i.e. ). This may indicate that the hot dust at the innermost radius can be easily evaporated by the enhanced emission from the accretion disk. Interestingly, Yang et al. (2018) reported that changing-look (CL) AGN also tend to have . This may imply that CL AGN event occurs due to the change in the accretion rate.
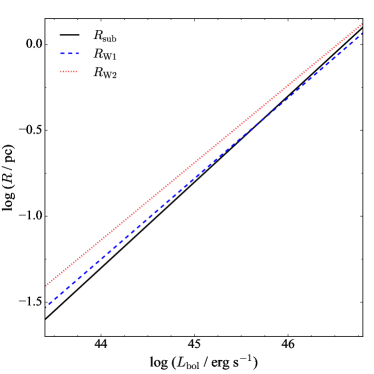
Lyu et al. (2019) evaluated the radii ( and ) of the torus inferred from the time-lag between the optical UV/optical emission and reprocessed emission in W1 and W2 band, respectively (Equations (15) and (16) of Lyu et al. 2019). They claimed that the torus size is strongly correlated with the AGN bolometric luminosity (see also Koshida et al. 2014; Glass 2004). Figure 16 shows that the comparison between the sublimation radius and the torus radii. is almost identical to and significantly smaller than , implying that dust material emitting in W1 band can be vulnerable to the sublimation. It confirms our argument is relevant.
However, for the high-luminosity AGN with red W1W2, the covering factor of the hot dust component can be reduced. Therefore, the NIR/MIR SED is unlikely sensitive to the evaporation of the hot dust and more likely determined by the warm dust component. In Figure 16, at erg s-1, becomes smaller than , revealing that the hot graphite dust may be evaporated already.
Finally, polar dust has been found in high-resolution MIR images of nearby type 1 AGNs (e.g., Hönig et al. 2013; Stalevski et al. 2017). In addition, the light contribution from the polar dust may be substantial in the MIR SED (e.g., Lyu & Rieke 2018; Yang et al. 2020; Toba et al. 2021). Therefore, one might suspect whether the polar dust can be responsible for the trend found in this study. However, the location of the polar dust (i.e. close to sublimation radius or located in the host galaxies) is still under debate (e.g., Lyu & Rieke 2018; Yang et al. 2020). Moreover, the physical properties of the polar dust in type 2 are unknown. Therefore, investigating the contribution from the polar dust is beyond the scope of our study.
5 Summary
Using the light curves in W1 and W2 bands generated from WISE multi-epoch data, we found that W1W2 color varies in respond to the light variation of AGN. This indicates that the structure of the dusty torus is sensitive to AGN luminosity. Furthermore, the trend of the color variation greatly depends on the MIR color and AGN bolometric luminosity, in the sense that low-luminosity (high-luminosity) AGN with blue (red) W1W2 color tend to turn redder (bluer) in W1W2 color with increasing IR luminosity. We found such trend is still valid, even after taking the host contribution in NIR/MIR into account, suggesting the host light is not the predominant reason for the color variation. We argue that the anti-correlation between the covering factor of the hot dust component and AGN luminosity can be the major reason for our findings, which is consistent with previous studies. Our results demonstrate that the color variation in NIR/MIR inferred from the multi-epoch data can be served as a powerful tool to investigate the detailed structure of the torus. For example, SPHEREx mission will obtain multi-epoch spectral images in deg2 of deep fields with a two-yr lifetime mission (Doré et al., 2018; Kim et al., 2021b). The multi-epoch spectral data covering m will provide a unique opportunity to address this subject in depth.
| Type 1 | Type 2 | Type 1 (Cor.) | Type 2 (Cor.) | |||||||||
|---|---|---|---|---|---|---|---|---|---|---|---|---|
| Parameter | Sample | value | value | value | value | |||||||
| (1) | (2) | (3) | (4) | (5) | (6) | (7) | (8) | (9) | (10) | |||
| W1W2 | All | 0.45 | 0.59 | 0.24 | 0.64 | |||||||
| 0.48 | 0.53 | 0.11 | 0.135 | 0.63 | ||||||||
| 0.52 | 0.68 | 0.30 | 0.67 | |||||||||
| 0.42 | 0.67 | 0.22 | 0.36 | 0.427 | ||||||||
| log | All | 0.28 | 0.32 | 0.19 | 0.32 | |||||||
| 0.31 | 0.30 | 0.22 | 0.003 | 0.39 | ||||||||
| 0.32 | 0.32 | 0.29 | 0.27 | 0.002 | ||||||||
| 0.30 | 0.43 | 0.034 | 0.26 | 0.72 | 0.068 | |||||||
| All | 0.20 | 0.12 | 0.002 | 0.13 | 0.25 | |||||||
| 0.25 | 0.03 | 0.552 | 0.10 | 0.166 | 0.23 | 0.002 | ||||||
| 0.19 | 0.27 | 0.15 | 0.26 | 0.003 | ||||||||
| 0.19 | 0.02 | 0.943 | 0.11 | 0.009 | 0.65 | 0.111 | ||||||
Note. — Col. (1): Physical parameter. Col. (2): Sample. Col. (3): Spearman correlation coefficient for type 1 AGN. Col. (4): Probability value that the correlation occurs by chance for type 1 AGN. Col. (5): Spearman correlation coefficient for type 2 AGN. Col. (6): Probability value that the correlation occurs by chance for type 2 AGN. Col. (7): Spearman correlation coefficient for type 1 AGN after the correction for the host contribution. Col. (8): Probability value that the correlation occurs by chance for type 1 AGN after the correction for the host contribution. Col. (9): Spearman correlation coefficient for type 2 AGN after the correction for the host contribution. Col. (10): Probability value that the correlation occurs by chance for type 2 AGN after the correction for the host contribution.
References
- Antonucci (1993) Antonucci, R. 1993, ARA&A, 31, 473
- Assef et al. (2010) Assef, R. J., Kochanek, C. S., Brodwin, M., et al. 2010, ApJ, 713, 970
- Assef et al. (2013) Assef, R. J., Stern, D., Kochanek, C. S., et al. 2013, ApJ, 772, 26
- Baldwin et al. (1981) Baldwin, J. A., Phillips, M. M., & Terlevich, R. 1981, PASP, 93, 5
- Barvainis (1987) Barvainis, R. 1987, ApJ, 320, 537
- Brinchmann et al. (2004) Brinchmann, J., Charlot, S., White, S. D. M., et al. 2004, MNRAS, 351, 1151
- Buat et al. (2021) Buat, V., Mountrichas, G., Yang, G., et al. 2021, arXiv e-prints, arXiv:2108.07684
- Cartier et al. (2015) Cartier, R., Lira, P., Coppi, P., et al. 2015, ApJ, 810, 164
- Cutri et al. (2013) Cutri, R. M., Wright, E. L., Conrow, T., et al. 2013, Explanatory Supplement to the AllWISE Data Release Products, Explanatory Supplement to the AllWISE Data Release Products
- Doré et al. (2018) Doré, O., Werner, M. W., Ashby, M. L. N., et al. 2018, arXiv e-prints, arXiv:1805.05489
- Ezhikode et al. (2017) Ezhikode, S. H., Gandhi, P., Done, C., et al. 2017, MNRAS, 472, 3492
- Fritz et al. (2006) Fritz, J., Franceschini, A., & Hatziminaoglou, E. 2006, MNRAS, 366, 767
- Gaskell & Peterson (1987) Gaskell, C. M., & Peterson, B. M. 1987, ApJS, 65, 1
- Glass (2004) Glass, I. S. 2004, MNRAS, 350, 1049
- Greene & Ho (2005) Greene, J. E., & Ho, L. C. 2005, ApJ, 630, 122
- Greene et al. (2020) Greene, J. E., Strader, J., & Ho, L. C. 2020, ARA&A, 58, 257
- Hao et al. (2011) Hao, H., Elvis, M., Civano, F., & Lawrence, A. 2011, ApJ, 733, 108
- Hao et al. (2010) Hao, H., Elvis, M., Civano, F., et al. 2010, ApJL, 724, L59
- Heckman et al. (2004) Heckman, T. M., Kauffmann, G., Brinchmann, J., et al. 2004, ApJ, 613, 109
- Hickox et al. (2017) Hickox, R. C., Myers, A. D., Greene, J. E., et al. 2017, ApJ, 849, 53
- Ho & Kim (2015) Ho, L. C., & Kim, M. 2015, ApJ, 809, 123
- Hönig & Beckert (2007) Hönig, S. F., & Beckert, T. 2007, MNRAS, 380, 1172
- Hönig & Kishimoto (2010) Hönig, S. F., & Kishimoto, M. 2010, A&A, 523, A27
- Hönig et al. (2013) Hönig, S. F., Kishimoto, M., Tristram, K. R. W., et al. 2013, ApJ, 771, 87
- Jiang et al. (2010) Jiang, L., Fan, X., Brandt, W. N., et al. 2010, Natur, 464, 380
- Jun & Im (2013) Jun, H. D., & Im, M. 2013, ApJ, 779, 104
- Kauffmann & Heckman (2009) Kauffmann, G., & Heckman, T. M. 2009, MNRAS, 397, 135
- Kauffmann et al. (2003) Kauffmann, G., Heckman, T. M., White, S. D. M., et al. 2003, MNRAS, 341, 33
- Kettlety et al. (2018) Kettlety, T., Hesling, J., Phillipps, S., et al. 2018, MNRAS, 473, 776
- Kim et al. (2018) Kim, J., Karouzos, M., Im, M., et al. 2018, Journal of Korean Astronomical Society, 51, 89
- Kim et al. (2021a) Kim, M., Barth, A. J., Ho, L. C., & Son, S. 2021a, ApJS, 256, 40
- Kim & Ho (2019) Kim, M., & Ho, L. C. 2019, ApJ, 876, 35
- Kim et al. (2021b) Kim, M., Jeong, W.-S., Yang, Y., et al. 2021b, Journal of Korean Astronomical Society, 54, 37
- Kong & Ho (2018) Kong, M., & Ho, L. C. 2018, ApJ, 859, 116
- Koshida et al. (2014) Koshida, S., Minezaki, T., Yoshii, Y., et al. 2014, ApJ, 788, 159
- Lanzuisi et al. (2014) Lanzuisi, G., Ponti, G., Salvato, M., et al. 2014, ApJ, 781, 105
- Lawrence (1991) Lawrence, A. 1991, MNRAS, 252, 586
- Lusso et al. (2013) Lusso, E., Hennawi, J. F., Comastri, A., et al. 2013, ApJ, 777, 86
- Lyu & Rieke (2018) Lyu, J., & Rieke, G. H. 2018, ApJ, 866, 92
- Lyu et al. (2017) Lyu, J., Rieke, G. H., & Shi, Y. 2017, ApJ, 835, 257
- Lyu et al. (2019) Lyu, J., Rieke, G. H., & Smith, P. S. 2019, ApJ, 886, 33
- Maiolino et al. (2007) Maiolino, R., Shemmer, O., Imanishi, M., et al. 2007, A&A, 468, 979
- Marconi et al. (2008) Marconi, A., Axon, D. J., Maiolino, R., et al. 2008, ApJ, 678, 693
- McLaughlin et al. (1996) McLaughlin, M. A., Mattox, J. R., Cordes, J. M., & Thompson, D. J. 1996, ApJ, 473, 763
- Mor & Netzer (2012) Mor, R., & Netzer, H. 2012, MNRAS, 420, 526
- Mor & Trakhtenbrot (2011) Mor, R., & Trakhtenbrot, B. 2011, ApJL, 737, L36
- Mountrichas et al. (2020) Mountrichas, G., Georgantopoulos, I., Ruiz, A., & Kampylis, G. 2020, MNRAS, 491, 1727
- Nenkova et al. (2008) Nenkova, M., Sirocky, M. M., Nikutta, R., Ivezić, Ž., & Elitzur, M. 2008, ApJ, 685, 160
- Netzer et al. (2016) Netzer, H., Lani, C., Nordon, R., et al. 2016, ApJ, 819, 123
- Netzer et al. (2007) Netzer, H., Lutz, D., Schweitzer, M., et al. 2007, ApJ, 666, 806
- Onken et al. (2004) Onken, C. A., Ferrarese, L., Merritt, D., et al. 2004, ApJ, 615, 645
- Pâris et al. (2018) Pâris, I., Petitjean, P., Aubourg, É., et al. 2018, A&A, 613, A51
- Park et al. (2012) Park, D., Kelly, B. C., Woo, J.-H., & Treu, T. 2012, ApJS, 203, 6
- Peterson et al. (1998) Peterson, B. M., Wanders, I., Horne, K., et al. 1998, PASP, 110, 660
- Pier & Krolik (1992) Pier, E. A., & Krolik, J. H. 1992, ApJ, 401, 99
- Rakshit et al. (2020) Rakshit, S., Stalin, C. S., & Kotilainen, J. 2020, ApJS, 249, 17
- Ricci et al. (2017) Ricci, C., Trakhtenbrot, B., Koss, M. J., et al. 2017, ApJS, 233, 17
- Richards et al. (2006) Richards, G. T., Lacy, M., Storrie-Lombardi, L. J., et al. 2006, ApJS, 166, 470
- Roseboom et al. (2013) Roseboom, I. G., Lawrence, A., Elvis, M., et al. 2013, MNRAS, 429, 1494
- Sánchez et al. (2017) Sánchez, P., Lira, P., Cartier, R., et al. 2017, ApJ, 849, 110
- Simpson (2005) Simpson, C. 2005, MNRAS, 360, 565
- Skrutskie et al. (2006) Skrutskie, M. F., Cutri, R. M., Stiening, R., et al. 2006, AJ, 131, 1163
- Stalevski et al. (2017) Stalevski, M., Asmus, D., & Tristram, K. R. W. 2017, MNRAS, 472, 3854
- Stalevski et al. (2016) Stalevski, M., Ricci, C., Ueda, Y., et al. 2016, MNRAS, 458, 2288
- Stern et al. (2012) Stern, D., Assef, R. J., Benford, D. J., et al. 2012, ApJ, 753, 30
- Suganuma et al. (2006) Suganuma, M., Yoshii, Y., Kobayashi, Y., et al. 2006, ApJ, 639, 46
- Sun et al. (2018) Sun, M., Grier, C. J., & Peterson, B. M. 2018, PyCCF: Python Cross Correlation Function for reverberation mapping studies, ascl:1805.032
- Toba et al. (2021) Toba, Y., Ueda, Y., Gandhi, P., et al. 2021, ApJ, 912, 91
- Trump et al. (2015) Trump, J. R., Sun, M., Zeimann, G. R., et al. 2015, ApJ, 811, 26
- Urry & Padovani (1995) Urry, C. M., & Padovani, P. 1995, PASP, 107, 803
- Woo et al. (2013) Woo, J.-H., Schulze, A., Park, D., et al. 2013, ApJ, 772, 49
- Wright et al. (2010) Wright, E. L., Eisenhardt, P. R. M., Mainzer, A. K., et al. 2010, AJ, 140, 1868
- Yang et al. (2020) Yang, G., Boquien, M., Buat, V., et al. 2020, MNRAS, 491, 740
- Yang et al. (2018) Yang, Q., Wu, X.-B., Fan, X., et al. 2018, ApJ, 862, 109
- Zhao et al. (2019) Zhao, D., Ho, L. C., Zhao, Y., Shangguan, J., & Kim, M. 2019, ApJ, 877, 52
- Zhao et al. (2021) Zhao, Y., Ho, L. C., Shangguan, J., et al. 2021, ApJ, 911, 94
- Zhuang et al. (2018) Zhuang, M.-Y., Ho, L. C., & Shangguan, J. 2018, ApJ, 862, 118