UGPS J194310+183851: an Unusual Optical and X-ray Faint Cataclysmic Variable?
Abstract
The growing number of multi-epoch optical and infrared sky surveys are uncovering unprecedented numbers of new variable stars, of an increasing number of types. The short interval between observations in adjacent near infrared filters in the UKIDSS Galactic Plane Survey (UGPS) allows for the discovery of variability on the timescale of minutes. We report on the nature of one such object, through the use of optical spectroscopy, time-series photometry and targeted X-ray observations. We propose that UGPS J194310.32+183851.8 is a magnetic cataclysmic variable star of novel character, probably featuring a longer than average spin period and an orbital period likely to be shorter than the period gap (i.e. 2 hours). We reason that the star is likely a member of the short period Intermediate-Polar subclass that exist below this period boundary, but with the additional feature that system’s SED is fainter and redder than other members of the group.
keywords:
Stars: novae, cataclysmic variables – stars: peculiar – stars: variables: general – stars: individual: UGPS J194310.32+183851.81 Introduction
The object UGPS J194310.32+183851.8 (hereafter referred to as Source 363, Lucas et al. 2017) was imaged twice as part of the UKIDSS Galactic-Plane Survey (UGPS), displaying 1.97 mag infrared variability in K over the 4 year interval and H emission in the IPHAS survey photometry (Drew et al., 2005). One of the infrared colours was exceptionally blue: . Lucas et al. suggested that this might be due to variability on the 7 minute timescale of UKIDSS filter changes, supported by marginal detections in the 2MASS images that suggested unremarkable colours. Additionally, the Gaia satellite has determined a fairly nearby location (see Section 2.1). Consequently, from the lack of any previous detection of hard X-rays, gamma rays or radio waves by facilities such as Fermi-LAT, ROSAT and the Very Large Array Sky Survey (VLASS), (Atwood et al., 2009; Voges et al., 1999a; Lacy et al., 2020), we infer that the system does not contain a neutron star or black hole. Thus we must be looking at a white dwarf (WD) binary system most likely of the cataclysmic variable (CV) type.
Cataclysmic variables (CVs) are binary systems containing a WD and a close companion (of comparatively low mass), wherein the WD primary accretes mass via Roche-lobe overflow from the secondary star (see Knigge et al. 2011 and Schreiber et al. 2021 for comprehensive reviews). These systems are subdivided into magnetized and unmagnetized systems (based largely on the presence or absence of pulsations caused by the accretion flow proceeding along the magnetic field lines), and further subdivided based upon the method of WD accretion. The magnetic CVs consist of polars and intermediate polars (IPs). Polars accrete matter following the magnetic field lines directly to the surface of the primary due to their high magnetic field strengths of 7-230MG (Oliveira et al., 2017). This high field strength also causes the orbit and the spin of the WD’s magnetosphere to become synchronous. In contrast, in IPs the Alfven radius is smaller than the circularization radius of the accretion disc, but larger than the white dwarf’s radius, allowing an outer disc to exist. This disc is truncated, and then leads to the flow following magnetic field lines at free-fall velocity in the inner region. These systems are also notable for the spin and orbital periods ( & ) being different from one another. It should be noted that a small subgroup of IPs can transfer mass via both disc-fed and stream-fed methods; for example FO Aqr, TX Col (Littlefield et al. 2020, Littlefield et al. 2021) and others still are known to be solely stream-fed and are referred to as discless IPs, such as EX Hya and DW Cnc (Andronov & Breus, 2013; Rodríguez-Gil et al., 2004).
Their hard spectrum arises because the gas is in free-fall on to a white dwarf, so if the accretion column is optically thin, the emission will come out as bremsstrahlung radiation with energies keV. The innermost region will usually be optically thick, and then can give emission in soft X-rays or EUV, depending on the luminosity and the size scale of the polar region spot at the base of the accretion column. It’s reasonable that some of these are missed because of absorption effects, but that’s still unsettled. X-ray spectra frequently show ionized iron in emission, caused by shock excitation from the free-falling disk material.
In the optical regime, the systems are highly variable and multi-periodic, with periodicities associated with the WD spin, the binary orbit and beat interactions between these two periods. Spectrally, IPs are characterised by broad emission of hydrogen recombination lines, as well as emission of helium (both neutral and ionized), carbon and nitrogen. Absorption features can be used to understand the composition of the companion (providing they are of high signal to noise), as well as the disc inclination. By comparison, polars have stronger but narrower emission features (often having Zeeman splitting due to the high magnetic field strength), including a prominent doubly ionized nitrogen line at 4650Å produced in the accretion column.
In this paper we present the discovery of Source 363’s nature as a new magnetic CV. We report on optical spectroscopic observations showing unusually broad emission lines (Section 3.1). We then detail numerous photometric monitoring observations which illustrate the system’s behaviour on short timescales (Section 3.2), revealing periodicity at 2760s. Finally we report on new X-ray observations by the Neil Gehrels Swift Observatory (hereinafter Swift) which have provided the first detections of X-ray emission from the source, consistent with our classification of the source as an accreting WD system (Section 3.3). We then conclude with a discussion on the nature and novel properties of the source, given the various dichotomies our combined approach has uncovered (Section 4).
2 Source Information and Observations
2.1 Source Characteristics
Previous optical and infrared observations of the source have been carried out as part of UGPS, 2MASS, UVEX, IPHAS, Gaia and Pan-STARRS (Lucas et al. 2008; Skrutskie et al. 2006; Groot et al. 2009; Drew et al. 2005; Gaia Collaboration et al. 2018, 2021; Flewelling 2017). They reveal the source to be an optically faint but comparatively infrared-bright variable star (Table 1111[1]:Contreras Peña et al. (2014); Lucas et al. (2008),[2]:Monguió et al. (2020),[3]:Gaia Collaboration et al. (2021, 2018, 2016),[4]:Flewelling (2017)) , with a prominent H excess. Rapid variability is clearly seen in the sparsely sampled Pan-STARRS 1 optical light curve: it varies by a factor of 4 in 15 minutes or less in , confirming the fast nature of the source’s variability. This indicates that the system includes a compact object of some type. The latest distance from Bailer-Jones et al. (2021) using Gaia EDR3 put the star at pc, which leads to an absolute magnitude in of 10.61, although some care should be taken with this due to the variability of the source, as the prior used by Bailer-Jones et al. (2021) is more suited to non-variable stars. All these features together were indicative of Source 363 possibly being a compact object, although there was no associated X-ray emission recorded in previous all-sky surveys, so the flux must be less than , the limit for ROSAT (Voges et al., 1999a). The absence of X-rays of the required intensity can safely rule out a neutron star system, but a CV system would still be plausible for a faint X-ray source. The combination of the strong, rapid variability and the lack of X-ray emission in all-sky surveys led to the acquisition of targeted X-ray observations, several high cadence light curves, and an optical spectrum.
| Survey | Filter | Mean Magnitude & Error | No. of Epochs | Maximum Variation (mag) |
|---|---|---|---|---|
| UKIDSS | 16.700.08 | 2 | 1.97 | |
| UKIDSS | 18.360.11 | 1 | N/A | |
| UKIDSS | 17.760.03 | 1 | N/A | |
| IGAPS | 20.540.06 | 4 | 1.94 | |
| IGAPS | 19.420.06 | 2 | N/A | |
| IGAPS | 19.270.07 | 2 | N/A | |
| IGAPS | RGO | 19.680.03 | 2 | 0.37 |
| Gaia | 20.020.10 | 3 | 0.72 | |
| Pan-STARRS | 20.350.04 | 8* | 1.46 | |
| Pan-STARRS | 20.830.07 | 8 | 1.82 | |
| Pan-STARRS | 19.640.07 | 4* | 0.55 |
2.2 SOAR Observations
2.2.1 Spectroscopy
We obtained a single low-resolution spectrum of the source on 2021 May 12 with the Red Camera of the Goodman Spectrograph (Clemens et al., 2004) on the SOAR telescope. The exposure time was 1800 s, and the observation used a 400 l mm-1 grating and a 0.95″slit together with a GG395 long-pass filter, yielding a full-width at half-maximum resolution of 5.4Å (about 250 km s-1) over a usable wavelength range –7820 Å.
The spectrum was reduced and optimally extracted in the usual manner using IRAF (Tody, 1986). The resulting spectrum has an average signal to noise ratio of per resolution element ( per pixel) in the continuum.
2.2.2 Imaging
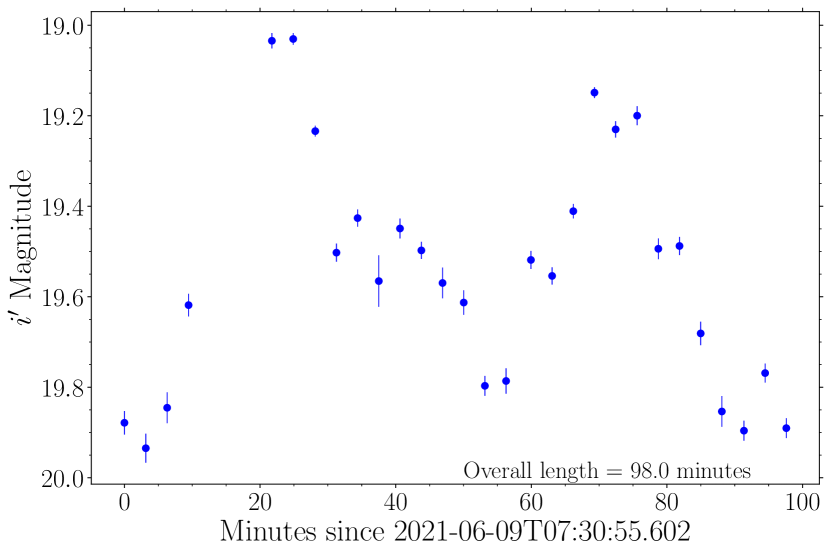
Follow up imaging was obtained on 2021 June 9, using the Red Camera of SOAR/Goodman in imaging mode. We obtained 29 exposures, each of 180 s duration, using the SDSS filter. These totalled 87 min on source over a time span of 98 min. The average airmass was 1.62 and typical seeing was .
The raw images were corrected for bias and then flat-fielded with sky flats using standard routines in IRAF (Tody, 1986). We performed differential photometry of Source 363 with respect to 17 nearby, non-variable stars and calibrated these magnitudes using their Pan-STARRS DR2 (Chambers et al., 2016) mags, the final results can be seen in Figure 4.
2.3 WHT Observations
We made use of recently offered service time on the William Herschel Telescope for testing the new PF-QHY camera222See the instrument page for details: ’www.ing.iac.es/astronomy/instruments/pf-qhy/’ to obtain two high cadence light curves. These were using Sloan u’ and r’ filters, with 62 & 61 epochs of data covering 90 and 89 minutes respectively and individual exposures of 80 seconds in each band. PF-QHY is a wide-field camera with a CMOS detector, its field of view being 10.7’ by 7.1’ and a pixel scale of using 4x4 binning. Data reduction and calibration were carried out using the photutils (Bradley et al., 2021) and astropy (Astropy Collaboration et al., 2013, 2018) libraries for python, with profile-fitting photometry being used in the crowded r’ images. Aperture photometry was used in the u’ images as the field is comparatively less populated with sources. Calibration was done via a standard star SP 1942+261, with corrections to individual epochs being averaged across non-variable stars in each frame.
2.4 Swift XRT/UVOT Observations
We obtained X-ray and UV data from Swift via a successful target of opportunity (ToO) program on the 2 of July 2021, using both the XRT and UVOT instruments in parallel, with 4 ks of observation in the photon-counting mode. These data produced the standard X-ray images, light curve and spectrum, as well as additional images and a light curve in the UVOT U filter. The data were provided pre-reduced via the Swift ToO server (Evans et al. 2020, 2009) with the spectrum being fitted with a power law, and adjusted for galactic absorption along the line of sight. Calibration for the UVOT data was done in python using the same packages described previously. All other XRT reduction was carried out using XSPEC, using the specific setup for Swift-XRT.
3 Results and Analysis
3.1 Optical Spectrum
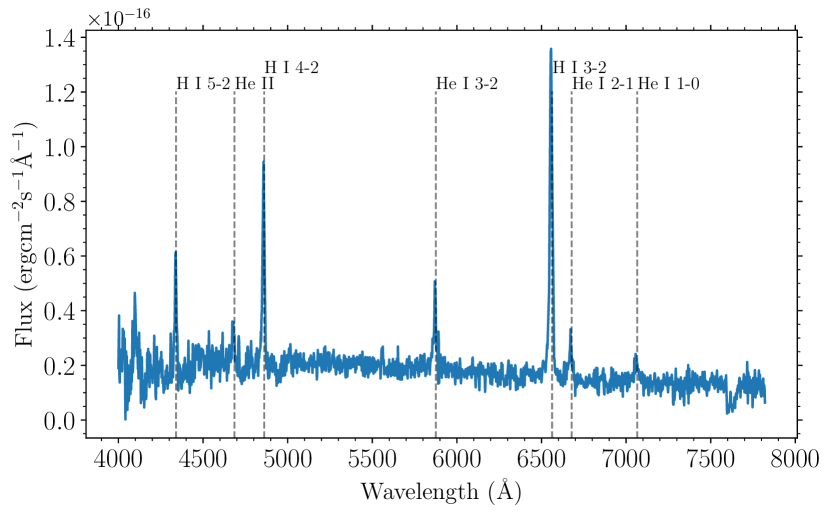
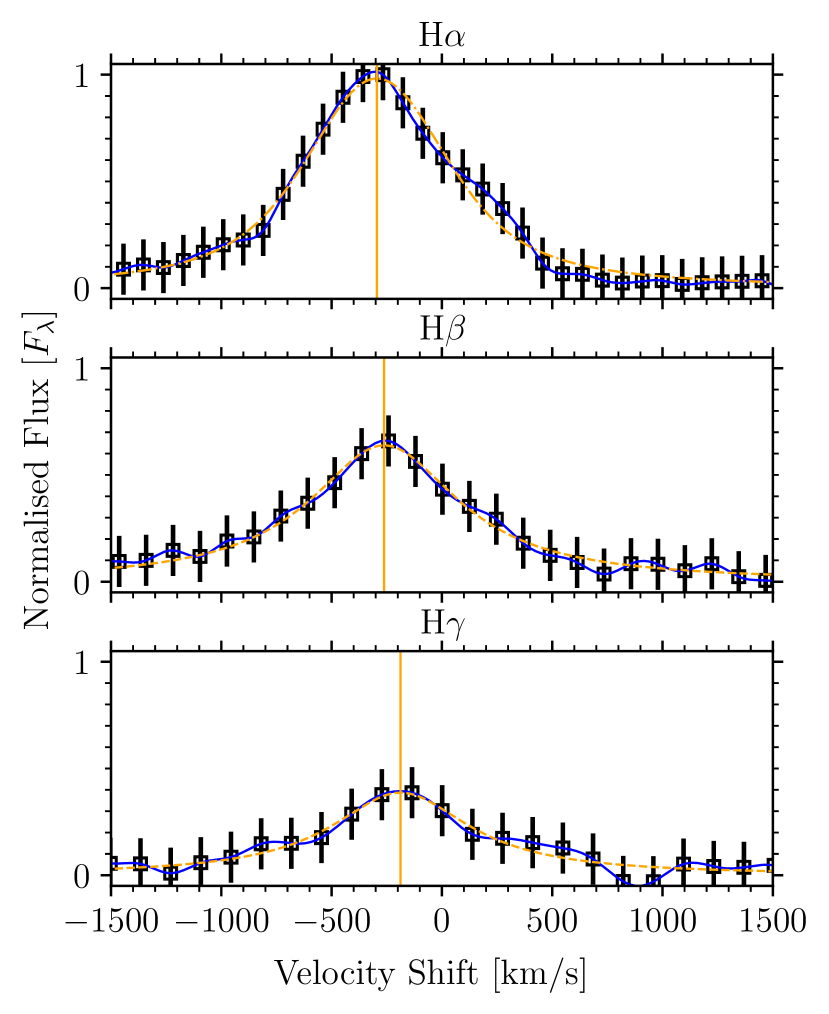
The SOAR spectrum (Figure 2) displays a number of features consistent with CVs in general, most notably H and H in emission, with additional emission features from both neutral and singly-ionized helium (see Table 2 for details of individual lines). All emission lines are broad and single-peaked, with a wavelength resolution of at 5910Å (the mid-point of the spectrum). The wide range of velocities suggests the presence of a disc, or possibly a symmetric wind, although this cannot be further identified due to the blending of any C iii / N iii lines into the wings of the He ii line at 4686Å. Fitting of line profiles (using a Voigt profile to account for both Doppler and Stark broadening) provides an average radial velocity (RV) of , see Figure 3. This value, while high, is not unexpected when only one spectrum is available, and the system’s mean radial velocity is likely less than this. Some absorption features could be present in the spectrum, however the modest S/N (14 per resolution element) precludes any reliable identification of these, and thus we have to determine the characteristics of the companion star through another method.
From the equivalent width (EW) ratio of we cannot be certain whether the system’s accretion is primarily magnetic (see Silber 1992), due to the noise in the detection of the He ii line: a ratio above 0.4 is indicative of magnetically controlled accretion. It should be noted that those authors also suggest that the EW of H should be Å in magnetic systems: here we have EW=49.3Å. We reason that the observed hydrogen line ratios may be as a result of a more complete than usual disk (for an IP), bearing resemblance to those observed around dwarf-novae. In those cases the slower rotating outer disk regions limit the excitation of the more energetic recombination lines, leading to lower fluxes from H and H than normal IPs.
We cannot be sure if Source 363 was in a brighter than average state at the time of observation; pre-spectroscopic imaging places the star at an intermediate brightness level (compared to its maxima and minima). However we cannot interpret whether the star was pre- or post-outburst, which given the length of the subsequent observation could place the star at either state. This is especially true given the low S/N of the He ii line, meaning that the true ratio might be higher than the 0.4 value that is assumed to indicate magnetized accretion.
In comparison to objects from the literature, we note the absence of emission from N iii and C iii, which is commonly seen in fully magnetic polars (Warner, 1995). In addition the fringes of the line do not contain the characteristic absorption features that are associated with a high disc inclination angle. Given that a broad range of velocities is observed the disc inclination angle cannot be very low so we can reason that the inclination angle is intermediate. The same line can also show the hallmarks of cyclotron radiation, as an overall increase in the localised continuum, which we note that Source 363 does not display, so cyclotron radiation is unlikely to be the cause of the observed near infrared excess.
| Emission Line | Equivalent width & Error | Width |
|---|---|---|
| Units | Å | (kms-1) |
| H i 4340Å (5-2) | -21.75.7 | 1746.6 |
| H i4861Å (4-2) | -49.32.6 | 2302.9 |
| H i6562Å (3-2) | -161.62.2 | 2747.5 |
| He i5875Å (3-2) | -31.34.2 | N/A |
| He i6678Å (2-1) | -19.45.2 | N/A |
| He i7065Å (1-0) | -16.24.9 | N/A |
| He ii4685.7Å | -9.05.1 | N/A |
3.2 Light Curves
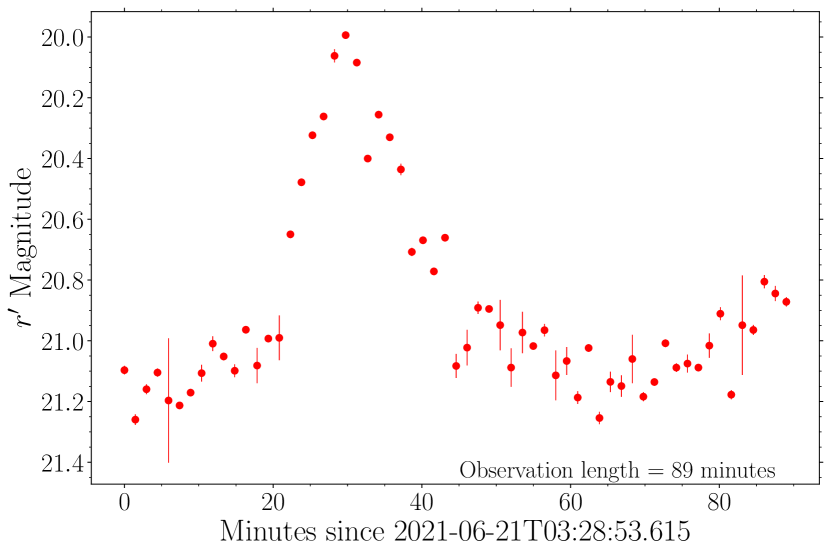
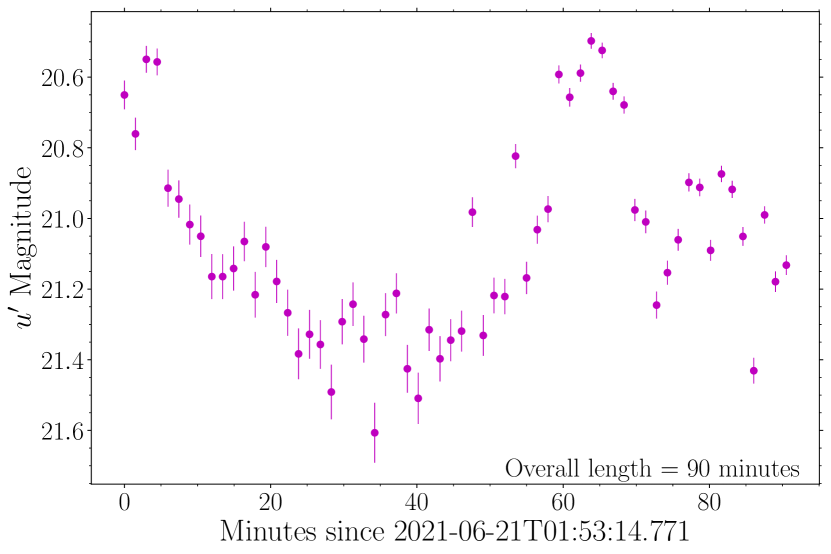
The three light curves (Figures 4, 5 and 6 for , and respectively) each display amplitudes between 0.9 and 1.2 mag, but each wavelength shows differing behaviour: The curve shows symmetric behaviour with minimal time spent at either bright or faint states, whereas the curve is at a faint level for approximately two thirds of the observation, with the rise taking min, followed by a 20 min decline to a state of quiescence, resembling behaviour reminiscent of stream-fed accretion on to the WD. This is similar to that seen in polar-type magnetic CVs (mCVs). The longer duration observations in show two peaks, with a separation and shape consistent with the data, including the scatter about the curves’ minima. The peaks are separated by minutes and minutes for i’ and u’ respectively, with the r’ curve having a less clear cycle, although the curves’ minima are separated by minutes. These estimates provide a rough baseline for the most visible timescales of variability.
The and light curves show small amplitude variation at low brightness states not seen at the maxima, although at this time it cannot be wholly rejected that these are indicators of short period variability (not unlikely given the magnetohydrodynamic processes present in the disc). We investigated this by fitting a third order spline to the phase-folded light curve (using scipy, Virtanen et al. 2020) and checking the residuals to this fit. This revealed no obvious periodicity. It would seem therefore that the variations during the system’s minima are more likely the result of increased sensitivity to the atmospheric conditions during the observations. In addition a 19 hour LC (with approximately 1 hour on-source) in UVOT U-band was produced, consisting of 6 epochs of varying exposure time. Whilst not much can be gleaned from the shape (given the known rate of variability), the maximum amplitude was 0.8 mag, in keeping with data from other bands.
Interpreting the nature of the observed variability is a challenge due to the limited time span of the observations, although a few causes can be inferred. A common cause of variability in CVs is flickering, a phenomenon that is thought to relate to modulation of the accretion rate and flares associated therein (see Bruch 2021 for a comprehensive review). A second driver of variability could be the spin of the WD primary star, seen via the accretion columns or polar hot-spots (depending on observed wavelength). A complication can arise from the orbital side-band: a side-band represents the reprocessing of the WD primary’s emission by its disc, which causes an interaction between the spin period and the orbital period of the secondary, observed as a distinct frequency, , with a positive sign in most in cases, e.g. AO Psc (Bonnardeau, 2015) and a negative sign if the orbit is retrograde. While there are currently not enough individual cycles to confirm any periods, we note that the lack of observed periodicities at short timescales (20 min) in any of the curves is interesting. This could imply that the WD does not spin at the common period of approximately 10-15 min.
3.3 X-ray Photometry
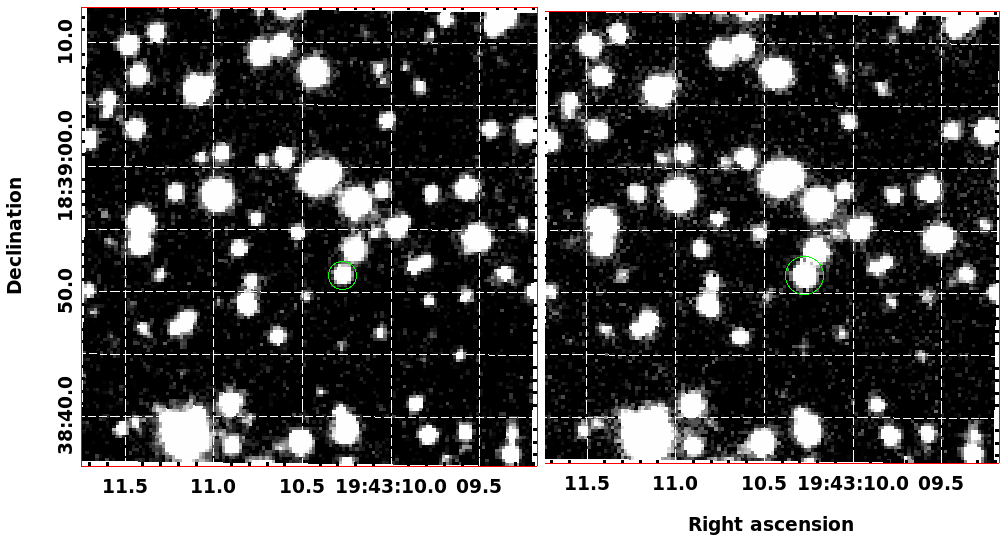
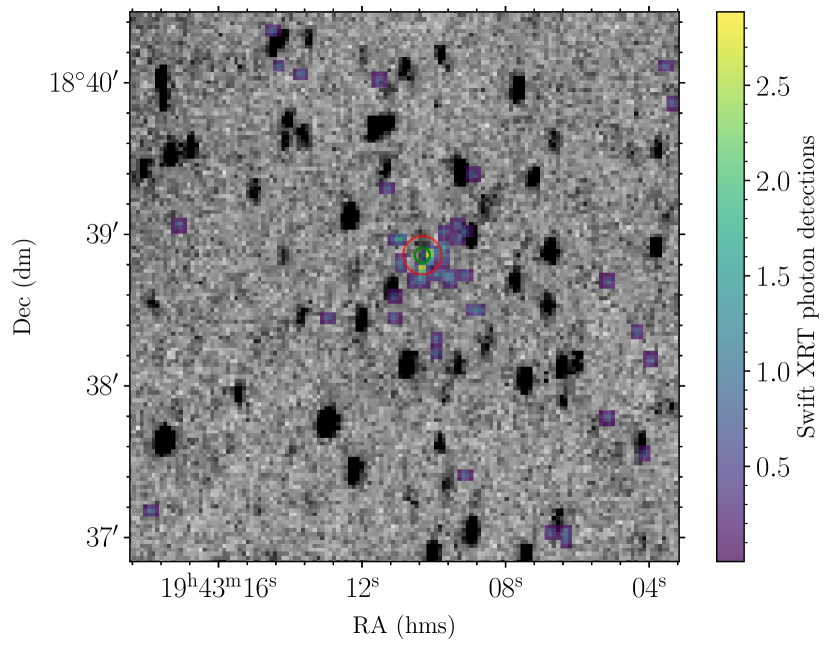
The Swift-XRT observations detect a single source at RA = 295.7935∘, and Dec = 18.6475∘ with an astrometric uncertainty of 3.0″ (see figure 7) given by the Swift-XRT data products generator’ software (Evans et al., 2014). These coordinates are offset from the optical/IR coordinates by 1.9″, which is consistent with zero offset within the uncertainties. We note that the rather scattered distribution of X-ray photons shown in Figure 7 is typical of Swift/XRT observations of a single faint source, see https://www.swift.ac.uk/analysis/xrt/xrtcentroid.php for an example of how real sources are distinguished from noise.
Given the lower resolution of Swift’s instruments than the optical ones discussed thus far, the possibility of chance association should be considered. The measured X-ray flux is brighter than the ROSAT sensitivity limit (see below). Therefore we consider X-ray source density of 0.27 objects per square degree in the Galactic plane, as determined from the ROSAT catalogue Voges et al. (1999b)) at Galactic coordinates , . With this figure the probability of a chance alignment within 3.0″ is . Given that the fitted XRT spectrum is brightest at the lower energy regime, the low sensitivity of ROSAT to higher energies is not detrimental to this estimation. Further to this, whilst there are two optical/IR sources within the XRT astrometric uncertainty radius, the associated UVOT light curve displayed high amplitude variability consistent with that observed in Source 363 and the second star is not optically variable. Therefore it is clear that the XRT X-ray source is Source 363.
The average count rate over the length of observations was 0.01375 counts ; this was then converted into a flux via fitting an absorption adjusted power law to the XRT spectrum (see section 2.4), with a model temperature of 20 keV. The previous lack of detections implied that the overall flux would be low, but our measured fluxes (adjusted for absorption) of are above the lower limits for surveys such as ROSAT, making the non-detection interesting. Luminosities corresponding to these fluxes have a range that’s higher than average for IPs. Depending on the distance used, luminosity ranges from to , at the closest and furthest distance estimates respectively (as discussed in Section 2.1). The associated X-ray light curve shows only an intermittent signal, implying that the source has a more extreme bright to faint state ratio than other similar stars.
4 Discussion
4.1 Comparison to sources in the literature
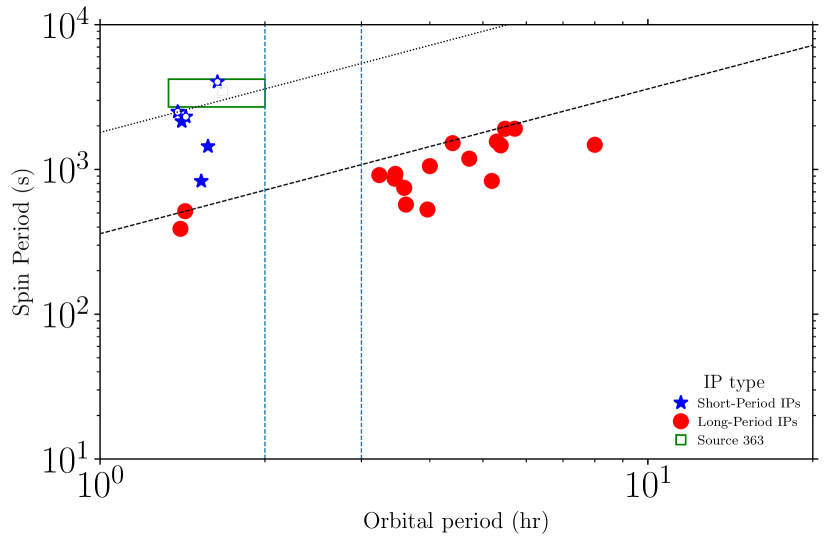
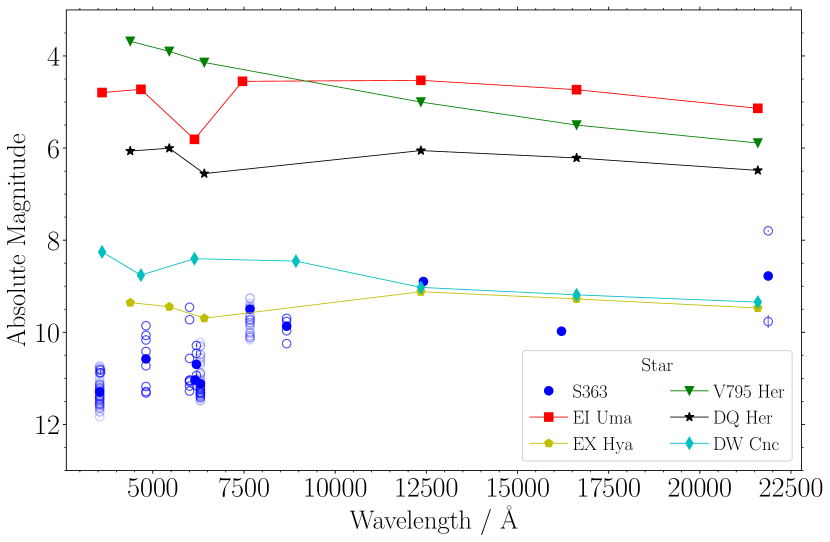
Existing IPs with some degree of similarity to Source 363 have often been detected either through their X-ray emission or optical narrow-band flux. Thus we must compare the overall behaviour of Source 363 to these systems, in order to understand the observed behaviour. Constructing some approximate optical to near infrared spectral energy distributions (SEDs) (see Figure 9) we note that Source 363 has both the lowest overall luminosity at the wavelengths measured and an unexpectedly faint optical SED. This SED has been formed by averaging all available measurements at each wavelength (including each individual measurement from this work, as well as all available archive data), with the full range of values also marked on the plot. It should be noted that the J (1.25 m) and H (1.65 m) data are single measurements that may not be representative: the datum may be near a peak value, given the exceptionally blue colour (see ). Having noted this caveat, the SED appears to have a redder slope than other systems, possibly a byproduct of the disk being optically thicker than other examples. The two most similar objects (EX Hya and DW Cnc) are both short-period systems that lack discs, and exist in a separate portion of the IP spin-orbit period diagram, where (see Figure 8 333References for Figure 8: Hilton et al. (2009), Rodríguez-Gil et al. (2004), Andronov & Breus (2013), Buckley et al. (1998); Buckley & Tuohy (1989), Hellier (1993), Kemp et al. (2002), Norton et al. (2002), Staude et al. (2003), Woudt & Warner (2003); Woudt et al. (2012),Kim et al. (2005), Joshi et al. (2011), Masetti et al. (2012), Mateo et al. (1991), Kaluzny & Semeniuk (1988), Burwitz et al. (1996), Hellier (1997); Evans et al. (2006), Norton et al. (2002), Pretorius (2009), Sazonov et al. (2008) - The URL of the Mukai’s ’The Intermediate Polars’ (where this data is collated) is as follows: ’https://asd.gsfc.nasa.gov/Koji.Mukai/iphome/iphome.html’), as opposed to the more common ratio .
We propose that our source might also be a part of this small population, given the lack of a detectable short spin period in any of our observations, and the orbital period lower limit given the low mass of the companion (see Section 4.2). Our light curve is also similar in shape to DW Cnc (Rodríguez-Gil et al., 2004), although it is a factor 2 higher in amplitude, with both sources having periods of under an hour. The corresponding light curve from the same night of observations shares little in common with any typical IP system in the literature.
A more comparable object is the short-period IP V598 Peg (SDSS J233325.92+152222.1, Southworth et al. 2007 & Szkody et al. 2005), which has a spin period of 43 minutes, and a confirmed (via XMM-Newton direct observations by Hilton et al. 2009) orbital period of 86 minutes. The shape of the optical light curve when phase folded (Figure 4 in Hilton et al.) is almost identical to the r’ band curve (see Figure5). In addition, the H to H ratio of 1.87 is of a similar order to Source 363’s.
To compare our spectrum to the literature, we find Oliveira et al. (2017) to be a good source of similar candidates due to their survey also using SOAR’s Goodman spectrograph. Source 363’s slightly blue continuum (by comparison to polar-like sources) and broad lines bear the closest resemblance to MLS2054-19, MLS0720+17, CSS1012-18 and SSS1359-39 (see Figure 1 in the aforementioned paper). Interestingly, three of these are classified by those authors as discless IPs (MLS0720+17 was suggested to be a polar). Some small differences to these sources are worth noting, in particular the relative strength of the H line compared to H, with all of these sources having the 4-2 transition as strong or stronger than the 3-2 line, the inverse of our finding.
4.2 Nature of the System?
As it stands, we can say with some confidence that if the apparent 45-70 minute variation timescales are related to the WD spin period (e.g. with the spread of values caused by stochastic flickering) then the system cannot be a polar CV. All hydrogen-rich stars will over-fill, rather than fill, their Roche lobes for such short periods (leading to a rapid cut off of the mass transfer via magnetic braking), and the optical spectrum of the source clearly shows strong hydrogen emission lines, indicating that accretion is taking place. The argument could be made that there are two accretion streams, from both poles of the WD being magnetized (synchronising the system) much like the system V2400 Oph (Hellier & Beardmore, 2002), and thus the spin period would then be on the order of 90 minutes. However given that the spectrum suggests a disc, it is more likely the orbital period is longer than the spin period and just below ‘period gap’, making the system some form of IP.
With the IP explanation preferred based on the optical spectrum, it then becomes important to investigate the evolutionary state of the system, in order to explain the unusual behaviour (high amplitude, red SED and low overall luminosity). We can add constraints to the orbital period of the system by considering its near-infrared brightness and the amplitude of the associated variability; using the Bailer-Jones Gaia EDR3 distance of 900.7 pc, we find Source 363 has , and in order to explain the observed variability the companion object must be be at least one magnitude fainter than that. This is because the variability is intrinsic to the WD, and thus the companion must not be providing the majority of the flux. These two factors combined lead us to place constraints on the classification of the companion, finding that it should be no more massive than an M3V star at 0.36 (Pecaut & Mamajek, 2013). This proposed limit on the companion mass would put the orbital period at roughly 2.5 hours or less, where a 2.5 hr period sits in the IP ‘period gap’. Equally using Figure 13 in Knigge et al. (2011) for our two Ks observations leads to orbital period limits of between 2.1 and 1.4 hours. While this is a wide spread of values it does place the system below the period gap, in the region between that and the minimum IP orbital period of 80 minutes.
Thus we can reasonably then assume the orbital period is less than the 2.1 hour lower limit (Rappaport et al., 1982), especially given the higher than average X-ray luminosity (stars within the gap have very low accretion rates, and thus low X-ray luminosity). Additionally a companion star of the described nature would have a short orbital period if in an IP-like system, lending further credence for Source 363 to exist below the period-gap. There is an argument to be made that the orbital period is in fact less than 90 minutes, as can be seen in Figure 8, because a number of short-period IPs (including the aforementioned V598 Peg) have settled into orbital periods at twice that of the white dwarf spin, but with the same magnetic moment as more normal IPs, as predicted in Webbink & Wickramasinghe (2002). With an orbital period in this range we would expect a typical IP system to have a spin period on the order of 5-9 minutes, which is not seen in our data, hence we posit that Source 363 may be a member of the short period sub-class mentioned above. This would roughly place the spin period of the white dwarf between 41 and 63 minutes, which mimics the timescales observed in our optical data.
Finally the observed strong IR excess (as described in Section 4.1) can then be assumed to be tracing the accretion flow, made more likely due to the lack of cyclotron emission features in the optical spectrum. Combining this with the short period, we can infer that our system has a reasonably high accretion rate for its short-period type. The method for this accretion is still uncertain, but is could be novel; Our light curves suggest direct accretion, whilst our SED and spectra suggest the presence of a disc, and thus disc-fed accretion. In order to make sense of this dichotomy, there is a possible explanation that Source 363 is currently undergoing an evolutionary transition between a typical (long-period) IP, and the short-period systems, such as has been described by Southworth et al. (2007) and Norton et al. (2008).
There is currently an open question as to what the number density of short-period IPs should be (Pretorius & Mukai, 2014). The small binary separations in short period systems should easily allow the WD magnetic fields to connect with the convective donor star, and thus quickly synchronise the orbits, with system thus becoming a polar CV - provided (Norton et al., 2004). This interpretation would render the subgroup short-lived, thus explaining their low observed numbers. On the other hand white dwarf magnetic fields can fall over time (Ohmic decay), and hence dramatically extend the time taken to become synchronous, in turn making such systems quite old, increasing the number density of this subgroup by extension. With a higher accretion rate than usual for short-period IPs, ram pressure would likely exceed magnetic pressure, which would then produce a disc, lending credence to this explanation for Source 363.
5 Conclusions
We report on the discovery of a new magnetic cataclysmic variable star system with an observed near-infrared excess, and have determined that our source is most likely a short-period IP system, with a higher than average accretion rate. This decision was based upon the following:
-
•
Our optical spectrum shows emission of H i, He i and He ii, all of which are indicators of magnetic CV systems. In addition the presence of disc-like features indicates that the magnetic field is not solely responsible for the accretion, making the case that the star is a polar unlikely.
-
•
The low optical luminosity of the system implies a low mass companion to the WD, which sets an upper limit on the orbital period of the binary.
-
•
Combining this with the lack of an obvious spin period near the expected range of 5 to 9 minutes, we can infer that the system does not fit with the standard 1 : 10 ratio between spin and orbital timescales. This deduction then places Source 363 within the loose group of short-period IPs, such as EX Hya.
-
•
The confirmed detection of X-ray emission from the system in targeted observations is interesting given that the star is absent from previous wide field X-ray surveys that cover the region (it does not feature in Pretorius et al. 2013). The non-detection by ROSAT would normally suggest that the overall X-ray luminosity is lower than typical IPs, a phenomenon that has been observed in other short-period systems. However, the measured X-ray luminosity of (using the Gaia EDR3 Bailer-Jones estimated distance of 900 pc) is higher than that of most short period IPs and we would expect the source to have been detected by ROSAT, if the luminosity were constant. We can then infer that this system goes through bright phases, relative to an otherwise faint X-ray flux level.
-
•
Additionally, we make a case that given the short orbital period and low optical brightness, that the system has a lower than average accretion rate (for an IP in general) and a companion star of a very faint type. This provides contrast with other short-period systems, making Source 363 seem fairly unique.
With such an unusual nature, implications from this work are twofold:
-
•
It re-iterates that there is a population of under-luminous CVs that continue be missed in all wide area X-ray surveys completed thus far. But this work indicates a chance that the X-ray luminosity of these sources may not be as low as current literature suggests. Previous short-period systems have whereas Source 363 ( erg s-1) shows that these systems can exist above this cut but still below the more usual value of seen in typical IP systems. With the suggestions of a population of under-luminous IPs that may be responsible for some of the observed X-ray excess in the galactic bulge (Hailey et al., 2016), Source 363 might be a useful laboratory to probe this idea further. The ongoing eROSITA (Predehl et al., 2021) survey should be deep enough to detect similar objects.
-
•
It shows the usefulness of using near infrared variability to locate this kind of object, as well as the benefits of multi-wavelength astronomy to classify variable stars that are unexpected or unusual upon initial discovery.
The next steps in our investigation are to further constrain the system’s parameters, specifically the WD and companion masses, as well as the spin and orbital periods. In addition, having these parameters will allow us to test our ideas for the system’s unusual behaviour, as described in Section 4.2. In addition we aim to find additional candidates within the Vista Variables in the Via Lactea survey (VVV, Minniti et al. 2010), via collation of short period variable stars (Smith et al., 2018) with close distances and observed H excess from VPHAS+ (Drew et al., 2014). This will allow us to build an idea of the scale of this population, and thus the expected X-ray flux that would be produced. In turn, this would provide a useful metric to determine whether they are the cause of the aforementioned flux excess. Further the results thereof would indicate whether we are looking at a new subgroup of IPs or a short-lived phase in their evolution.
Acknowledgements
We acknowledge the use of public data from the Swift data archive. We also acknowledge the use of the WHT: The William Herschel Telescope and its service programme are operated on the island of La Palma by the Isaac Newton Group of Telescopes in the Spanish Observatorio del Roque de los Muchachos of the Instituto de Astrofísica de Canarias. We would also like to thank the operations teams at both facilities for the quick and efficient observations.
CM acknowledges support from the UK’s Science and Technology Facilities Council (ST/S505419/1). NM and WJC are funded by University of Hertfordshire studentships; furthermore CM, PWL, NM, WJC, ZG and JED recognise the computing infrastructure provided via STFC grant ST/R000905/1 at the University of Hertfordshire.
JS acknowledges support from the Packard Foundation and National Science Foundation grant AST-1714825. Portions of this work were performed while SJS held a NRC Research Associateship award at the Naval Research Laboratory. Work at the Naval Research Laboratory is supported by NASA DPR S-15633-Y.
ZG acknowledges the financial support from ANID (CONICYT) through the FONDECYT project No. 3220029.
Data Availability
All data is available from the first author upon request (and from PWL at p.w.lucas@herts.ac.uk), it will also be hosted at (star.herts.ac.uk/~cmorris/source_363_public/). Swift ToO data is publicly available at HEASARC.
References
- Andronov & Breus (2013) Andronov I. L., Breus V. V., 2013, Astrophysics, 56, 518
- Astropy Collaboration et al. (2013) Astropy Collaboration et al., 2013, A&A, 558, A33
- Astropy Collaboration et al. (2018) Astropy Collaboration et al., 2018, AJ, 156, 123
- Atwood et al. (2009) Atwood W. B., et al., 2009, ApJ, 697, 1071
- Bailer-Jones et al. (2021) Bailer-Jones C. A. L., Rybizki J., Fouesneau M., Demleitner M., Andrae R., 2021, The Astronomical Journal, 161, 147
- Bonnardeau (2015) Bonnardeau M., 2015, Information Bulletin on Variable Stars, 6146, 1
- Bradley et al. (2021) Bradley L., et al., 2021, astropy/photutils: 1.2.0, doi:10.5281/zenodo.5525286, https://doi.org/10.5281/zenodo.5525286
- Bruch (2021) Bruch A., 2021, MNRAS, 503, 953
- Buckley & Tuohy (1989) Buckley D. A. H., Tuohy I. R., 1989, ApJ, 344, 376
- Buckley et al. (1998) Buckley D. A. H., Cropper M., Ramsay G., Wickramasinghe D. T., 1998, MNRAS, 299, 83
- Burwitz et al. (1996) Burwitz V., Reinsch K., Beuermann K., Thomas H. C., 1996, A&A, 310, L25
- Chambers et al. (2016) Chambers K. C., et al., 2016, arXiv e-prints, p. arXiv:1612.05560
- Clemens et al. (2004) Clemens J. C., Crain J. A., Anderson R., 2004, SPIE, 5492, 331
- Contreras Peña et al. (2014) Contreras Peña C., et al., 2014, MNRAS, 439, 1829
- Drew et al. (2005) Drew J. E., et al., 2005, MNRAS, 362, 753
- Drew et al. (2014) Drew J. E., et al., 2014, MNRAS, 440, 2036
- Evans et al. (2006) Evans P. A., Hellier C., Ramsay G., 2006, MNRAS, 369, 1229
- Evans et al. (2009) Evans P. A., et al., 2009, MNRAS, 397, 1177
- Evans et al. (2014) Evans P. A., et al., 2014, ApJS, 210, 8
- Evans et al. (2020) Evans P. A., et al., 2020, ApJS, 247, 54
- Flewelling (2017) Flewelling H., 2017, in American Astronomical Society Meeting Abstracts #229. p. 237.07
- Gaia Collaboration et al. (2016) Gaia Collaboration et al., 2016, A&A, 595, A1
- Gaia Collaboration et al. (2018) Gaia Collaboration et al., 2018, A&A, 616, A1
- Gaia Collaboration et al. (2021) Gaia Collaboration et al., 2021, A&A, 649, A1
- Groot et al. (2009) Groot P. J., et al., 2009, MNRAS, 399, 323
- Hailey et al. (2016) Hailey C. J., et al., 2016, ApJ, 826, 160
- Hellier (1993) Hellier C., 1993, MNRAS, 264, 132
- Hellier (1997) Hellier C., 1997, MNRAS, 288, 817
- Hellier & Beardmore (2002) Hellier C., Beardmore A. P., 2002, MNRAS, 331, 407
- Hilton et al. (2009) Hilton E. J., Szkody P., Mukadam A., Henden A., Dillon W., Schmidt G. D., 2009, AJ, 137, 3606
- Joshi et al. (2011) Joshi V. H., Ashok N. M., Banerjee D. P. K., 2011, Bulletin of the Astronomical Society of India, 39, 259
- Kaluzny & Semeniuk (1988) Kaluzny J., Semeniuk I., 1988, Information Bulletin on Variable Stars, 3145, 1
- Kemp et al. (2002) Kemp J., Patterson J., Thorstensen J. R., Fried R. E., Skillman D. R., Billings G., 2002, PASP, 114, 623
- Kim et al. (2005) Kim Y. G., Andronov I. L., Park S. S., Jeon Y. B., 2005, A&A, 441, 663
- Knigge et al. (2011) Knigge C., Baraffe I., Patterson J., 2011, The Astrophysical Journal Supplement Series, 194, 28
- Lacy et al. (2020) Lacy M., et al., 2020, PASP, 132, 035001
- Littlefield et al. (2020) Littlefield C., Garnavich P., Kennedy M. R., Patterson J., Kemp J., Stiller R. A., Boardman J., Pellett E., 2020, The Astrophysical Journal, 896, 116
- Littlefield et al. (2021) Littlefield C., Scaringi S., Garnavich P., Szkody P., Kennedy M. R., Iłkiewicz K., Mason P. A., 2021, The Astronomical Journal, 162, 49
- Lucas et al. (2008) Lucas P. W., et al., 2008, Monthly Notices of the Royal Astronomical Society, 391, 136
- Lucas et al. (2017) Lucas P. W., et al., 2017, Monthly Notices of the Royal Astronomical Society, 472, 2990
- Masetti et al. (2012) Masetti N., Nucita A. A., Parisi P., 2012, A&A, 544, A114
- Mateo et al. (1991) Mateo M., Szkody P., Garnavich P., 1991, ApJ, 370, 370
- Minniti et al. (2010) Minniti D., et al., 2010, New Astronomy, 15, 433
- Monguió et al. (2020) Monguió M., et al., 2020, A&A, 638, A18
- Norton et al. (2002) Norton A. J., Quaintrell H., Katajainen S., Lehto H. J., Mukai K., Negueruela I., 2002, A&A, 384, 195
- Norton et al. (2004) Norton A. J., Wynn G. A., Somerscales R. V., 2004, ApJ, 614, 349
- Norton et al. (2008) Norton A. J., Butters O. W., Parker T. L., Wynn G. A., 2008, ApJ, 672, 524
- Oliveira et al. (2017) Oliveira A. S., Rodrigues C. V., Cieslinski D., Jablonski F. J., Silva K. M. G., Almeida L. A., Rodríguez-Ardila A., Palhares M. S., 2017, The Astronomical Journal, 153, 144
- Pecaut & Mamajek (2013) Pecaut M. J., Mamajek E. E., 2013, ApJS, 208, 9
- Predehl et al. (2021) Predehl P., et al., 2021, A&A, 647, A1
- Pretorius (2009) Pretorius M. L., 2009, MNRAS, 395, 386
- Pretorius & Mukai (2014) Pretorius M. L., Mukai K., 2014, MNRAS, 442, 2580
- Pretorius et al. (2013) Pretorius M. L., Knigge C., Schwope A. D., Pretorius M. L., Knigge C., Schwope A. D., 2013, MNRAS, 432, 570
- Rappaport et al. (1982) Rappaport S., Joss P. C., Webbink R. F., 1982, ApJ, 254, 616
- Rodríguez-Gil et al. (2004) Rodríguez-Gil P., Gänsicke B. T., Araujo-Betancor S., Casares J., 2004, Monthly Notices of the Royal Astronomical Society, 349, 367
- Sazonov et al. (2008) Sazonov S., Revnivtsev M., Burenin R., Churazov E., Sunyaev R., Forman W. R., Murray S. S., 2008, A&A, 487, 509
- Schreiber et al. (2021) Schreiber M. R., Belloni D., Gänsicke B. T., Parsons S. G., Zorotovic M., 2021, Nature Astronomy 2021 5:7, 5, 648
- Silber (1992) Silber A. D., 1992, PhD Thesis, MIT
- Skrutskie et al. (2006) Skrutskie M. F., et al., 2006, AJ, 131, 1163
- Smith et al. (2018) Smith L. C., et al., 2018, MNRAS, 474, 1826
- Southworth et al. (2007) Southworth J., Gänsicke B. T., Marsh T. R., de Martino D., Aungwerojwit A., 2007, MNRAS, 378, 635
- Staude et al. (2003) Staude A., Schwope A. D., Krumpe M., Hambaryan V., Schwarz R., 2003, A&A, 406, 253
- Szkody et al. (2005) Szkody P., et al., 2005, AJ, 129, 2386
- Tody (1986) Tody D., 1986, in Crawford D. L., ed., Society of Photo-Optical Instrumentation Engineers (SPIE) Conference Series Vol. 627, Instrumentation in astronomy VI. p. 733, doi:10.1117/12.968154
- Virtanen et al. (2020) Virtanen P., et al., 2020, Nature Methods, 17, 261
- Voges et al. (1999a) Voges W., et al., 1999a, A&A, 349, 389
- Voges et al. (1999b) Voges W., et al., 1999b, A&A, 349, 389
- Warner (1995) Warner B., 1995, Cataclysmic Variable Stars. Cambridge Astrophysics, Cambridge University Press, doi:10.1017/CBO9780511586491
- Webbink & Wickramasinghe (2002) Webbink R. F., Wickramasinghe D. T., 2002, MNRAS, 335, 1
- Woudt & Warner (2003) Woudt P. A., Warner B., 2003, MNRAS, 339, 731
- Woudt et al. (2012) Woudt P. A., et al., 2012, MNRAS, 427, 1004