Melting, Reentrant Ordering and Peak Effect For Wigner Crystals with Quenched and Thermal Disorder
Abstract
We consider simulations of Wigner crystals interacting with random quenched disorder in the presence of thermal fluctuations. When quenched disorder is absent, there is a well defined melting temperature determined by the proliferation of topological defects, while for zero temperature, there is a critical quenched disorder strength above which topological defects proliferate. When both thermal and quenched disorder are present, these effects compete, and the thermal fluctuations can reduce the effectiveness of the quenched disorder, leading to a reentrant ordered phase in agreement with the predictions of Nelson [Phys. Rev. B 27, 2902 (1983)]. The onset of the reentrant phase can be deduced based on changes in the transport response, where the reentrant ordering appears as an increase in the mobility or the occurrence of a depinning transition. We also find that when the system is in the ordered state and thermally melts, there is an increase in the effective damping or pinning. This produces a drop in the electron mobility that is similar to the peak effect phenomenon found in superconducting vortices, where thermal effects soften the lattice or break down its elasticity, allowing the particles to better adjust their positions to take full advantage of the quenched disorder.
There is a wide class of systems of two-dimensional (2D) particle assemblies that form triangular crystalline phases, including vortices in thin film superconductors Guillamon et al. (2009), colloidal particles Murray and Van Winkle (1987); Zahn et al. (1999); Reichhardt and Olson Reichhardt (2003), dusty plasmas Thomas et al. (1994); Chiang and I (1996), magnetic skyrmions Huang et al. (2020); Zázvorka et al. (2020), active matter Digregorio et al. (2022), and electron solids or Wigner crystals Monceau (2012); Shayegan (2022). In the absence of quenched disorder, these systems exhibit a melting transition under increasing temperature that can be characterized by the proliferation of topological defects such as dislocations and disclinations Zahn et al. (1999); Strandburg (1988); von Grünberg et al. (2004). The melting transition in 2D systems has been intensely studied and can occur as a two step transition with an intermediate hexatic phase or as a single weakly first order phase transition Strandburg (1988); Marcus and Rice (1996); Du et al. (2017). Even if a hexatic phase is present, the two steps of the transition can occur so close together that it becomes difficult to distinguish whether there are two separate phases in addition to the solid phase Zahn et al. (1999).
Crystalline systems confined to 2D can also show order to disorder transitions as a function of increasing quenched disorder strength. At there can be a critical disorder strength above which an amorphous phase appears Cha and Fertig (1995); Reichhardt and Reichhardt (2017). When there are both quenched disorder and thermal fluctuations, there can be a competition in which thermal fluctuations soften the interactions between particles but at the same time also reduce the effectiveness of the disordered substrate. Nelson Nelson (1983) proposed that for a 2D system with quenched disorder, thermal effects can wash out the quenched disorder, leading to a thermally induced reentrant ordering effect from a low temperature amorphous state to a crystal state as a function of increasing temperature. At still higher temperatures, the system thermally melts. In other studies, it was suggested that the quenched disorder always enhances the appearance of a disordered state, and that introduction of quenched disorder monotonically decreases the temperature at which the transition from a disorder-induced amorphous state to a thermally reordered state occurs Cha and Fertig (1995); Reichhardt and Reichhardt (2017); Deutschländer et al. (2013).
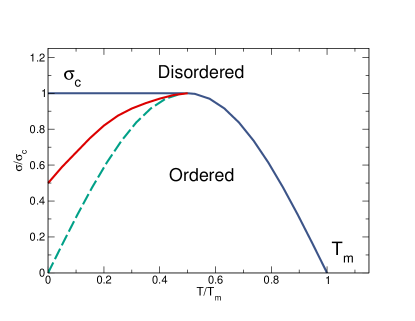
It is possible that the reentrant ordering proposed by Nelson Nelson (1983) may depend on the size scale and strength of the quenched disorder pinning sites. For systems with long range particle-particle interactions but short range particle-pin interactions, reentrant ordering is possible when the pinning sites are sufficiently small. In Fig. 1 we show a schematic phase diagram as a function of reduced disorder strength versus temperature highlighting the ordered and disordered phases. When , a melting transition occurs at . The schematic does not distinguish whether there is also a hexatic phase, but simply indicates the point at which topological defects start to proliferate. At , for increasing there is a transition from a crystal to a disordered state at . On the right hand side of the figure, the solid line indicates that the critical value at which the system disorders decreases with increasing temperature. The three lines on the left hand side of the figure indicate different possible low temperature behaviors. The dashed line is the prediction from Nelson Nelson (1983), where the system is disordered at very low but thermal effects wash out the effect of the disorder, permitting reordering to occur with increasing temperature. Cha and Fertig Cha and Fertig (1995) predicted the upper blue solid line, where the system remains ordered at low temperatures all the way up to a constant critical . The solid red line is what we observe in the present work, where disordering occurs even at when is increased, but for there is a reentrant ordering with increasing temperature, so that the predictions of both Nelson and of Cha and Fertig occur. We also find that for finite , the thermally induced melting transition at higher temperatures is depressed in temperature. We note that in their simulation work, Cha and Fertig found that at there is a critical disorder strength for the 2D crystal to disorder; however, they did not consider the effect of finite temperature to see whether there might still be a reentrant thermally reordered phase.
Anther feature of 2D systems with quenched disorder is that the transport of the system should strongly depend on whether the particle arrangement is crystalline, disordered, or fluid Reichhardt and Reichhardt (2017); Reichhardt and Olson (2002); Pertsinidis and Ling (2008); Fily et al. (2010); Di Scala et al. (2012); Reichhardt et al. (2015). If the system is in a crystal state, there can still be a depinning threshold, but the depinning will be an elastic process in which particles keep their same neighbors Reichhardt and Reichhardt (2017); Reichhardt and Olson (2002); Di Scala et al. (2012). If the system is disordered or glassy, the depinning can be plastic where a portion of particles remain immobile while the other particles move, creating local tearing in the assembly Reichhardt and Reichhardt (2017); Reichhardt and Olson (2002); Fily et al. (2010). In the fluid phase, strong thermal hopping reduces the effects of the quenched disorder. For , the depinning threshold shows a pronounced change across , where in general rapidly increases with increasing once the system is on the disordered side of the transition where the depinning is plastic Reichhardt and Reichhardt (2017); Reichhardt and Olson (2002); Di Scala et al. (2012). Additionally, both the shape of the velocity-force curves and the fluctuations in the moving state show pronounced changes across the transition from elastic to plastic depinning, going from a single step depinning process on the elastic side to a multiple step process in the plastic phase Reichhardt and Reichhardt (2017); Reichhardt and Olson (2002); Pertsinidis and Ling (2008); Fily et al. (2010); Di Scala et al. (2012). The jump up in pinning effectiveness upon crossing from elastic to plastic depinning has previously been argued to be the cause of what is called the peak effect phenomenon observed in type-II superconductors Pippard (1969); Kes and Tsuei (1983); Wördenweber et al. (1986); Bhattacharya and Higgins (1993); Kwok et al. (1994); Gammel et al. (1998); Banerjee et al. (1999); Paltiel et al. (2000); Ling et al. (2001); Troyanovski et al. (2002); Hilke et al. (2003); Pasquini et al. (2008); Okuma et al. (2008). In the superconducting vortex system, the driving forces on the vortices arise from an applied current , and the vortices depin above a critical current . The peak effect occurs when, as a function of increasing temperature, undergoes a rapid increase at a well defined temperature or magnetic field. If the vortices are already moving when the temperature is increased, there is a drop in their average velocity at the peak effect temperature. The apparent increase in the effectiveness of the pinning with increasing temperature is counterintuitive because it is more natural to expect that increasing the temperature would reduce the effectiveness of the pinning. In the peak effect regime, the thermal fluctuations are argued to reduce the elasticity of the vortex lattice (VL) or induce the formation of dislocations that strongly soften the VL, causing the VL to become amorphous and permitting individual vortices to easily adjust to the pinning landscape in order to become better pinned Pippard (1969); Bhattacharya and Higgins (1993); Kwok et al. (1994). As the temperature is increased further, the thermal fluctuations overwhelm the pinning energy and the vortices easily hop out of the pinning sites, causing a decrease in the critical current or equivalently an increase in the vortex velocity at fixed current. It is also possible to observe the peak effect as a function of increasing field, and in this case it is argued that changes in the magnetic penetration depth can reduce the strength of the vortex-vortex interactions and soften the VL. Various measures of the VL structure show that the peak effect is characterized by a transition from an ordered lattice to a disordered or amorphous state Gammel et al. (1998); Ling et al. (2001); Troyanovski et al. (2002). The peak effect occurs in both 2D and three-dimensional (3D) systems, and the 3D peak effect is associated with first order characteristics and history dependence Ling et al. (2001); Pasquini et al. (2008). The peak effect should be a general feature in any type of 2D elastic system coupled to quenched disorder where thermal effects can cause a softening of the lattice, leading to an increase in the depinning threshold or a drop in the velocity across the elastic to plastic transition.
Another system that forms a 2D crystal state that can be driven is electron solids or Wigner crystals Wigner (1934); Andrei et al. (1988); Goldman et al. (1990); Jiang et al. (1991); Williams et al. (1991); Piacente and Peeters (2005); Jang et al. (2017); Brussarski et al. (2018); Hatke et al. (2019); Hossain et al. (2022). These systems usually contain some form of quenched disorder, and a variety of studies have revealed nonlinear transport and possible depinning thresholds Goldman et al. (1990); Jiang et al. (1991); Williams et al. (1991); Piacente and Peeters (2005) associated with enhanced noise Brussarski et al. (2018). Wigner crystals can also undergo melting transitions as a function of increasing temperature Chen et al. (2006); Knighton et al. (2018); Deng et al. (2019); Ma et al. (2020); Kim et al. (2022). There is a growing number of systems where Wigner crystals could be realized, including dichalcogenide monolayers Smoleński et al. (2021), moiré heterostructures Xu et al. (2020); Li et al. (2021) bilayer systems Zhou et al. (2021), and Wigner crystals at zero field Falson et al. (2022), while new advances in materials preparation point to a variety of future experiments that could be done in which the competition between quenched disorder and thermal effects could be studied Shayegan (2022). Unlike colloidal assemblies or superconducting vortices, imaging experiments for Wigner systems are difficult, so the existence of order to disorder or melting transitions must be determined on the basis of some type of response or transport experiments. An open question is what the Wigner crystal phase diagram is as a function of quenched disorder and temperature, as illustrated schematically in Fig. 1, and whether the different phases can be deduced from transport measures. Anther question is whether Wigner crystals can also exhibit a peak effect or an increase in the effectiveness of the pinning as a function of increasing temperature similar to what is found in superconducting vortex systems across a thermally induced disordering transition.
In this work we perform simulations of a 2D localized electron system in the presence of quenched disorder and thermal disorder . At , there is a well defined melting temperature characterized by a proliferation of topological defects, while for there is a well defined critical quenched disorder strength above which topological defects proliferate. We map out the phase diagram as a function of versus and find that when , an increase in can cause the system to thermally order as predicted by Nelson Nelson (1983). Additionally, when is finite, thermal disordering occurs at temperatures lower than . For sufficiently large , the system is always disordered. We show that the ordered and disordered phases can be detected using transport signatures, where we apply a finite driving force and measure the changes in the average velocity. When , the system forms a disordered pinned state at low temperatures, but at the reentrant ordering transition, a lattice with elastic behavior emerges and the depinning threshold is strongly reduced, leading to a finite velocity of the Wigner crystal. At higher temperatures where the system thermally melts, under driving the velocity drops above the melting transition because the electrons can partially adjust their positions in order to maximize their interactions with the quenched disorder, similar to the drop in vortex mobility seen across the peak effect as a function of increasing temperature in superconducting vortex systems Pippard (1969); Kes and Tsuei (1983); Wördenweber et al. (1986); Bhattacharya and Higgins (1993); Kwok et al. (1994); Gammel et al. (1998); Banerjee et al. (1999); Paltiel et al. (2000); Ling et al. (2001); Troyanovski et al. (2002); Hilke et al. (2003); Pasquini et al. (2008). The peak effect we observe only occurs for . We show that reentrance in the phase diagram occurs both as a function of increasing disorder strength for fixed disorder density and as a function of increasing disorder density for fixed disorder strength, and that the peak effect remains robust for different values of the drive.
I Simulation and System
We consider a 2D system with periodic boundary conditions in the and directions containing localized electrons at an electron density of , where the system is of size . Throughout this work we use , , and . The system also contains localized pinning sites of density . The initial electron configuration is obtained via simulated annealing, similar to what was done in previous simulations of Wigner crystals in the presence of disorder Reichhardt et al. (2001); Reichhardt and Olson Reichhardt (2004); Reichhardt and Reichhardt (2021, ). The equation of motion for electron in the Wigner crystal is
| (1) |
The damping term is and the electron-electron repulsive interaction potential is , where is the electron charge, and are the positions of electrons and , and . Since the interactions are of long range, we employ a real space version of a modified Ewald summation technique called the Lekner method as in previous work Lekner (1991); Grønbech-Jensen (1997). The pinning force is modeled as arising from randomly placed short range parabolic traps of radius . The thermal fluctuations are represented by Langevin kicks with the properties and . We also consider the effect of an applied driving force , which could come from an applied voltage. We measure the average velocity per particle, , allowing us to construct the equivalent of an experimental current-voltage curve. The simulation method we employ for the pinning and dynamics of Wigner crystals was used previously to examine nonlinear velocity-force curves Reichhardt et al. (2001), noise Reichhardt and Olson Reichhardt (2004), and depinning thresholds Reichhardt and Reichhardt ; Cha and Fertig (1994). If the electrons are subjected to a magnetic field , there can be an additional force term that can generate a Hall angle for the electron motion Reichhardt and Reichhardt (2021); however, in general this term is small and we will not consider it in this work.
II Results
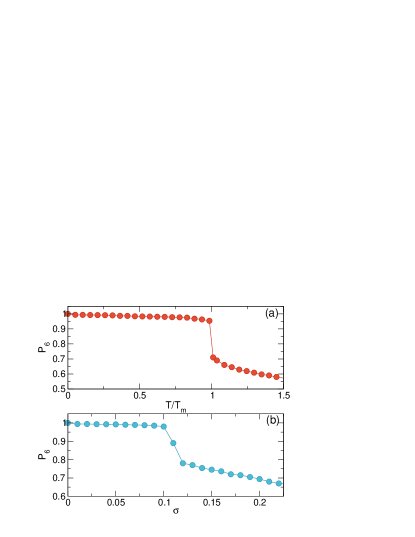
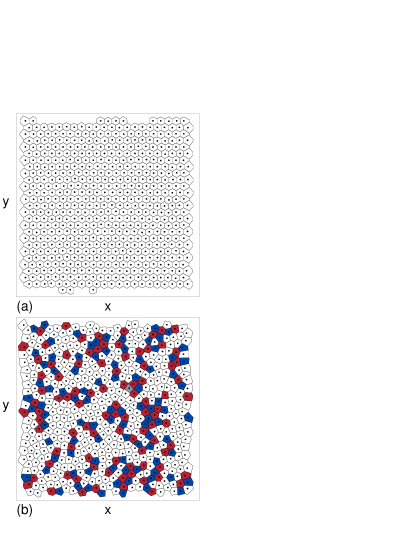
We first study a sample containing no quenched disorder. To characterize the system we use the fraction of sixfold coordinated electrons, , where the coordination number of electron is obtained using a Voronoi construction. For a triangular lattice of electrons, . In Fig. 2(a) we plot versus , where the melting temperature is defined to occur at the point where shows a rapid drop. Figure 2(a) indicates that the melting temperature is well defined. We plot the Voronoi construction for the electron positions at in Fig. 3(a), where the lattice is ordered, and at in Fig. 3(b), where numerous topological defects have appeared. In Fig. 2(b) we show versus the maximum disorder strength in a sample with a a pinning density of at zero temperature, . There is a well defined disorder strength above which a proliferation of topological defects occurs.
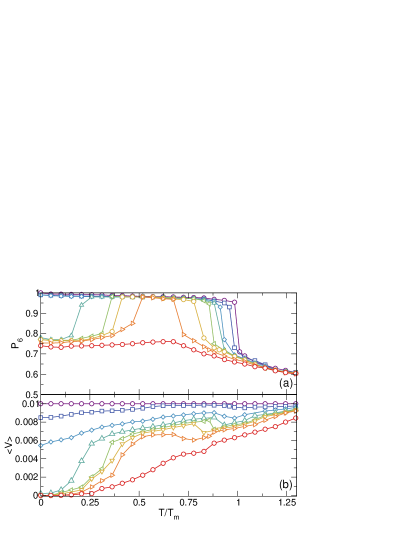
We next perform a series of simulations at different combinations of and for the system from Fig. 2 with . In Fig. 4(a) we plot versus at , 0.06, 0.1, 0.12, 0.13, 0.135, 0.14, and , where is defined to be the temperature at which melting occurs for . For , 0.06, and , the system starts off ordered at low and remains ordered until it melts near . The drop in associated with melting shifts to lower values of as increases. For , 0.13, 0.135, and , all of which are above the value of for which the system disorders at in Fig. 2(b), the system is disordered at low temperature. As increases, there is a critical temperature at which increases back to a value near , indicating that the system has ordered under increasing temperature. The temperature at which this reentrant ordering occurs shifts to higher with increasing , while the thermal disordering temperature drops to lower as becomes larger, so for there is only a narrow window, , where the system is ordered. For , the system is disordered at all temperatures.
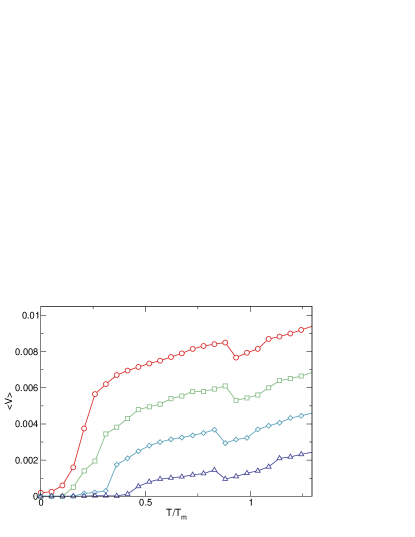
In Fig. 4(b) we plot versus for the same system in Fig. 4(a) where we have added a driving force with . Under this drive, the system has for all values of . When or , starts off at a finite value and increases with increasing ; however, for , at low temperatures where is low, . This indicates that the system is easily pinned in the low temperature disordered phase; however, when the system reaches the reentrant ordered state, it forms an elastic lattice that is less well pinned, leading to an increase in . Anther interesting effect is that at the thermal melting transition, the drop in is also correlated with a drop in , indicating that the effectiveness of the pinning increases at the thermally induced disordering transition. This behavior is very similar to the peak effect phenomenon, where at a finite drive the average superconducting vortex velocity can show a drop with increasing temperature when the system thermally disorders. In the vortex case, it has been argued that the disordered state is softer and can therefore better adapt to the pinning landscape. Figure 4(b) shows that at higher temperatures where the thermal effects start to dominate, the velocity increases with increasing . For there is only a weak dip in at the thermal disordering temperature, and at , there is no dip in the velocity since the system is always disordered.
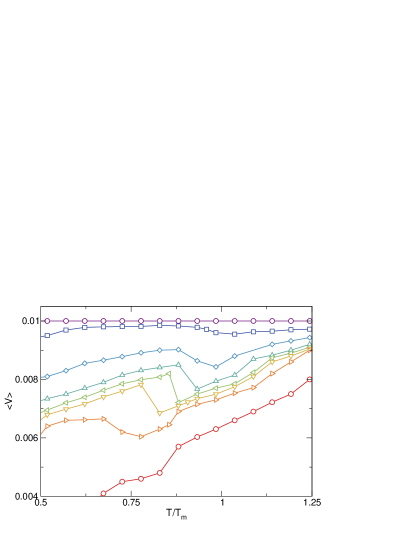
In Fig. 5 we show a blowup of the versus plot from Fig. 4(b) in order to highlight the drop in across the thermal melting transition. In general, the drop in velocity only appears at and shifts to lower values of as the pinning strength increases. This result indicates that both the reentrant ordering transition and the thermal melting can be detected using changes in the transport measures.
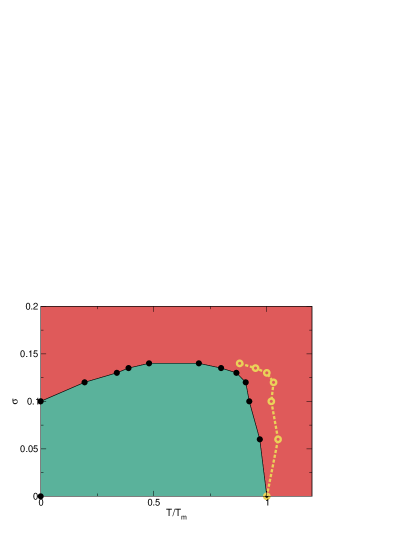
Using the features in Fig. 4, in Fig. 6 we construct a phase diagram as a function of versus showing the ordered and disordered regimes. Reentrant ordering occurs for , and the thermally induced disordering transition drops further below with increasing . The phase diagram includes the reentrant ordering feature predicted by Nelson Nelson (1983) as well as a finite value of at as proposed by Cha and Fertig Cha and Fertig (1995). For , the system is always disordered. The dashed line indicates the upper end of the region in which there is a velocity reduction associated with the peak effect. This line is determined by the point at which reaches 75% of , where is the value of just before the velocity dip begins as a function of increasing . We note that additional lines could be drawn in the disordered regime to differentiate between a low temperature glassy or pinned phase and a higher temperature fluctuating fluid phase.
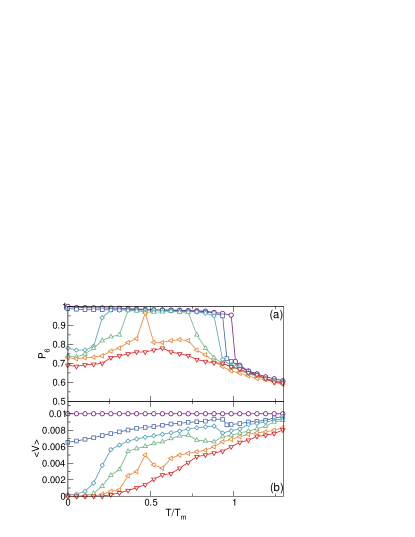
In Fig. 7(a) we plot versus for the system in Fig. 4 at a fixed for varied pinning densities of , 0.15, 0.25, 0.35, 0.45 and . For and there is no disordered phase at low ; however, for , there is a regime of reentrant ordering. For , the system is disordered for all values of . Figure 7(b) shows the corresponding versus curves. The drop in at the thermal ordering transition indicates that the same peak effect appears that was found for varied disorder strengths. For , monotonically increases with increasing .
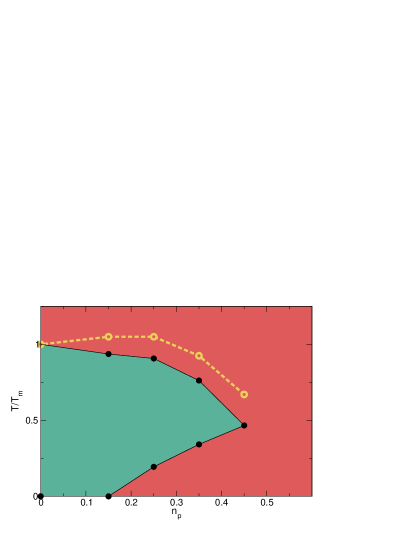
In Fig. 8 we show a phase diagram of the ordered and disordered states as a function of versus pinning density constructed using the features in Fig. 7. The same reentrant ordering phase appears that was found in Fig. 6 at constant pinning density for changing pinning strength. The dashed line indicates where the drop in velocity associated with peak effect is lost.
We have also tested how robust the peak effect phenomenon is for varied driving force . In Fig. 9 we plot versus for a system with and at , 0.0075, 0.005, and . As decreases, at low temperatures there is an extended window where the system is pinned, while at higher temperatures the peak effect region remains robust. The thermal melting transition shifts to slightly lower values of with decreasing driving force. This result suggests that if is low enough, the system could show a reentrant pinning near the thermal disordering transition.
III Summary
We have investigated the quenched disorder versus temperature phase diagram for a 2D Wigner crystal system. For zero quenched disorder, there is a well defined melting temperature that is characterized by the proliferation of topological defects. For zero temperature there is also a well defined quenched disorder strength at which the system becomes disordered. The phase diagram shows that when the disorder strength is larger than the value at which the zero temperature system becomes disordered, as the temperature is increased the system can show a thermally induced or reentrant ordering transition when the thermal fluctuations become strong enough to overwhelm the effect of the quenched disorder without melting the lattice. At higher temperatures, introduction of quenched disorder reduces the thermal disordering temperature of the system, while for strong enough quenched disorder the system is always disordered. The phase diagrams we obtain show both the reentrant ordering feature predicted by Nelson for 2D systems with quenched and thermal disorder as well as a well defined quenched disorder strength where the electrons disorder at zero temperature, as predicted by Cha and Fertig. We also show that these phases can be observed through features in the transport curves, where the effectiveness of the pinning strongly drops at the reentrant ordering transition as the system goes from plastic behavior to elastic behavior. In the presence of quenched disorder, the thermal disordering transition is associated with a drop in the average electron velocity, similar to the peak effect phenomenon found in superconducting vortex systems. The drop occurs when thermal fluctuations break down the elasticity of the crystal and allow the electrons to adjust more easily to the pinning substrate. At higher temperatures, the velocity goes back up again when the electrons begin to hop readily out of the pinning barriers. We show that these effects are robust for a range of pinning strengths, densities, and drives. Our predictions could be tested by examining transport signatures in Wigner crystals where both thermal and quenched disorder effects arise. Our results should be general to the broader class of 2D systems with quenched disorder.
Acknowledgements.
We gratefully acknowledge the support of the U.S. Department of Energy through the LANL/LDRD program for this work. This work was supported by the US Department of Energy through the Los Alamos National Laboratory. Los Alamos National Laboratory is operated by Triad National Security, LLC, for the National Nuclear Security Administration of the U. S. Department of Energy (Contract No. 892333218NCA000001).References
- Guillamon et al. (2009) I. Guillamon, H. Suderow, A. Fernandez-Pacheco, J. Sese, R. Cordoba, J. M. De Teresa, M. R. Ibarra, and S. Vieira, “Direct observation of melting in a two-dimensional superconducting vortex lattice,” Nature Phys. 5, 651–655 (2009).
- Murray and Van Winkle (1987) C. A. Murray and D. H. Van Winkle, “Experimental observation of two-stage melting in a classical two-dimensional screened Coulomb system,” Phys. Rev. Lett. 58, 1200–1203 (1987).
- Zahn et al. (1999) K. Zahn, R. Lenke, and G. Maret, “Two-stage melting of paramagnetic colloidal crystals in two dimensions,” Phys. Rev. Lett. 82, 2721–2724 (1999).
- Reichhardt and Olson Reichhardt (2003) C. Reichhardt and C. J. Olson Reichhardt, “Fluctuating topological defects in 2D liquids: Heterogeneous motion and noise,” Phys. Rev. Lett. 90, 095504 (2003).
- Thomas et al. (1994) H. Thomas, G. E. Morfill, V. Demmel, J. Goree, B. Feuerbacher, and D. Möhlmann, “Plasma crystal: Coulomb crystallization in a dusty plasma,” Phys. Rev. Lett. 73, 652–655 (1994).
- Chiang and I (1996) C.-H. Chiang and L. I, “Cooperative particle motions and dynamical behaviors of free dislocations in strongly coupled quasi-2D dusty plasmas,” Phys. Rev. Lett. 77, 647–650 (1996).
- Huang et al. (2020) P. Huang, T. Schonenberger, M. Cantoni, L. Heinen, A. Magrez, A. Rosch, F. Carbone, and H. M. Rønnow, “Melting of a skyrmion lattice to a skyrmion liquid via a hexatic phase,” Nature Nanotechnol. 15, 761 (2020).
- Zázvorka et al. (2020) J. Zázvorka, F. Dittrich, Y. Ge, N. Kerber, K. Raab, T. Winkler, K. Litzius, M. Veis, P. Virnau, and M. Kläui, “Skyrmion lattice phases in thin film multilayer,” Adv. Funct. Mater. 30, 2004037 (2020).
- Digregorio et al. (2022) P. Digregorio, D. Levis, L. F. Cugliandolo, G. Gonnella, and I. Pagonabarraga, “Unified analysis of topological defects in 2D systems of active and passive disks,” Soft Matter 18, 566–591 (2022).
- Monceau (2012) P. Monceau, “Electronic crystals: an experimental overview,” Adv. Phys. 61, 325–581 (2012).
- Shayegan (2022) M. Shayegan, “Wigner crystals in flat band 2D electron systems,” Nature Rev. Phys. 4, 212–213 (2022).
- Strandburg (1988) K. J. Strandburg, “Two-dimensional melting,” Rev. Mod. Phys. 60, 161–207 (1988).
- von Grünberg et al. (2004) H. H. von Grünberg, P. Keim, K. Zahn, and G. Maret, “Elastic behavior of a two-dimensional crystal near melting,” Phys. Rev. Lett. 93, 255703 (2004).
- Marcus and Rice (1996) A. H. Marcus and S. A. Rice, “Observations of first-order liquid-to-hexatic and hexatic-to-solid phase transitions in a confined colloid suspension,” Phys. Rev. Lett. 77, 2577–2580 (1996).
- Du et al. (2017) D. Du, M. Doxastakis, E. Hilou, and S. L. Biswal, “Two-dimensional melting of colloids with long-range attractive interactions,” Soft Matter 13, 1548–1553 (2017).
- Cha and Fertig (1995) M.-C. Cha and H. A. Fertig, “Disorder-induced phase transitions in two-dimensional crystals,” Phys. Rev. Lett. 74, 4867–4870 (1995).
- Reichhardt and Reichhardt (2017) C. Reichhardt and C. J. Olson Reichhardt, “Depinning and nonequilibrium dynamic phases of particle assemblies driven over random and ordered substrates: a review,” Rep. Prog. Phys. 80, 026501 (2017).
- Nelson (1983) D. R. Nelson, “Reentrant melting in solid films with quenched random impurities,” Phys. Rev. B 27, 2902–2914 (1983).
- Deutschländer et al. (2013) S. Deutschländer, T. Horn, H. Löwen, G. Maret, and P. Keim, “Two-dimensional melting under quenched disorder,” Phys. Rev. Lett. 111, 098301 (2013).
- Reichhardt and Olson (2002) C. Reichhardt and C. J. Olson, “Colloidal dynamics on disordered substrates,” Phys. Rev. Lett. 89, 078301 (2002).
- Pertsinidis and Ling (2008) A. Pertsinidis and X. S. Ling, “Statics and dynamics of 2D colloidal crystals in a random pinning potential,” Phys. Rev. Lett. 100, 028303 (2008).
- Fily et al. (2010) Y. Fily, E. Olive, N. Di Scala, and J. C. Soret, “Critical behavior of plastic depinning of vortex lattices in two dimensions: Molecular dynamics simulations,” Phys. Rev. B 82, 134519 (2010).
- Di Scala et al. (2012) N. Di Scala, E. Olive, Y. Lansac, Y. Fily, and J. C. Soret, “The elastic depinning transition of vortex lattices in two dimensions,” New J. Phys. 14, 123027 (2012).
- Reichhardt et al. (2015) C. Reichhardt, D. Ray, and C. J. Olson Reichhardt, “Collective transport properties of driven skyrmions with random disorder,” Phys. Rev. Lett. 114, 217202 (2015).
- Pippard (1969) A. B. Pippard, “A possible mechanism for peak effect in type 2 superconductors,” Phil. Mag. 19, 217 (1969).
- Kes and Tsuei (1983) P. H. Kes and C. C. Tsuei, “Two-dimensional collective flux pinning, defects, and structural relaxation in amorphous superconducting films,” Phys. Rev. B 28, 5126–5139 (1983).
- Wördenweber et al. (1986) R. Wördenweber, P. H. Kes, and C. C. Tsuei, “Peak and history effects in two-dimensional collective flux pinning,” Phys. Rev. B 33, 3172–3180 (1986).
- Bhattacharya and Higgins (1993) S. Bhattacharya and M. J. Higgins, “Dynamics of a disordered flux line lattice,” Phys. Rev. Lett. 70, 2617–2620 (1993).
- Kwok et al. (1994) W. K. Kwok, J. A. Fendrich, C. J. van der Beek, and G. W. Crabtree, “Peak effect as a precursor to vortex lattice melting in single crystal YBa2Cu3O7-δ,” Phys. Rev. Lett. 73, 2614–2617 (1994).
- Gammel et al. (1998) P. L. Gammel, U. Yaron, A. P. Ramirez, D. J. Bishop, A. M. Chang, R. Ruel, L. N. Pfeiffer, E. Bucher, G. D’Anna, D. A. Huse, K. Mortensen, M. R. Eskildsen, and P. H. Kes, “Structure and correlations of the flux line lattice in crystalline Nb through the peak effect,” Phys. Rev. Lett. 80, 833–836 (1998).
- Banerjee et al. (1999) S. S. Banerjee, N. G. Patil, S. Ramakrishnan, A. K. Grover, S. Bhattacharya, P. K. Mishra, G. Ravikumar, T. V. Chandrasekhar Rao, V. C. Sahni, M. J. Higgins, C. V. Tomy, G. Balakrishnan, and D. Mck. Paul, “Disorder, metastability, and history dependence in transformations of a vortex lattice,” Phys. Rev. B 59, 6043–6046 (1999).
- Paltiel et al. (2000) Y. Paltiel, E. Zeldov, Y. N. Myasoedov, H. Shtrikman, S. Bhattacharya, M. J. Higgins, Z. L. Xiao, E. Y. Andrei, P. L. Gammel, and D. J. Bishop, “Dynamic instabilities and memory effects in vortex matter,” Nature (London) 403, 398–401 (2000).
- Ling et al. (2001) X. S. Ling, S. R. Park, B. A. McClain, S. M. Choi, D. C. Dender, and J. W. Lynn, “Superheating and supercooling of vortex matter in a Nb single crystal: Direct evidence for a phase transition at the peak effect from neutron diffraction,” Phys. Rev. Lett. 86, 712–715 (2001).
- Troyanovski et al. (2002) A. M. Troyanovski, M. van Hecke, N. Saha, J. Aarts, and P. H. Kes, “STM imaging of flux line arrangements in the peak effect regime,” Phys. Rev. Lett. 89, 147006 (2002).
- Hilke et al. (2003) M. Hilke, S. Reid, R. Gagnon, and Z. Altounian, “Peak effect and the phase diagram of moving vortices in FexNi1-xZr2 superconducting glasses,” Phys. Rev. Lett. 91, 127004 (2003).
- Pasquini et al. (2008) G. Pasquini, D. Pérez Daroca, C. Chiliotte, G. S. Lozano, and V. Bekeris, “Ordered, disordered, and coexistent stable vortex lattices in NbSe2 single crystals,” Phys. Rev. Lett. 100, 247003 (2008).
- Okuma et al. (2008) S. Okuma, K. Kashiro, Y. Suzuki, and N. Kokubo, “Order-disorder transition of vortex matter in a-MoxGe1-x films probed by noise,” Phys. Rev. B 77, 212505 (2008).
- Wigner (1934) E. Wigner, “On the interaction of electrons in metals,” Phys. Rev. 46, 1002–1011 (1934).
- Andrei et al. (1988) E. Y. Andrei, G. Deville, D. C. Glattli, F. I. B. Williams, E. Paris, and B. Etienne, “Observation of a magnetically induced Wigner solid,” Phys. Rev. Lett. 60, 2765–2768 (1988).
- Goldman et al. (1990) V. J. Goldman, M Santos, M Shayegan, and J. E. Cunningham, “Evidence for two-dimentional quantum Wigner crystal,” Phys. Rev. Lett. 65, 2189–2192 (1990).
- Jiang et al. (1991) H. W. Jiang, H. L. Stormer, D. C. Tsui, L. N. Pfeiffer, and K. W. West, “Magnetotransport studies of the insulating phase around =1/5 Landau-level filling,” Phys. Rev. B 44, 8107–8114 (1991).
- Williams et al. (1991) F. I. B. Williams, P. A. Wright, R. G. Clark, E. Y. Andrei, G. Deville, D. C. Glattli, O. Probst, B. Etienne, C. Dorin, C. T. Foxon, and J. J. Harris, “Conduction threshold and pinning frequency of magnetically induced Wigner solid,” Phys. Rev. Lett. 66, 3285–3288 (1991).
- Piacente and Peeters (2005) G. Piacente and F. M. Peeters, “Pinning and depinning of a classic quasi-one-dimensional Wigner crystal in the presence of a constriction,” Phys. Rev. B 72, 205208 (2005).
- Jang et al. (2017) J. Jang, B. M. Hunt, L. N. Pfeiffer, K. W. West, and R. C. Ashoori, “Sharp tunneling resonance from the vibrations of an electronic Wigner crystal,” Nature Phys. 13, 340 – 344 (2017).
- Brussarski et al. (2018) P. Brussarski, S. Li, S. V. Kravchenko, A. A. Shashkin, and M. P. Sarachik, “Transport evidence for a sliding two-dimensional quantum electron solid,” Nature Commun. 9, 3803 (2018).
- Hatke et al. (2019) A. T. Hatke, H. Deng, Y. Liu, L. W. Engel, L. N. Pfeiffer, K. W. West, K. W. Baldwin, and M. Shayegan, “Wigner solid pinning modes tuned by fractional quantum Hall states of a nearby layer,” Sci. Adv. 5, eaao2848 (2019).
- Hossain et al. (2022) Md. S. Hossain, M. K. Ma, K. A. Villegas-Rosales, Y. J. Chung, L. N. Pfeiffer, K. W. West, K. W. Baldwin, and M. Shayegan, “Anisotropic two-dimensional disordered Wigner solid,” Phys. Rev. Lett. 129, 036601 (2022).
- Chen et al. (2006) Y. P. Chen, G. Sambandamurthy, Z. H. Wang, R. M. Lewis, L. W. Engel, D. C. Tsui, P. D. Ye, L. N. Pfeiffer, and K. W. West, “Melting of a 2D quantum electron solid in high magnetic field,” Nat. Phys. 2, 452–455 (2006).
- Knighton et al. (2018) T. Knighton, Z. Wu, J. Huang, A. Serafin, J. S. Xia, L. N. Pfeiffer, and K. W. West, “Evidence of two-stage melting of Wigner solids,” Phys. Rev. B 97, 085135 (2018).
- Deng et al. (2019) H. Deng, L. N. Pfeiffer, K. W. West, K. W. Baldwin, L. W. Engel, and M. Shayegan, “Probing the melting of a two-dimensional quantum Wigner crystal via its screening efficiency,” Phys. Rev. Lett. 122, 116601 (2019).
- Ma et al. (2020) M. K. Ma, K. A. Villegas Rosales, H. Deng, Y. J. Chung, L. N. Pfeiffer, K. W. West, K. W. Baldwin, R. Winkler, and M. Shayegan, “Thermal and quantum melting phase diagrams for a magnetic-field-induced Wigner solid,” Phys. Rev. Lett. 125, 036601 (2020).
- Kim et al. (2022) S. Kim, J. Bang, C. Lim, S. Y. Lee, J. Hyun, G. Lee, Y. Lee, J. D. Denlinger, S. Huh, C. Kim, S. Y. Song, J. Seo, D. Thapa, S.-G. Kim, Y. H. Lee, Y. Kim, and S. W. Kim, “Quantum electron liquid and its possible phase transition,” Nature Mater. 21, 1269–1274 (2022).
- Smoleński et al. (2021) T. Smoleński, P. E. Dolgirev, C. Kuhlenkamp, A. Popert, Y. Shimazaki, P. Back, X. Lu, M. Kroner, K. Watanabe, T. Taniguchi, I. Esterlis, E. Demler, and A. Imamoglu, “Signatures of Wigner crystal of electrons in a monolayer semiconductor,” Nature (London) 595, 53–57 (2021).
- Xu et al. (2020) Y. Xu, S. Liu, D. A. Rhodes, K. Watanabe, T. Taniguchi, J. Hone, V. Elser, K. F. Mak, and J. Shan, “Correlated insulating states at fractional fillings of moirè superlattices,” Nature (London) 587, 214–218 (2020).
- Li et al. (2021) H. Li, S. Li, E. C. Regan, D. Wang, W. Zhao, S. Kahn, K. Yumigeta, M. Blei, T. Taniguchi, K. Watanabe, S. Tongay, A. Zettl, M. F. Crommie, and F. Wang, “Imaging two-dimensional generalized Wigner crystals,” Nature (London) 597, 650–654 (2021).
- Zhou et al. (2021) Y. Zhou, J. Sung, E. Brutschea, I. Esterlis, Y. Wang, G. Scuri, R. J. Gelly, H. Heo, T. Taniguchi, K. Watanabe, G. Zaránd, M. D. Lukin, P. Kim, E. Demler, and H. Park, “Bilayer Wigner crystals in a transition metal dichalcogenide heterostructure,” Nature (London) 595, 48–52 (2021).
- Falson et al. (2022) J. Falson, I. Sodemann, B. Skinner, D. Tabrea, Y. Kozuka, A. Tsukazaki, M. Kawasaki, K. von Klitzing, and J. H. Smet, “Competing correlated states around the zero-field Wigner crystallization transition of electrons in two dimensions,” Nature Mater. 21, 311–316 (2022).
- Reichhardt et al. (2001) C. Reichhardt, C. J. Olson, N. Grønbech-Jensen, and F. Nori, “Moving Wigner glasses and smectics: Dynamics of disordered Wigner crystals,” Phys. Rev. Lett. 86, 4354–4357 (2001).
- Reichhardt and Olson Reichhardt (2004) C. Reichhardt and C. J. Olson Reichhardt, “Noise at the crossover from Wigner liquid to Wigner glass,” Phys. Rev. Lett. 93, 176405 (2004).
- Reichhardt and Reichhardt (2021) C. Reichhardt and C. J. O. Reichhardt, “Drive dependence of the Hall angle for a sliding Wigner crystal in a magnetic field,” Phys. Rev. B 103, 125107 (2021).
- (61) C. Reichhardt and C. J. O. Reichhardt, “Nonlinear dynamics, avalanches and noise for driven Wigner crystals,” arXiv:2208.02929 .
- Lekner (1991) J. Lekner, “Summation of Coulomb fields in computer-simulated disordered-systems,” Physica A 176, 485–498 (1991).
- Grønbech-Jensen (1997) N. Grønbech-Jensen, “Lekner summation of long range interactions in periodic systems,” Int. J. Mod. Phys. C 8, 1287–1297 (1997).
- Cha and Fertig (1994) M.-C. Cha and H. A. Fertig, “Topological defects, orientational order, and depinning of the electron solid in a random potential,” Phys. Rev. B 50, 14368–14380 (1994).