The Next Generation Virgo Cluster Survey (NGVS). XXXV. First Kinematical Clues of Overly-Massive Dark Matter Halos in Several Ultra-Diffuse Galaxies in the Virgo Cluster
Abstract
We present Keck/DEIMOS spectroscopy of the first complete sample of ultra-diffuse galaxies (UDGs) in the Virgo cluster. We select all UDGs in Virgo that contain at least 10 globular cluster (GC) candidates and are more than outliers in scaling relations of size, surface brightness, and luminosity (a total of 10 UDGs). We use the radial velocity of their GC satellites to measure the velocity dispersion of each UDG. We find a mixed bag of galaxies: from one UDG that shows no signs of dark matter, to UDGs that follow the luminosity-dispersion relation of early-type galaxies, to the most extreme examples of heavily dark matter dominated galaxies that break well-known scaling relations such as the luminosity-dispersion or the U-shaped total mass-to-light ratio relations. This is indicative of a number of mechanisms at play forming these peculiar galaxies. Some of them may be the most extended version of dwarf galaxies, while others are so extreme that they seem to populate dark matter halos consistent with that of the Milky-Way or even larger. Even though Milky-Way stars and other GC interlopers contaminating our sample of GCs cannot be fully ruled-out, our assessment of this potential problem and simulations indicate that the probability is low and, if present, unlikely to be enough to explain the extreme dispersions measured. Further confirmation from stellar kinematics studies in these UDGs would be desirable. The lack of such extreme objects in any of the state-of-the-art simulations, opens an exciting avenue of new physics shaping these galaxies.
1 Introduction
The efficiency with which galaxies transform gas into stars is a strong non-linear function of their halo mass (e.g. Guo et al., 2010; Moster et al., 2013; Behroozi et al., 2013). Initially, halos of all masses are expected to contain a baryonic budget consistent with that of the cosmological baryon fraction (Planck Collaboration et al., 2020), meaning that about of their mass is in the form of gas or stars. However, subsequent internal and external processes associated to galaxy evolution ultimately leads to halos turning a much smaller fraction of those available baryons into stars, bringing the predicted galaxy mass and luminosity function within CDM in agreement with observations (White & Rees, 1978; Somerville & Davé, 2015; Vogelsberger et al., 2020).
Halo masses comparable to the one expected for the Milky Way, , are believed to be the most efficient of all, condensing about of the available baryon budget into stellar mass at their centers. For dwarf halos that fraction is much smaller, -, being dominated mostly by stellar feedback in the regime of dwarfs and “classical” dwarf spheroidals and by reionization for the lowest luminosity of all, or ultrafaint dwarfs (; Bullock & Boylan-Kolchin, 2017). Interestingly, while there are some variations associated to galaxy morphology and environment, the effects are small, with halo mass being still the dominant factor in determining the overall efficiency to transform gas into stars in galaxies (e.g., Correa & Schaye, 2020; Martizzi et al., 2020; Engler et al., 2021).
From this perspective, ultra-diffuse galaxies (UDGs) are powerful probes offering a unique perspective. UDGs are extremely low surface brightness galaxies that have luminosities and stellar masses consistent with those of dwarf galaxies but sizes more typical of massive galaxies (e.g.; Binggeli et al., 1985; van Dokkum et al., 2015). Possible formation mechanisms for UDGs place them either in dwarf-mass halos, in which case their baryonic efficiency will be in agreement with what is known for dwarf galaxies (e.g., Amorisco & Loeb, 2016; Di Cintio et al., 2017; Carleton et al., 2019; Tremmel et al., 2020; Wright et al., 2021), or, alternatively, propose that they are “failed galaxies”, meaning that they inhabit more massive halos that were destined to form a brighter galaxy, perhaps comparable to the Milky Way, but their star formation process was truncated at an earlier epoch freezing their stellar content to that of a dwarf (e.g., van Dokkum et al., 2015, 2016; Janssens et al., 2022). The extreme cases of the “dark-matter free” UDGs, so far only two of these have been discovered: NGC1052-DF2 and NGC1054-DF4, are better explained by a high-velocity collision of gas-rich galaxies (van Dokkum et al., 2022).
While originally received with enthusiasm, in part propelled by the discovery of several UDGs with a high number of seemingly associated GCs (van Dokkum et al., 2015; Peng & Lim, 2016), the hypothesis of massive failed galaxies has lost considerable momentum given more abundant and recent data partially supporting a dwarf-origin for UDGs. This includes diagnostics such as the GC population in field and cluster UDGs being similar to other dwarfs (Beasley et al., 2016; Amorisco et al., 2018; Lim et al., 2018; Somalwar et al., 2020; Müller et al., 2021; Jones et al., 2021; Saifollahi et al., 2022; Jones et al., 2022), considerations of passive evolution effects on the central surface brightness of dwarfs in the outskirts of groups (Román & Trujillo, 2017a) and their radial distribution (Román & Trujillo, 2017b) or the total extent of the light in UDGs (Chamba et al., 2020). Even the revised velocity dispersion and GC number estimates for the iconic DF44 UDG – one of the best candidates to be a “failed MW galaxy” – were found to be smaller than initially estimated and consistent with those of dwarf halos (van Dokkum et al., 2019; Saifollahi et al., 2021).
Such results favoring dwarf-mass halos for UDGs are a confirmation that these galaxies have normal efficiencies at turning baryons into stars, they just do it in a very extended configuration. Several theoretical models have indeed been proposed to explain the large radii of UDGs in dwarf-mass halos, which include internal mechanisms such as halos with large spins (Amorisco & Loeb, 2016; Rong et al., 2017; Benavides et al., 2022) or low concentrations (Kong et al., 2022) or dwarfs expanded as the result of repetitive and disruptive feedback events (Di Cintio et al., 2017; Chan et al., 2018) or early mergers (Wright et al., 2021); as well as external, environmentally-driven processes, such as tidal heating and stripping (Carleton et al., 2019; Safarzadeh & Scannapieco, 2017), quenching and dimming (Tremmel et al., 2020); or a combination of internal and external mechanisms (Jiang et al., 2019; Sales et al., 2020). From the numerical simulations standpoint, it seems like the existence of a population of UDGs living in dwarf-mass halos is not challenging, and instead a natural prediction of CDM.
However, observational clues seem to point to the case that at least some UDGs may still require an overly-massive dark matter halo to fully explain their origin. This includes some UDGs with - times more GCs than dwarfs of similar luminosities (Lim et al., 2018, 2020; Danieli et al., 2022a), even though not quite reaching the levels of a Milky Way-like object. Other cases, such as DGSAT-1, NGC1052-DF2 or NGC 5846-UDG1 show odd distributions of their GC luminosities or colors, or both (Fensch et al., 2019; Shen et al., 2021; Danieli et al., 2022a; Janssens et al., 2022; van Dokkum et al., 2022), hinting also to the need for more exotic origins in these galaxies. The trail of UDGs that might have larger halos than expected is one worth pursuing, as their unusual properties could reveal new physics or mechanisms impacting heavily the efficiency with which halos form stars, a pillar of galaxy formation theories. To date, no cosmological numerical simulation has reported the formation of a “failed galaxy” UDG living in a massive dark matter halo.
Arguably, the most direct way to measure dark matter mass in gas-poor galaxies is by means of kinematical studies of their stars or GCs. UDGs with available velocity dispersion estimates are scarce due to their intrinsic low surface brightness (which limits the availability of velocity dispersion for field stars) and finite number of GCs (which negatively impact the accuracy of velocity dispersion estimates). To date, when velocity dispersion has been available, it has supported low dark matter contents consistent with dwarf-mass halos for UDGs (van Dokkum et al., 2017, 2019; Danieli et al., 2019; Chilingarian et al., 2019; Collins et al., 2020; Gannon et al., 2021) with perhaps a handful of exceptions, such as DGSAT-1, a relatively isolated UDG (Martínez-Delgado et al., 2016; Janssens et al., 2022) or VLSB-B in the Virgo cluster (Toloba et al., 2018). The need for more observed systems with available kinematical data is indisputable.
In this paper we present the first systematic study of velocity dispersion in a complete sample of UDGs all located in the Virgo cluster using kinematics of GCs from Keck/DEIMOS. Our sample builds upon previous efforts in two main ways. First, we identify UDGs in an objective and unbiased way as those objects that deviate by more than from the scaling relations followed by the overall galaxy population. Second, our sample is complete in the sense that all known UDGs in the Virgo cluster having a sufficiently large number of GCs have been targeted by our study. In particular, we chose , following results from cosmological numerical simulations of dwarf galaxies in cluster environments that suggest that GCs and above provide reliable dynamical mass estimates (Doppel et al., 2021). In total, our sample includes UDGs (of which were partially presented in Toloba et al., 2018), which more than doubles the existing UDGs with existing kinematics in the literature which would follow our strict selection criteria.
This paper is organized as follows: We describe our sample selection, data collection, and reduction in Section 2. The methods and procedures followed to obtain our direct measurements and our inferred physical quantities are detailed in Section 3. Main results and comparison with previous measurements of UDGs and normal galaxies in the literature are presented in Section 4. In Section 5 we put into a larger context all of our findings, and explore the different possibilities for the formation of UDGs based on our data. We summarize our main findings and conclusions in Section 6.
Throughout this paper, we assume a distance to the Virgo cluster of 16.5 Mpc (Mei et al., 2007; Blakeslee et al., 2009), which corresponds to a distance modulus of 31.09 mag. Virial quantities are defined at the radius within which the average density of a halo is times the critical density of the Universe.
2 Observations and Data
2.1 Sample Selection
The galaxies analyzed in this work are selected from the complete sample of UDGs identified in the Virgo cluster of galaxies based on the Next Generation Virgo Cluster Survey (NGVS; Ferrarese et al., 2012; Lim et al., 2020). The structural parameters of these UDGs are measured using the extremely sharp (median seeing of in the band) and deep photometry ( mag for point-sources and mag arcsec-2) of the NGVS. The NGVS is a survey done in the bands with the MegaCam instrument on the Canada-France-Hawaii Telescope (CFHT), and covers from the core to the virial radius of the Virgo cluster, for a total area of 104 deg2.
Based on the full NGVS galaxy catalogue (Ferrarese et al., in prep.), Lim et al. (2020) identified a total of 44 and 26 UDGs using expansive and restrictive selection criteria, respectively. These UDGs are outliers in scaling relations that utilize the NGVS photometry. The three scaling relations used to define these samples of UDGs correlate luminosity with one of the following three parameters: effective radius (, radius that contains half the total luminosity of the galaxy), surface brightness at , and mean surface brightness within . Outliers are defined as objects that are located beyond the confidence level from the mean of the scaling relation. Lim et al. (2020) find that 26 objects are outliers in all three scaling relations (the most restrictive sample or primary sample), while 18 more objects are outliers in at least one of the scaling relations (the expansive criteria or secondary sample).
The goal of this work is to estimate the dark matter content in UDGs, and for that we need to measure the velocity dispersion of the galaxies. The extremely low surface brightness of these galaxies (median mag arcsec-2 in the band) makes obtaining stellar dispersions prohibitively expensive in terms of telescope time. However, GCs are compact, gravitationally-bound collections of about a million stars each that are much brighter and significantly faster to target spectroscopically. Lim et al. (2020) characterizes the GC populations of UDGs by identifying point sources in the NGVS band (the band with the best seeing, median FWHM) based on the “concentration index”, , defined as the difference between four and eight-pixel diameter aperture-corrected -band magnitudes. Each point source identified in this way is then assigned a likelihood of being a foreground star, a GC in the Virgo cluster, or a background galaxy based on its location in color space (details in Muñoz et al., 2014; Lim et al., 2017, 2020).
In Toloba et al. (2018), we use simulations based on our Keck/DEIMOS data to assess the statistical significance and biases in recovering the host velocity dispersion when the sample of dynamical tracers (GCs in our case) is small. Our simulations test a range of host from 10 to 100 km s-1, use a minimum of four velocities drawn randomly from the dispersion distribution, and assume the velocity uncertainties are the same as in our data. In these simulations we recover the input velocity dispersion with small biases of km s-1 for samples of GCs. These data-based simulations agree with recent results from hydrodynamical cosmological simulations (Doppel et al., 2021).
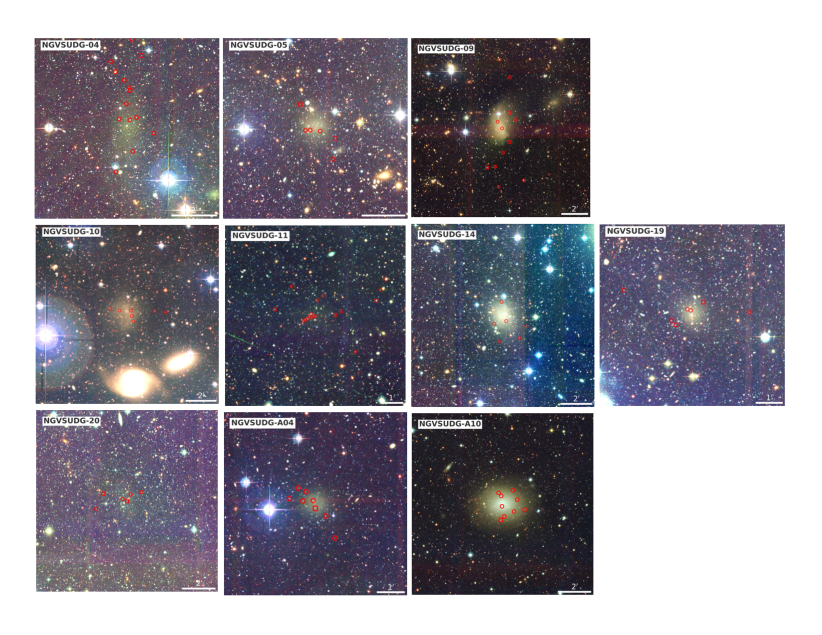
We select all UDGs from the full sample by Lim et al. (2020) that contain more than 10 GCs. This selection is done using the total number of GCs after correcting for background contamination, areal coverage, and limiting magnitude (see Lim et al., 2020, and Column (11), NGC,corr, in Table 1). The number of Virgo UDGs selected using this criterion is 12. However, we exclude NGVSUDG-A09 (VCC1249) from our sample due to a large contamination in its number of GCs from a nearby massive galaxy, and NGVSUDG-26 (VCC2045) because in our Keck/DEIMOS data we only found two GCs associated to this galaxy. The analysis of the velocity dispersion for NGVSUDG-26 is highly unreliable with such a small sample of GCs.
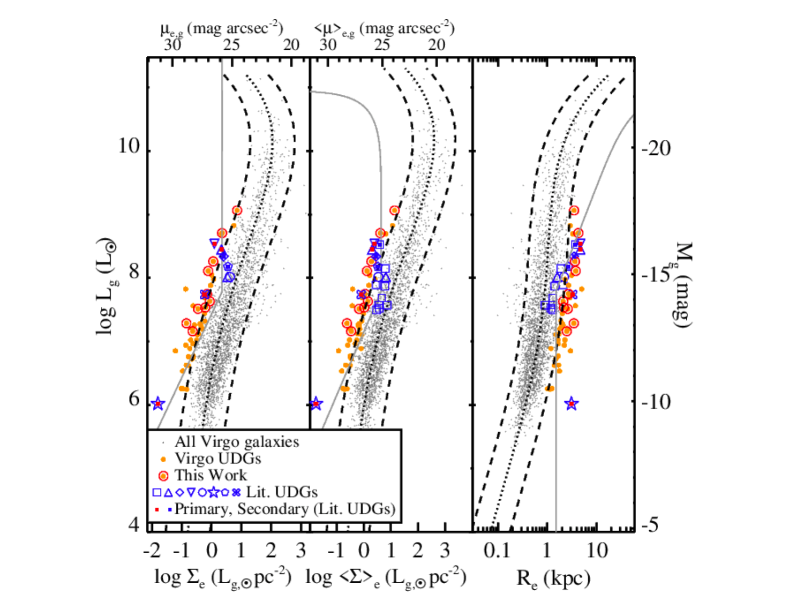
Our final sample of 10 Virgo UDGs (images shown in Figure 1 and their location in the scaling relations in Figure 2) is the first homogeneous and complete UDG sample where velocity dispersions are obtained from the analysis of GCs. There are no other UDGs in the Virgo cluster for which their dispersion can be estimated using GCs. By necessity, the sample is biased towards those UDGs with relatively large numbers of GCs, which can potentially be a signature of some extreme conditions further discussed throughout the paper. Our sample of UDGs mostly contains UDGs from the primary sample defined in Lim et al. (2020): eight of them are from the primary sample while only two are from the secondary sample (identified with an A in front of the number in their NGVSUDG name, see Table 1).
| Galaxy | Other name | RA | Dec | |||||||
| deg | deg | mag | mag | magarcsec2 | magarcsec2 | arcsec | arcsec | |||
| (1) | (2) | (3) | (4) | (5) | (6) | (7) | (8) | (9) | (10) | (11) |
| NGVSUDG-04 | VLSB-D | 186.17525 | 13.5168333 | -13.7 | 17.60 | 27.85 | 27.15 | 32.65 | 101.3 | |
| NGVSUDG-05 | VCC811 | 186.4067073 | 10.2496165 | -14.3 | 16.96 | 27.10 | 26.60 | 33.96 | 21.0 | |
| NGVSUDG-09 | VCC1017 | 186.8814384 | 9.5956422 | -16.7 | 14.54 | 25.83 | 25.19 | 53.69 | 19.3 | |
| NGVSUDG-10 | VCC1052 | 186.9800778 | 12.3692963 | -15.2 | 16.06 | 27.00 | 26.43 | 47.44 | 36.2 | |
| NGVSUDG-11 | VLSB-B | 187.0419691 | 12.7248463 | -12.3† | 18.42 | 28.30 | 27.89 | 31.27 | 20.4 | |
| NGVSUDG-14 | VCC1287 | 187.6017905 | 13.9818128 | -15.6 | 15.71 | 26.58 | 26.01 | 45.84 | 50.1 | |
| NGVSUDG-19 | 188.3732917 | 15.2341111 | -13.8 | 17.51 | 27.24 | 26.67 | 27.20 | 21.7 | ||
| NGVSUDG-20 | 188.8035833 | 7.0562222 | -13.2 | 18.09 | 28.82 | 28.26 | 43.48 | 22.1 | ||
| NGVSUDG-A04 | VCC615 | 185.769125 | 12.0148333 | -14.2† | 17.25 | 26.86 | 26.34 | 26.33 | 23.3 | |
| NGVSUDG-A10 | VCC1448 | 188.1699846 | 12.7711479 | -17.6 | 13.67 | 24.56 | 23.88 | 43.92 | 32.6 |
When comparing to the literature, although the number of UDGs with velocity dispersions available is growing (Martínez-Delgado et al., 2016; van Dokkum et al., 2017, 2019; Chilingarian et al., 2019; Danieli et al., 2019; Emsellem et al., 2019; Martín-Navarro et al., 2019; Collins et al., 2020; Müller et al., 2020; Forbes et al., 2021; Gannon et al., 2021), we will restrict our comparison sample to only those that follow our selection criteria of being outliers in at least one of the luminosity-size-surface brightness scaling relations described above. These include: DGSAT-I (Martínez-Delgado et al., 2016; Martín-Navarro et al., 2019), DFX1 (van Dokkum et al., 2017), DF44 (van Dokkum et al., 2019), NGC1052-DF2 (Danieli et al., 2019; Emsellem et al., 2019), UDG7 (Chilingarian et al., 2019), AndXIX (Collins et al., 2020), and UDG113716 (Gannon et al., 2021).
2.2 Keck Observations and Data Reduction
The observations for this project were carried out at the Keck observatory starting in spring 2017. The results for the first three UDGs observed are published in Toloba et al. (2018). Subsequent observations in spring semesters were affected by unusual events such as an earthquake, the Kilauea volcanic explosion, a snow blackout, and the pandemic. The dates when we gathered data are March 4 2017, February 14 2019, April 24 and 25 2019, February 3, 26 and 27 2020, April 11 2021, and May 10 2021.
All data were collected at the Keck Observatory (Mauna Kea, Hawaii), using the DEIMOS spectrograph (Faber et al., 2003) located in the Keck II 10 meter telescope. The instrumental configuration consists of the 600 lines/mm grating centered at 7200 Å with the GG455 blocking filter. We design one slitmask per UDG with slits that are wide, with the exception of NGVSUDG-11 for which two slitmasks were designed with different position angles. The wavelength coverage depends on the position of the slit on the slitmask, but roughly, covers Å with a pixel scale of 0.52 Å/pixel and an average spectral resolution of 2.8 Å (FWHM). The seeing in our observations varies, on average, from 05 to 09 (FWHM). The exposure time per mask ranges from 4680 s to 26,221 s. This large range is due to on-the-fly adjustments due to seeing variations and sky transparency conditions.
We reduce the data with the SPEC2D pipeline (Cooper et al., 2012; Newman et al., 2013). In short, this pipeline subtracts the bias and dark current, corrects for flat-fielding, removes cosmic rays, and subtracts the sky. The version of the pipeline we used, described in Kirby et al. (2014, 2015), includes the following modifications: (1) the wavelength solution is improved by tracing the sky lines across the slit; (2) the object extraction is optimized by tracing the location of the object along the slit accounting for the differential atmospheric refraction.
The line-of-sight velocities of the GC satellites of NGVSUDG-14 are presented in Beasley et al. (2016). We take the published measurements of these six GC as they have uncertainties that are comparable to ours (median velocity uncertainty 17 km s-1) and calculate our own velocity dispersion for the UDG using the methods described below. The velocity dispersion obtained in Section 3 is within the error bars of the measurement obtained in Beasley et al. (2016).
2.3 Hubble Space Telescope Data
In Toloba et al. (2018), we found that NGVSUDG-11 is a UDG with a Milky Way-like line-of-sight velocity (close to 0 km s-1). Even though it is not uncommon to find such low, or even negative, radial velocities for objects in the Virgo cluster (e.g. Boselli & Gavazzi, 2006), this makes it difficult to distinguish GCs belonging to NGVSUDG-11 from Milky Way (MW) stars, as they both appear as point-like sources in ground-based images and can have overlapping colors. We use the exquisite spatial resolution of the Hubble Space Telescope (HST) to address the issue, as Virgo GCs will be spatially resolved in HST images. The information obtained from the analysis of this single galaxy is also used in the membership criteria discussed in Section 3.2.
We use the HST imaging from GO-15417 (PI: E. W. Peng). This program consists of a single HST orbit centered in NGVSUDG-11 and observed with WFC3/UVIS with the F606W filter and a coordinated parallel observation using ACS/WFC also with the F606W filter. Details on the observations, data reduction, and analysis are described in Zhang et al., in prep. We follow the steps of Jordán et al. (2009) where GCs are identified in the Virgo cluster using HST/ACS imaging. In short, we run GALFIT (Peng et al., 2002) to fit PSF-convolved King models (King, 1966) to determine the sizes of point-like sources. We run extensive simulations to determine how well we can fit GC sizes. The average of a GC in the Virgo cluster is 2.6 pc (Jordán et al., 2005), while all objects with pc in the HST imaging are resolved, and, are thus, GCs instead of MW foreground stars.
Zhang et al., in prep. uses the GC luminosity function and the mean sizes of the GCs found in this HST/WFC3 imaging to estimate the distance to NGVSUDG-11 of Mpc. This distance puts this galaxy in the foreground of Virgo, which is located at 16.5 Mpc and has a line-of-sight depth of Mpc (Mei et al., 2007). We use this distance for this galaxy thoughout this paper.
| Galaxy | ||||||||
|---|---|---|---|---|---|---|---|---|
| km s-1 | km s-1 | M⊙ | M⊙ | M⊙ | ML⊙ | |||
| (1) | (2) | (3) | (4) | (5) | (6) | (7) | (8) | (9) |
| NGVSUDG-04 | 14 | 95 | ||||||
| NGVSUDG-05 | 6 | 100 | ||||||
| NGVSUDG-09 | 8 | 100 | ||||||
| NGVSUDG-10 | 5 | 0 | ||||||
| NGVSUDG-11 | 14 | 100 | ||||||
| NGVSUDG-14 | 6 | 97 | ||||||
| NGVSUDG-19 | 3 | 100 | ||||||
| NGVSUDG-20 | 6 | 100 | ||||||
| NGVSUDG-A04 | 8 | 99 | ||||||
| NGVSUDG-A10 | 9 | 83 |
3 Kinematic Measurements and Stellar Masses
3.1 Line-of-sight Velocity
Line-of-sight velocities are measured for all GC candidates using the penalized likelihood software pPXF (Cappellari & Emsellem, 2004; Cappellari, 2017). The templates used in pPXF are a set of 17 high signal-to-noise stellar spectra ( Å-1) observed with the same instrumental configuration as the data, so that both the templates and the science spectra have the same instrumental profile. These 17 stars are selected to cover a large range of spectral types (from B1 to M0) and all luminosity classes (from supergiants to dwarfs).
Point sources can be miscentered along the slit width direction due to a small misalignment or rotation of the mask. This miscentering is observed as a velocity shift in the atmospheric absorption B and A-bands located at Å and Å. We use pPXF to measure the line-of-sight velocity of these absorption features and, if the velocity obtained shows a good clear fit and the velocity is km s-1 (maximum value allowed due to the slit width and instrumental configuration), then the velocity shift is applied prior to measuring the line-of-sight velocity of the science object. The median A-band correction applied is 8.8 km s-1.
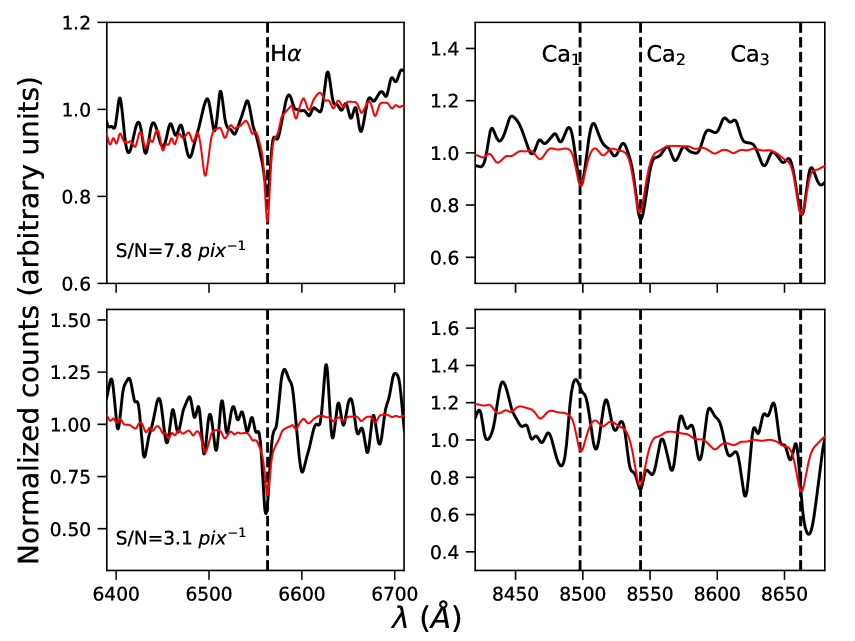
The line-of-sight velocities for all science targets are visually inspected and accepted if at least two clear lines are identified in the fit ( and/or the Calcium triplet lines, see Figure 3). The and Magnesium triplet regions although observed, are not used for the velocity measurements as the is typically very low in that region. The uncertainties for the velocities are estimated doing Monte Carlo (MC) simulations. In each of the 1000 simulations run per object, the flux of the science target is modified within the flux uncertainty obtained in the reduction process assuming it is Gaussian. In the inspection of the individual fit for each science target, the distribution of the MC simulations is also inspected and used as an additional criterion to accept the velocity. The distribution of the simulations must be single-peaked although it may be skewed. The velocity uncertainty reported are the 16th and 84th percentiles.
3.2 GC Membership Criteria
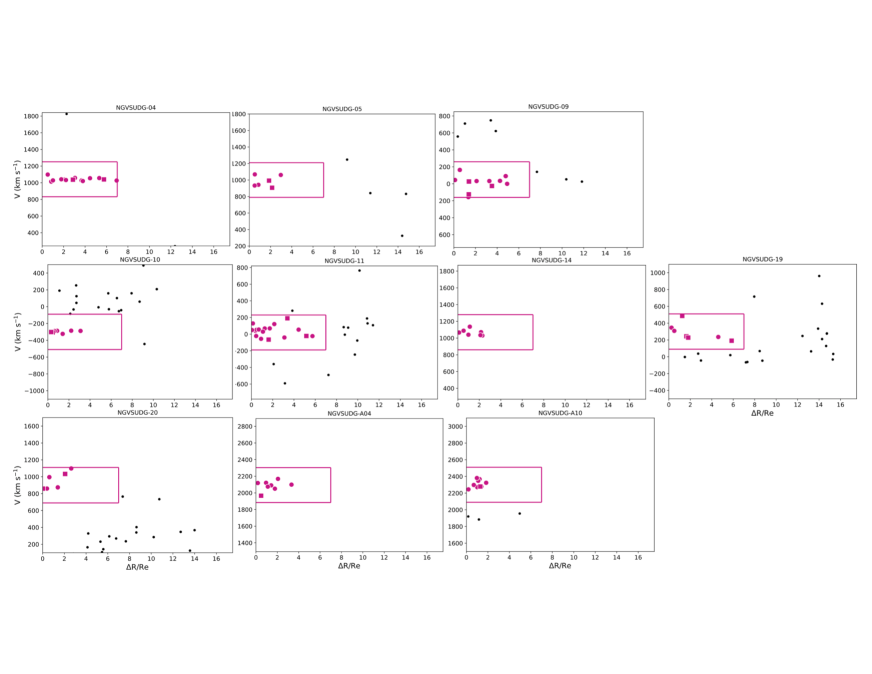
The criteria used to decide whether a GC is a satellite of a UDG are described in Toloba et al. (2016, 2018). The criteria are based on two simultaneous conditions: the GC candidates must be close to the UDG in both sky coordinates and velocity. After careful inspection of the velocitydistance space (where distance is measured in terms of the of the UDG), and accounting for the photometric likelihood of the objects to be GCs, we decide to use the conservative numbers of (where is the distance on the sky of each GC candidate to their potential host and corresponds to that host) and a velocity spread of 210 km s-1 centered on a tentative systemic velocity for the galaxy under study. The spatial motivation for this choice is that includes all GC candidates without large gaps in the spatial direction except for NGVSUDG-19, and it specially includes all GC candidates for NGVSUDG-04. In the case of NGVSUDG-04, all of the GC candidates have such a small dispersion in velocity that it is very likely all of them are satellites. The motivation for the velocity spread of 210 km s-1 is that this value is three times a stellar velocity dispersion of 70 km s-1. This relatively large velocity dispersion could be expected for some UDGs in our sample (Toloba et al., 2018). Figure 4 shows the membership criteria applied to each UDG. Reducing or enlarging the velocity spread of 210 km s-1 does not change the number of GCs selected as satellites. A maximum of one GC may be added for some galaxies if the velocity spread considered is smaller, but, as described in Section 3.3, removing one GC from our analysis does not change the results.
Whether a photometrically selected GC candidate is a true GC is mostly determined by their radial velocity. Background galaxies that appear point-like in our ground-based NGVS images and show red colors in do not have absorption lines that coincide with the and Calcium triplet regions, instead, they show prominent emission lines indicating they are sources at higher redshift. However, sources where the photometric likelihood of being a GC (again, based on the concentration index and colors) is not high and that exhibit radial velocities consistent both with being Milky Way (MW) stars and GCs at the distance of Virgo ( km s-1) are difficult to categorize as GC satellites.
To better assess the nature of these objects (MW stars vs. Virgo GCs) we use HST photometry of NGVSUDG-11 (see Section 2.3), a UDG with a radial velocity close to 0 km s-1 (Toloba et al., 2018). In the region covered both by HST/WFC3 and Keck/DEIMOS, we find that two of our spectroscopically measured GC satellite candidates have pc, which makes them most likely MW foreground stars. These two objects are the only two with low likelihood of being GCs in our spectroscopic sample in this area. We decide, to be conservative, that all GC candidates with measured radial velocities km s-1 and a low photometric likelihood of being GCs are most likely MW stars (this velocity range is motivated by the fact that MW stars have radial velocities km s-1; e.g. Cunningham et al., 2019). This leads to excluding from our analysis all low photometric likelihood objects in the UDGs NGVSUDG-09, NGVSUDG-10, NGVSUDG-11, and NGVSUDG-19 (red squares in Figure 4). For the remaining UDGs, the low photometric likelihood objects cannot be MW contaminants as their velocities are too large to be gravitationally bound to the MW ( km s-1). Further analysis of our HST photometry in NGVSUDG-A04 presented in Mihos et al. (2022) (GO-15258, PI: J. C. Mihos) shows that all objects used in this work for NGVSUDG-A04 are resolved point-like sources, which confirms their GC nature. Table 2 shows the final number of GC satellites considered for each galaxy.
Point-like sources detected in the ground-based NGVS data with measured radial velocities that are km s-1 could be both GC satellites of the target UDG or cluster GC interlopers. The distinction between the two is virtually impossible as both populations have the same sizes, colors, and radial velocities. The likelihood of these objects being GC satellites increases with decreasing distance to the center of the target galaxy. Closer to the center of the galaxy the majority of GCs are expected to be satellites, but regardless, we assess in Section 3.3 the influence that having GC cluster interlopers would have in our measurements.
3.3 Systemic Velocity and Velocity Dispersion
We use the GC satellites identified following the criteria described in Section 3.2 as tracers of the gravitational potential of each of the target UDGs. We use a Markov Chain Monte Carlo method (MCMC; Foreman-Mackey et al., 2013) to determine the systemic velocity () and velocity dispersion () of each galaxy. We assume that the line-of-sight velocities of the GC satellites come from a Gaussian distribution centered on with a width of . The logarithmic probability of such a distribution is:
| (1) |
where is the number of GC satellites and and are the radial velocity and error of each GC satellite, respectively. The results obtained can depend on the prior used, in particular for low number of tracers (see Doppel et al., 2021, for an exhaustive analysis of the prior effects for estimations). Doppel et al. (2021) find that a flat prior produces a systematic bias that overestimates the measured , while the Jeffreys prior, due to its net effect of shortening the tails of the posterior distribution function, provides a that resembles more closely the true value. Here we make our calculations both with a flat prior and a Jeffreys prior using three burns in each case to ensure convergence. The results of the previous burn is used as first guess for the next one.
The flat prior only puts limits to the expected values of the physical quantities we are calculating. In our case, the flat prior assumes km s-1, which is the typical range of radial velocities for Virgo cluster galaxies (Boselli & Gavazzi, 2006), and km s-1, which is a plausible range of values for galaxy dispersions. The Jeffreys prior depends on the model used to fit the data, which in our case is a Gaussian function characterized by two parameters, the center and width. The Jeffreys prior for the center of a Gaussian function is 1, and for its width is . Equation 1 works in natural logarithmic space, thus, to introduce the Jeffreys prior, we have to add a factor of .
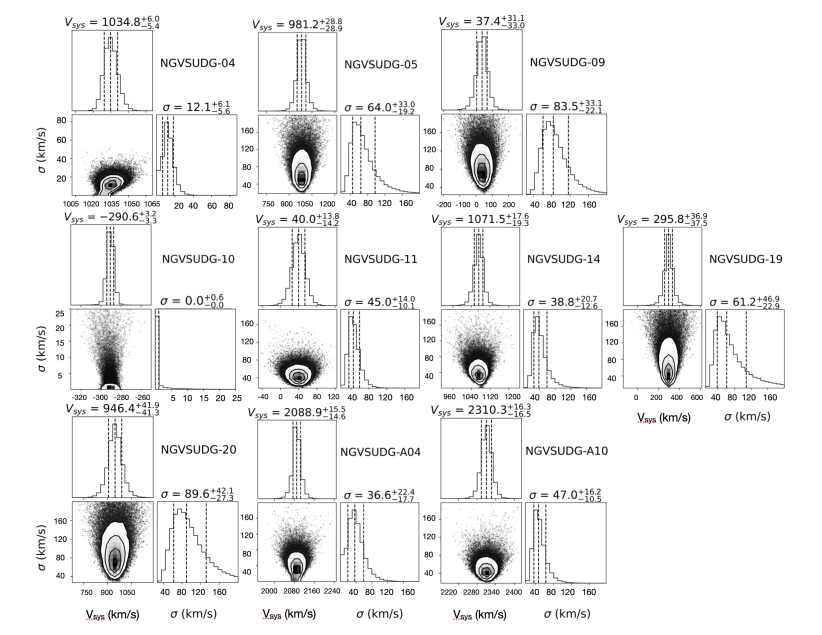
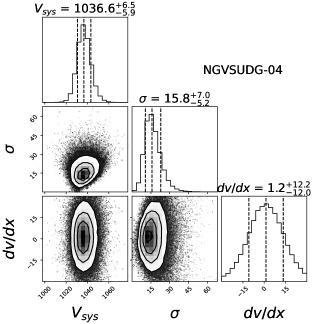
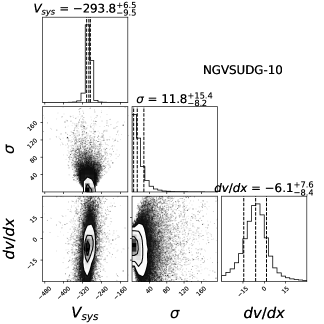
Figure 5 shows the two dimensional and marginalized posterior probability density function (PDF) for our sample of UDGs using the Jeffreys prior. For small numbers of GC satellites, the flat prior always finds a larger value for the velocity dispersion than the Jeffreys prior, while is always nearly identical and within the error bars. Doppel et al. (2021) use the Illustris simulations with GCs introduced following the method of Ramos-Almendares et al. (2020) to verify this overestimation.
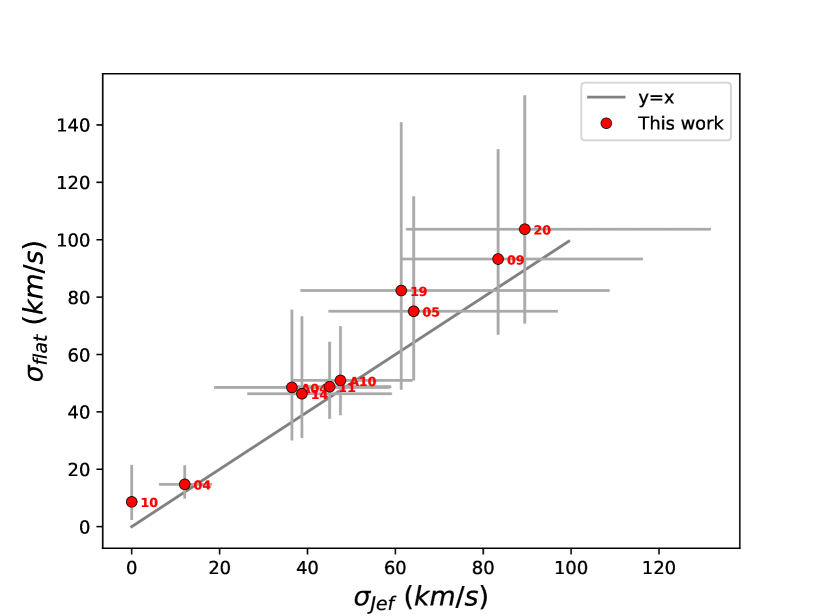
The velocity dispersion obtained for NGVSUDG-10 is consistent with being 0 km s-1 when the Jeffreys prior is used. This is expected based on the very narrow distribution of velocities shown in Figure 4. When the flat prior is used, the dispersion obtained for this galaxy is km s-1. These two low numbers suggest that the real dispersion of these GC satellites are most likely within our error bars and, while slightly overestimates the real value, it is so low that the Jeffreys prior cannot resolve it within the uncertainties. To estimate for this galaxy we use the calculated for all other galaxies using both the flat and Jeffreys priors (see Figure 6). We fit a line to the relation for all other galaxies and find:
| (2) |
Using for NGVSUDG-10, we estimate its . Table 2 shows the results for and for each UDG using Jeffreys prior for all MCMC implementations but for NGVSUDG-10, for which we use the Jeffreys dispersion calculated using Equation 2.
As discussed in Section 3.2, the samples used here are fully cleaned from background galaxies, however, there is still a remote possibility that we have cluster GC interlopers, or MW stars in the case of NGVSUDG-09, NGVSUDG-10, NGVSUDG-11 and NGVUDG-19. We assess the contribution of these possible contaminants by removing one GC candidate for each galaxy at a time and running the same MCMC method. The results obtained in all cases and for all galaxies are always within the errorbars. If these contaminants are present in any of our galaxies, they are not significantly affecting the results. See Section 5.1 for a detailed discussion on the possible contaminants.
In Toloba et al. (2018) we investigate the possibility of the GCs in some UDGs showing rotation. In that paper, we find hints of some coherent disturbance in the velocities of the GCs of NGVSUDG-04 along the semimajor axis. We analyze this possibility in Appendix A for all 10 galaxies in our sample, however, we only find some weak hints of velocity disturbances in NGVSUDG-04 and NGVSUDG-10. In both cases, the velocity gradient estimated has large uncertainties and is consistent with zero. Curiously, these are the two UDGs in our sample with, somewhat, elongated structures that may be indicative of tidal interactions. Getting a result for rotation consistent with zero or not a convergence of the MCMC method suggests that the rotation, if present, cannot be measured with these data, which puts an upper limit for the rotation of GCs to km s-1, which is the median radial velocity uncertainties for our sample. See Appendix A for more details on this analysis.
3.4 Stellar Mass Estimates
Stellar masses are determined for all entries in the NGVS galaxy catalogue via modelling of their spectral energy distributions (SEDs, Roediger et al., in prep.). The SEDs are measured following one of two approaches: fitting elliptical isophotes with a bespoke code based on IRAF/ELLIPSE (Jedrzejewski, 1987) or fitting 2D Sérsic models with GALFIT (Peng et al., 2002). Readers interested in the modelling of the light distributions of NGVS galaxies are referred to Ferrarese et al. (2020). For galaxies with mag (the band magnitude from the Virgo Cluster Catalog, VCC; Binggeli et al., 1985) we draw on the growth curves from IRAF/ELLIPSE, and measure fluxes integrated within the first isophote where the -band growth curve flattens. For all other galaxies we use the total fluxes (integrated to infinity) of the best-fit model found by GALFIT. Errors in the integrated fluxes are estimated by summing the per-pixel contributions from Poisson noise of the source and sky, and read noise, while enforcing lower limits equal to the precision of the NGVS photometric calibration.
We model the SEDs using the code PROSPECTOR (Johnson et al., 2021). This code, based on the Flexible Stellar Population Synthesis (FSPS) model suite (Conroy et al., 2009), allows its users to generate photometric and spectroscopic data for synthetic stellar populations for a variety of star formation histories (SFHs), metallicities, initial mass functions (IMFs), dust attentuation curves, etc. and to measure the Bayesian PDF of model parameters via MCMC or dynamic nested sampling algorithms. We employ FSPS simple stellar population spectra based on the MIST isochrones (Dotter, 2016; Choi et al., 2016), the MILES stellar library (Sánchez-Blázquez et al., 2006; Falcón-Barroso et al., 2011), and the Chabrier initial mass function (IMF; Chabrier, 2003), and model the NGVS photometry using four free parameters: one for stellar mass, two for our assumed delayed- SFH (age, timescale), and one for metallicity. We adopt flat priors for all parameters, either on linear (age, metallicity) or logarithmic (mass, timescale) ranges. We sample the posteriors using the MCMC algorithm offered by PROSPECTOR and report stellar masses as the median values of the marginalized PDFs. Adding an additional free parameter to our modelling to represent attenuation by a simple dust screen changes our stellar mass inference by less than for of the NGVS galaxy sample. It should also be noted that fits including dust attenuation do not produce a statistically significant improvement in maximum likelihood for of the sample (Roediger et al., in prep.).
3.4.1 Stellar Mass Within
When comparing physical magnitudes it is important to measure all of them within the same aperture. While the literature uses stars to estimate the velocity dispersion of galaxies, we use GCs. When stars are used, the aperture that contains half the light is the and the stellar mass within is then, by definition, half the total stellar mass estimated (). However, when GCs are the dynamical tracers, the mass within the aperture that contains half the tracers () has to be calculated. We estimate using the curve of growth in the reddest band for which we have NGVS photometry, the band, and integrate it within a radius that contains half the tracers ( calculations are described in Section 4.1). We follow the Equations described in Graham & Driver (2005).
4 Results
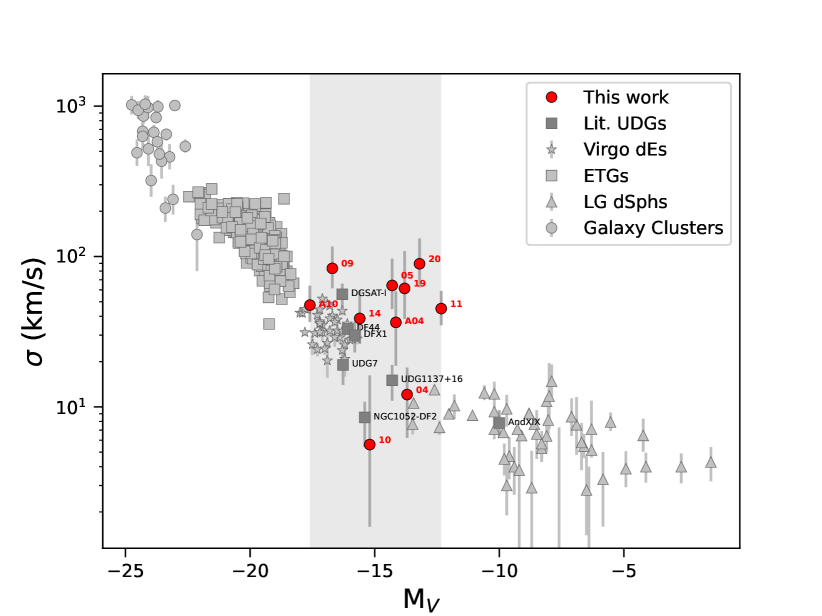
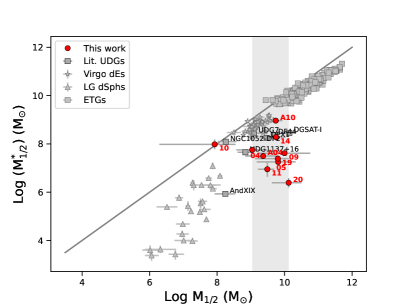
The velocity dispersion of non-rotating systems is an important proxy for mass. Quiescent galaxies show a well defined luminosity-velocity dispersion relation, which evolves from km/s in bright galaxies with at the centers of galaxy clusters to - km/s in dSph in the Local Group with . Figure 7 shows a compilation of data from the literature showing this trend, including clusters of galaxies (Zaritsky et al., 2006), local volume early type galaxies (ETGs from the ATLAS3D survey; Cappellari et al., 2013), Virgo cluster dwarf early type galaxies (dEs; Toloba et al., 2014) and Local Group dwarf spheroidal galaxies (LG dSphs; Wolf et al., 2010; Wheeler et al., 2017).
We overlay in Figure 7 the velocity dispersion as a function of -band magnitude for our sample of UDGs (red symbols) with the caveat that our values are computed using GCs and not stars, unlike the compilation of data from literature for all early-type galaxies. We find a very large intrinsic scatter in the observed for our UDG sample, which is substantially larger than the variations found in dEs or dSphs at similar luminosities. For comparison, we also highlight using dark-grey squares previous measurements for UDGs in the literature that satisfy our definition as scaling relation outliers (see Section 2 for details). The of these UDGs from the literature are all obtained from stars. None of these UDGs are in the Virgo cluster. They are either in isolation or a satellite of a more massive companion (M31, NGC1052, or UDG113716) with the exception of UDG7, which is in the Coma cluster. There are GC counts only for three out of the seven UDGs from the literature, and all three have large numbers of GCs. Notice that all literature UDGs with measured kinematics follow nicely the sequence of “normal” quenched galaxies, in agreement with the interpretation that such UDGs are the most extended tail of the “normal dwarfs” distribution.
Our Virgo UDG sample, however, shows more extreme behavior. While about - UDGs outline the normal galaxy sequence (NGVSUDG-A10, NGVSUDG-14, NGVSUDG-04, with NGVSUDG-10 slightly below due to suspected tidal stripping), about half of our sample is signficantly off the relation, showing very large velocity dispersion given their luminosity. These outliers include: NGVSUDG-05, NGVSUDG-11, NGVSUDG-19, NGVSUDG-20 and NGVSUDG-A04, with NGVSUDG-09 being borderline compatible. The high velocity dispersion in these UDGs suggests a larger dark matter mass content within and is at face value consistent with having overly-massive halos given their stellar content, in agreement with some of the first hypothesis for the formation of UDGs as “failed MW galaxies” (van Dokkum et al., 2015; Peng & Lim, 2016). Noteworthy, this is the first kinematical signature of such scenario ever reported (note that originally DF44 was believed to have a large velocity dispersion, but that has been revised, van Dokkum et al., 2019).
Besides the UDGs with large velocity dispersions, it is also interesting to highlight the broad range of kinematics measured in our sample. To attest to this kinematical diversity in UDGs, it is worth noting that NGVSUDG-10 in our sample shows a dispersion and luminosity that are very similar to NGC1052-DF2, which has been claimed to be devoid of dark matter (see van Dokkum et al., 2018a, b; Danieli et al., 2019; Emsellem et al., 2019), showing the exact opposite behavior to the subsample highlighted above: a velocity dispersion too low for their stellar content. As discussed in Lim et al. (2020), NGVSUDG-10 shows a peculiar morphology with possible spiral arms or tidal streams with some star formation, this suggests that tidal interactions with other galaxies may be a viable mechanism for the formation of UDGs with low velocity dispersion (Sales et al., 2020; Doppel et al., 2021; Moreno et al., 2022).
4.1 The Dynamical Mass and Dark Matter Content of UDGs
We calculate the total (dynamical) mass, using the following formula:
| (3) |
where is the velocity dispersion obtained from the MCMC analysis described in Section 3.3 and is the radius that contains half the dynamical tracers (dynamical mass estimation from Wolf et al., 2010). This mass estimator assumes the dynamical tracers have spherical symmetry and are in dynamical equilibrium. It is mostly insensitive to the anisotropy parameter of the orbits of the tracers and to projection effects (see Wolf et al., 2010). This formalism was shown in Doppel et al. (2021) to be able to accurately recover the true dynamical masses in dwarfs with or more GCs.
The parameters in our analysis corresponds to the radius that contains half the population of GCs. This radius is calculated by fitting a Sérsic profile with index (Sérsic, 1963) assuming circular distribution of only high probability candidate GCs (see Section 2.1). The parameter values for NGVSUDG-10 and NGVSUDG-19 are extremely uncertain; we estimate the value for these galaxies based on their half-light radius (). We fit a line to the relation for all UDGs excluding, of course NGVSUDG-10 and NGVSUDG-19, and also NGVSUDG-04 as it is the only galaxy that is more than away from the linear fit. The best fit is the following:
| (4) |
With this equation, we obtain the for NGVSUDG-10 and NGVSUDG-19 listed in Table 1. If we assume that, instead of these two galaxies following this relation (Equation 4), their is the same as (as it is common for early-type galaxies, e.g.; Peng et al., 2006) or even larger, then would be larger, too, making them even more dark matter dominated.
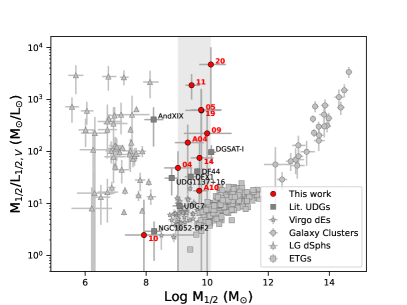
The left panel in Figure 8 shows the relationship between the total dynamical mass () and the mass-to-light ratio for our Virgo UDG sample (red symbols), UDGs in the literature (dark gray) and for the full range of quiescent objects compiled from the literature (light gray). In this space, while most UDGs, including those in the literature, appear to be more dark matter dominated at a given , some of the Virgo UDGs in this work show more extreme mass-to-light ratios -, so high that are on par with some of the faintest dSph in the Local Group or with the values found for clusters of galaxies as a whole.
Indeed, while mass-to-light ratio as a function of dynamical mass is known to show the “U”-shape behaviour outlined by the compilation of normal quenched galaxies, UDGs appear as objects with intermediate but high mass-to-light values, breaking the U-pattern known before. On the other hand, UDGs seem to preserve the minimum observed for other spheroidal galaxies, with not even the seemingly dark-matter poor NGVSUDG-10 or NGC1052-DF2 breaking such a trend.
A different way to look at the mass to light ratio of UDGs compared to other galaxies is to examine the stellar contribution to the dynamical mass estimated within . This is shown in the right panel of Figure 8, where is the stellar mass within the half-tracer radii. The gray line shows a one-to-one relation, which is the limit indicating that a galaxy does not have dark matter. As expected, NGVSUDG-10 and NGC1052-DF2 lie on the one-to-one relation, followed closely by massive (squares) and dwarf (stars) early-type galaxies (ETGs and dEs, respectively), where most of the dynamical mass can be explained by the stars, at least within their (Cappellari et al., 2006, 2013; Toloba et al., 2014).
UDGs in our sample span a wide range of stellar mass contribution at a relatively narrow dynamical mass range. Two of our Virgo UDGs and most of the literature UDGs show also a significant contribution of the stars to their dynamical mass within , making them comparable to dEs, but more extended. However, the remaining six UDGs in our sample (NGVSUDG-A04, NGVSUDG-05, NGVSUDG-11, NGVSUDG-19, NGVSUDG-20, and NGVSUDG-09) are clearly off this relation and show a much larger dark matter fraction within than dEs and ETGs. Actually, these six UDGs, which are the same ones highlighted as outliers in Fig. 7, seem to be as far away from the no-dark matter line as the Local Group dSphs (triangle symbols).
We estimate the dark matter fraction within the radius that contains half of the dynamical tracers in each galaxy using the relation:
| (5) |
Table 2 shows the dark matter fraction for each of our UDGs, which ranges from consistent with dark matter in NGVSUDG-10 to for NGVSUDG-05, NGVSUDG-09, NGVSUDG-11, NGVSUDG-19, and NGVSUDG-20, with a median dark matter fraction for all the UDGs in our sample . For comparison, the median dark matter fraction for ETGs and dEs are and , respectively, suggesting similar contributions from baryons and dark matter within , while the dark matter content for the Local Group dSphs is , consistent with the picture of dark matter dominated objects. Most of our UDGs and in particular the high- candidates highlighted before, have high dark matter fractions, , which are comparable to those only seen in the less-massive dSphs in the Local Group.
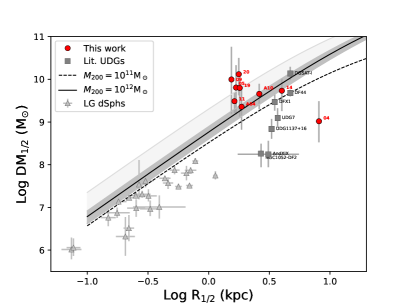
What halos would accommodate the measured kinematics in UDGs? Fig. 9 shows a compilation of dynamical mass estimates at the half-tracer radius for dSph (light triangles) and literature UDGs (dark gray squares) along with our new UDG sample (red symbols). For comparison, we include the mass profile expected for two NFW halos (Navarro et al., 1997) with virial masses and and concentration and respectively following (Dutton & Macciò, 2014). The dark gray shaded area indicate the changes expected when varying the concentration of the most massive NFW halo between and , while light gray shows a more concentrated case with for illustration, substantially larger than what is expected for MW-mass halos today.
In agreement with previous claims, most UDGs reported before this work are consistent with living in dwarf-mass halos with virial mass , with perhaps the exception of DGSAT-1. Of the UDGs in this work, agree with such scenario and have mass estimates with errors overlapping well with the case or below. However, the majority of our sample seems to prefer larger mass halos, consistent not only with virial masses, but also overly concentrated in order to explain their large estimates within the half tracer radii. In other words: UDGs in our sample come in all flavors: from those consistent with no dark-matter, to those living in dwarf-mass halos up to the majority living in overly-concentrated MW-mass halos.
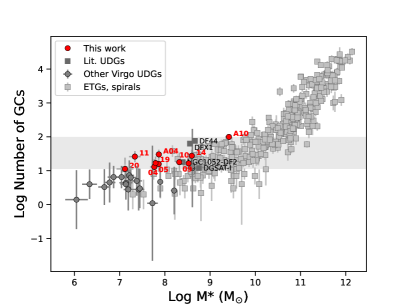
In terms of their GC content, we find that the UDGs in our sample occupy the large-number end of the distribution at a given stellar mass, with expected numbers - once corrected by incompleteness, radial distribution, and statistical contamination (see Lim et al., 2020, for details). In summary, the number of GC candidates in the NGVS images are counted within a of each galaxy, after applying a statistical background correction, and then doubled to estimate the number of observable GCs within a galaxy. As this final number can still have contaminants, an additional correction is applied based on the numbers of GC candidates statistically found within local background regions. The final estimates for the total number of GCs are listed in Table 1.
As shown on the right panel of Fig. 9, our UDGs show a modest excess of GCs compared to other galaxies. This bias is partially expected: we have selected all UDGs in the Lim et al. (2020) sample that have or more candidate GCs to increase the chances of obtaining accurate velocity dispersion measurements. We are therefore by default targeting objects with possibly the largest GC contents.
Of course, other properties of GCs, besides their numbers, such as colors and luminosity functions may shed some light on the formation mechanisms of these galaxies. We defer such a detailed study to future work, not before highlighting that while our Virgo UDGs show an excess of GCs, only our most massive UDG reaches GCs, and hence comparable to the MW, while the rest show a more humble GC excess or are, in some cases, consistent with GC numbers seen in other early-type dwarfs. The GC content of these UDGs remains quite impressive: UDGs with the stellar content of the Fornax dSph show - expected GCs, in contrast with the observed in Fornax dSph.
5 Discussion
In Section 3 we show that UDGs have extreme kinematic and dynamical properties: (1) of our sample have velocity dispersions that are larger than those found in other quiescent galaxies of the same luminosity; (2) of our UDGs are extremely dark matter dominated (), (3) they have dynamical masses that are larger than that found in other galaxies with similar stellar mass; (4) of our sample have more GCs than expected in galaxies of the same stellar mass (either dwarf galaxies or the remaining Virgo UDGs not included in this study, see Section 2).
5.1 Extreme UDGs in Virgo
The most important of our results is that a large number of UDGs in our sample (NGVSUDG-05, NGVSUDG-11, NGVSUDG-19, NGVSUDG-20 and NGVSUDG-A04) show very high velocity dispersion, km/s, several times what is expected for dwarf galaxies of similar stellar mass. This suggests that they inhabit overly massive dark matter halos, providing tentative support to the original “failed MW” or “failed galaxy” scenario for the highest UDGs. In such context, UDGs would inhabit massive dark matter halos that are more typical of galaxies to times brighter than themselves, requiring of additional physical processes to explain why the growth of the stellar component in the galaxy was truncated at an earlier stage compared to the growth of their dark matter halos.
The processes involved in shutting down so dramatically their star formation are, however, not well understood. One possibility is that the stellar growth truncation may be related to environmental processes such as ram pressure stripping or harassment in the cluster environments. However, no cosmological simulation has been able to naturally predict the formation of such extreme “failed” systems, despite having the ability to model environmental processes that result in realistic galaxy populations.
For instance, in current state-of-the-art cosmological numerical simulations such as TNG50, which models a cosmological volume large enough to include some spread in environment and accretion histories, UDGs are formed via high-spin halos and, to lesser degree, dynamical heating; with the expectation that they all inhabit dwarf-mass dark matter halos (Benavides et al., 2022). All other cosmological simulations that include high-density environments find a combination of processes involving feedback and environment, but in not a single case a failed-galaxy compatible with our measurement is predicted (Di Cintio et al., 2017; Chan et al., 2018; Jiang et al., 2019; Tremmel et al., 2020).
More exotic explanations for the formation of such systems have been proposed, for example invoking extreme conditions in the early universe leading to clumpy star formation with feedback so efficient that is able to self-quench the galaxy even in isolation (Danieli et al., 2022b). If such a scenario is plausible, it is yet to be predicted by our state-of-the-art cosmological models and most realistic feedback and star-formation treatments. The challenge is not minor: to generate objects as dark matter dominated as dSphs in the Local group, but in halos - times more massive. It would also imply, in the case of our sample, that this special mode of star formation was quite common for UDGs in the environment such as Virgo.
These large velocity dispersions could, in principle, be also due to tidal stripping or out-of-equilibrium processes. However, Doppel et al. (2021) explore this possibility using GCs tagged onto the Illustris simulations, and find that, even for galaxies with small numbers of GCs, the true mass is recovered typically within a factor of two. These simulations contain nine different clusters with galaxies showing a wide range of dynamical states, including undergoing tidal disruption and any out-of-equilibrium processes that arises from their evolution within the galaxy cluster. Although there are some outliers for which inferred masses are significantly larger than the true value, it is unlikely that of our sample lies within these outliers. A detailed study exploring all of these possibilities will be presented in Doppel et al., in prep.
Our results are the first to kinematically suggest the possibility of UDGs as “failed galaxies”. This scenario has been invoked before for UDG candidates in low density regions, such as NGC 5846-UDG1 and DGSAT-I (Danieli et al., 2022b; Janssens et al., 2022, respectively). However, the authors argue from different sets of observables related to the GC color and luminosities, not kinematics. In fact, DFX1 is consistent with the kinematics of the normal galaxies with the same luminosity in Figure 7, with only a modest mass-to-light ratio (van Dokkum et al., 2017). If this galaxy is indeed a “failed galaxy”, our sample of UDGs in Virgo show far more extreme level of “failing” at forming their stars, as their mass-to-light ratios range from to more than . None of the seven UDGs from the literature with kinematics information are in the Virgo cluster. All of them are in isolation or very low density environments but for one, UDG7 (Chilingarian et al., 2019), that is in the Coma cluster but shows properties fully consistent with those of dwarf early-types (see Figures 7 and 8). This reinforces the idea that such an extreme “failing” scenario could be related to the dense environment of the Virgo cluster.
We have additional and complementary information for two of our UDGs. Our HST imaging for NGVSUDG-A04 and NGVSUDG-11 shows that these galaxies are at distances of Mpc and Mpc, respectively (Mihos et al., 2022, Zhang et al. in prep.). These distances suggest that, while NGVSUDG-A04 is on the far end of the cluster, NGVSUDG-11 is in front of the cluster most likely no longer gravitationally associated with it and, thus, now in isolation as there are no other foreground galaxies at that distance projected into the core of the Virgo cluster. This galaxy is therefore a good candidate to be a backsplash object, as found for simulated quenched UDGs in the field using the TNG50 simulations (Benavides et al., 2021).
It is important, however, to consider the less exciting possibility that contamination by interlopers could be inflating the velocity dispersion estimates for our extreme UDGs. We are minimizing the presence of interlopers by selecting member GCs that are close in space and velocity to our UDGs (see Fig. 4). Yet, given the low number of tracers used for the determination, even the addition of a few contaminants could heavily impact the velocity dispersion measurement. The most likely contaminants are GCs in the intra-cluster component of the Virgo cluster or, in the case of UDGs with systematic velocity near km/s, foreground stars in the MW.
We have mitigated the impact of the foreground stars in the MW by restricting to GC candidates with the highest probability of being GCs based on their concentration index and colors (see Section 3.2). This choice is further justified by our HST observations of NGVSUDG-11 and NGVSUDG-A04, which confirmed that all GC candidates with this highest probability are in fact resolved from space, confirming their GC nature. In addition, we use the Besançon model to predict the expected number of MW stars that have the same apparent magnitude and colors as our selected GC candidates and are within the same solid angle and in the same line of sight of our selected sources. Using our selection function for each one of the Keck/DEIMOS masks, we find that for NGVSUDG-09, NGVSUDG-10, and NGVSUDG-19 no MW stars are expected within the GC satellite box defined in Figure 4. In the case of NGVSUDG-11, there could be up to a maximum of two MW stars within our box of GC satellites. However, we have HST imaging for this galaxy showing that eleven of the GC satellites are resolved objects, confirming their GC nature, and including or removing the additional three, which are outside the field of view of the HST imaging, does not significantly change the velocity dispersion of this galaxy. Therefore, it is unlikely that foreground contamination significantly affects our results.
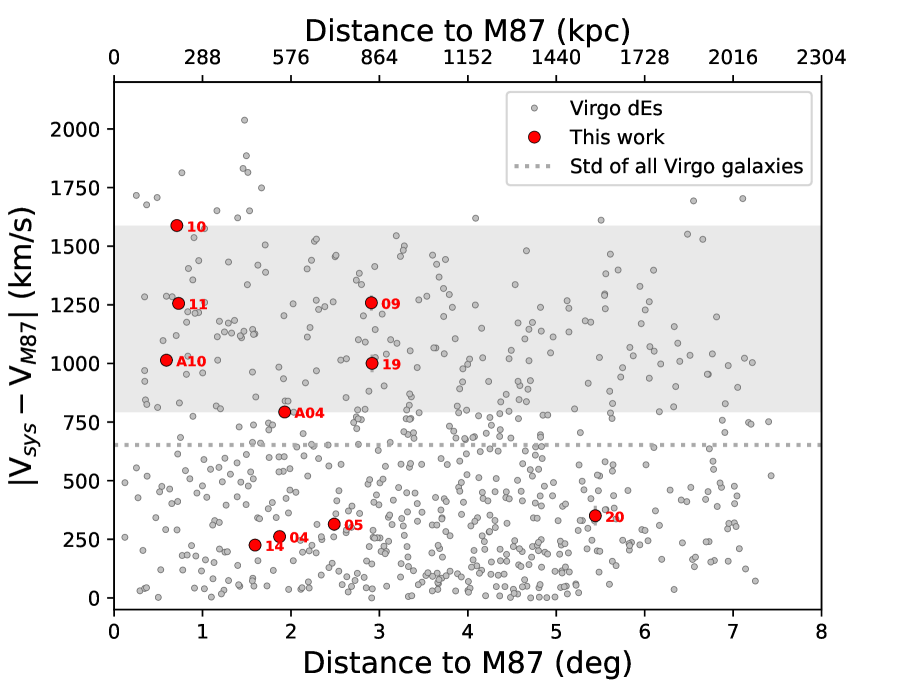
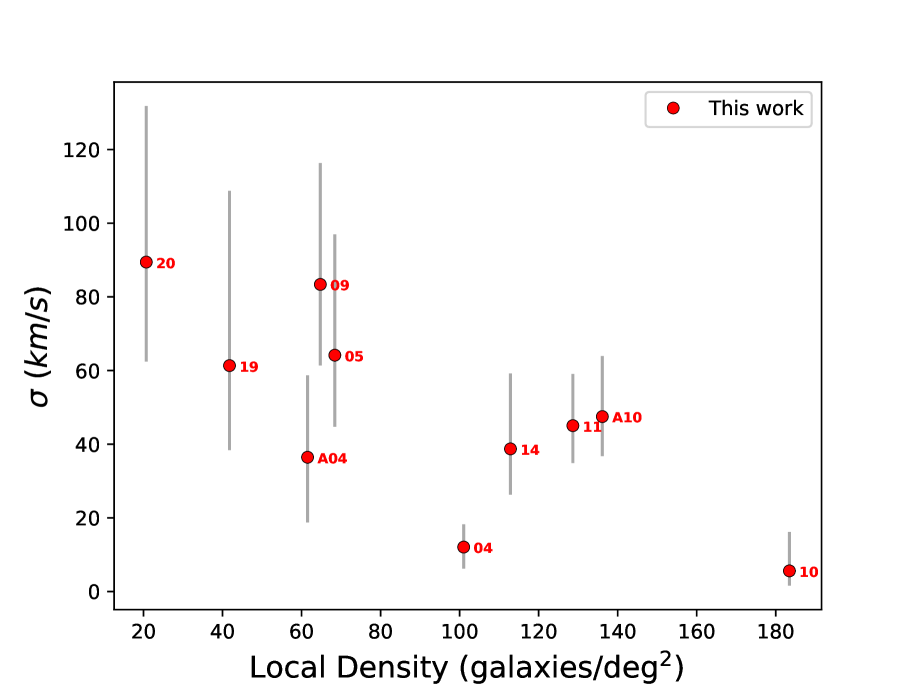
Contamination by intra-cluster GCs, on the other hand, is in principle possible for UDGs with velocities more typical of the Virgo mean velocity of km s-1. Encouragingly, a point to argue against significant contamination from intra-cluster GCs in Virgo is the fact that several of the extreme UDGs have also quite large cluster-centric relative radial velocities () km s-1 (see Figure 10), which would make the likelihood of overlap in velocity-space between their associated GCs and the intra-cluster GCs of Virgo quite small. Figure 11 shows that the UDGs with the highest are in fact located in regions of low projected local density, which means that they are surrounded by a small number of neighbors. The vast majority of those neighbors are dwarf galaxies with , such low luminosity dwarf galaxies rarely have any GCs and, if they do, they do not extend spatially far enough to be within our selection box (Peng et al., 2006). A special case of intra-cluster GCs contamination is NGVSUDG-10 and NGVSUDG-11, the only galaxies in our sample that are closer both in projected distance and velocity to M86, an early-type galaxy member of the Virgo cluster with a systemic velocity of km s-1(Cappellari et al., 2011), than to M87. In this case, resolved objects with negative or close to zero velocities could be M86 GCs. However, NGVSUDG-10 has such a low that its dark matter is negligible. If there are some M86 GCs contaminating our sample, they are not significantly increasing the dispersion of this galaxy. In the case of NGVSUDG-11, removing one single random GC from our sample does not change the measured velocity dispersion (see details in Section 3.3). To reconcile the current position of NGVSUDG-11 in the relation, its dispersion needs to be km s-1 smaller. Even by nearly quadrupling the sample of GCs presented in Toloba et al. (2018) for this galaxy, its remains the same. This gives us confidence that, if some contaminants are present, is not dramatically affected.
NGVSUDG-09, NGVSUDG-19, and NGVSUDG-A04 belong to the high-velocity tail in phase space, are also large objects, and are quite isolated without any nearby bright galaxy. Since the velocity distribution of intra-cluster GCs in Virgo is expected to be more consistent with the virialized, more bound regions of the cluster, the contamination in these extreme UDGs is näively expected to be small. Late-type galaxies have a broader velocity distribution within the cluster (e.g. Boselli & Gavazzi, 2006), however, their dispersion of km s-1 is still not enough to explain the more extreme velocity distribution found in this sample of UDGs, where the majority of the UDGs are beyond km s-1 from the center of the velocity distribution. This suggests that UDGs with large amounts of GCs have an extreme velocity distribution within the Virgo cluster, possibly even larger than that of late-type galaxies. A more detailed evaluation of contamination effects expected for these UDGs will be presented in upcoming work (Doppel et al., in-prep). Confirmation and validation of the “failed galaxy” scenario for the candidates presented here will ultimately require significant observing time commitment to measure velocity dispersions from the stellar component in the body of these galaxies.
An additional consideration is whether these systems are in equilibrium. Small deviations from equilibrium do not significantly affect the velocity dispersion measured (see Doppel et al., 2021, where they analyze how skewness and kurtosis of the Gaussian distribution of tracers do not significantly affect the velocity dispersion measured).
5.2 Less extreme UDGs in Virgo
Considering our full sample, the results support the scenario where more than one mechanism of formation is necessary to explain the properties of UDGs, even if a restrictive selection criteria, like the one assumed here following Lim et al. (2020), is applied. We discuss some of the less-extreme cases individually below and interpret them in view of the formation paths discussed in Sales et al. (2020). Using Virgo-like clusters from the Illustris TNG100 cosmological hydrodynamical simulation Sales et al. (2020) finds two main paths to form cluster UDGs: (a) born-UDGs are field low surface brightness galaxies that recently ( Gyr ago median, albeit with significant dispersion) entered the cluster and now show large amounts of dark matter and have stellar populations with intermediate ages and low metallicities; (b) tidal-UDGs are higher surface brightness galaxies that fell into the cluster early-on and, as a consequence, have little to no dark matter left, old stellar ages and high metallicities. Note that born-UDG could correspond to several internal mechanisms discussed in the literature, such as strong feedback (Di Cintio et al., 2017; Chan et al., 2018) or high-spin halos (Amorisco & Loeb, 2016; Benavides et al., 2022).
Five of the Virgo UDGs studied here may not be as extreme as the rest of our sample. NGVSUDG-10 lacks dark matter, i.e. its velocity dispersion is explained by stars alone. NGVSUDG-04 has an extremely low velocity dispersion, consistent with dSphs of the same luminosity. These are the only two galaxies with morphological hints of tidal tails, which could explain their lower dark matter content. In Appendix A we investigate the possibility of these galaxies showing some rotation. However, the results are not conclusive and are consistent with no velocity gradients. These two galaxies could be consistent with being tidal-UDGs. NGVSUDG-A10, NGVSUDG-14, and NGVSUDG-09 have consistent velocity dispersions with dwarfs of the same stellar mass, albeit an elevated dark matter fraction which might be explained by their more extended sizes compared to dEs, which could be consistent with a born-UDG scenario.
Having little to no dark matter is expected for low mass galaxies (dEs) in the Virgo cluster (Toloba et al., 2014), however, the stellar mass range of these UDGs has not been dynamically studied in the Virgo cluster due to the extremely low surface brightness of these counterpart dEs. Studies targeting the properties of dEs with in Virgo are necessary to confirm the hypothesis that these objects are consistent with the extended tail of normal dwarfs with the same stellar mass (low mass dEs) or “born-UDGs”, or if they are better explained by more massive progenitors that got heavily tidally stripped “tidal-UDGs”. Information about their stellar populations would help to answer this question, as massive early-type galaxies in any environment are on average older and more metal rich than Virgo cluster dEs (Toloba et al., 2014; McDermid et al., 2015).
6 Summary
We present kinematics ( and ) and derived dynamical masses for a sample of ten UDGs found in the Virgo cluster using spectroscopic data of their associated GCs from Keck/DEIMOS. This is the most numerous, uniform and most strictly selected sample of UDGs with kinematical information to date. The sample was homogeneously selected from a full analysis of the structural parameters of all galaxies detected in the NGVS footprint (Ferrarese et al., 2012). All of our UDGs were selected to be more than outliers in at least one of the scaling relations that combine luminosity, size, and surface brightness (see Lim et al., 2020). Our final sample of ten Virgo UDGs contains all UDGs with more than GC candidates, of them are outliers in all three scaling relations while are outliers in at least one.
MCMC analysis of the kinematics of these UDGs obtained from their spectroscopically confirmed GC satellites reveals a surprising scatter in their velocity dispersion, with about half of our sample following the expected relation defined by of other early-type galaxies and the other half showing substantially higher velocity dispersions, - km s-1, which is between - times what is expected for these galaxies given their luminosity. The diversity in the kinematics of this sample includes also a case consistent with very little or “dark-matter free” galaxy, NGVSUDG-10, which in this case may be explained by an ongoing case of tidal disruption.
The majority, , of the sample has extreme systemic velocities. While the center of Virgo is at km s-1 , most of our galaxies have velocities below km s-1 and above km s-1. In addition, the UDGs with the highest are in low density regions of the cluster, with only a few extremely low luminosity dwarf galaxies close by. These findings may suggest that UDGs, or at least those with large numbers of GCs, are a hot galaxy component within the Virgo cluster, with a dispersion larger than that of spiral galaxies. Most likely, the environment is playing an important role.
UDGs in the high- subsample provide, for the first time, kinematical support to the scenario that at least some UDGs might be “failed galaxies”. Previous studies used indirect diagnostics to propose that at least some UDGs could be hosted by overly massive dark matter halos, including arguments based on their GCs number, GC luminosity functions or colors (van Dokkum et al., 2015; Peng & Lim, 2016; Lim et al., 2018, 2020; Danieli et al., 2022b; Janssens et al., 2022). With the possible exception of DGSAT-1, all previous UDGs in the literature with kinematical data are instead consistent with normal dwarf halos and all of them, but for one, are found in low density environments. Our results are potentially an important paradigm shift from the settling scenario where all UDGs are the most extended tail of the dwarf galaxy population, since the kinematics and high mass-to-light ratios inferred for our high- sample are only compatible with massive halos, comparable or above that of the MW.
There are, however, caveats to be considered before rushing to conclusions. The most important of them is the possible role played by interlopers or contaminants in our identified population of associated GCs. Many of our UDGs have more or close to 10 GCs labeled as gravitationally bound and therefore participating of the velocity dispersion measurement. While numerical simulations suggest that such number is enough to provide an unbiased measurement of intrinsic kinematics (Toloba et al., 2018; Doppel et al., 2021), and that half of that tracers still provides nearly negligible offsets, it is still a relatively low number that may be biased if even a few interlopers are included in the calculation.
Expected contaminants might come mostly from two sources: foreground stars in the MW for Virgo objects with systemic velocity or intra-cluster GCs free-floating in the gravitational potential of the Virgo cluster. By using the concentration index and colors method informed with HST data we believe to have mitigated most of the impact from foreground stars in the MW (see Sec. 3). In addition, estimations using the Besançon model (Robin et al., 2012) and our selection function indicate that less than one MW star may have ended up within the GC satellite selection box. The fact that several of our potential “failed MW” UDGs also show extreme cluster-centric radial velocities and that all of them are in quite isolated areas of the Virgo cluster only surrounded by extremely low luminosity dwarf galaxies makes it less likely to be explained by contamination from intra-cluster GCs in Virgo, however this cannot be fully be ruled out without further data.
Regarding the total number of GCs in our calculations, in Toloba et al. (2018), with only 4 GCs we estimated km s-1 for NGVSUDG-11; in this work, with a total of 14 GCs, the new dispersion is km s-1. More than three times the number of GCs and still the velocity dispersion did not change much. This may not happen for all of our galaxies, but real data and simulations like those in Doppel et al. (2021), suggest that the number of GCs considered here is enough to estimate dispersions that should not exhibit offsets much larger than 5-10 km s-1, which are extremely small offsets in comparison to the extreme velocity dispersions measured for their luminosities.
Taken at face value, our results contribute two important points to our understanding of UDGs. First, there must be more than one mechanism to form such a diverse population. For those consistent with dwarf-mass halos, models that combine “born” UDGs with “tidal” UDGs seem to be the most adequate (Jiang et al., 2019; Sales et al., 2020). Second, for the puzzling population consistent with the “failing galaxy” scenario, there is yet much to be understood, as the physical mechanisms leading to their dramatic stellar growth truncation within such inferred massive dark matter halos are currently missing in all our state-of-the-art cosmological simulations of galaxy formation. Moreover, such ”failed galaxies” mean a potentially serious revision to the idea that galaxy formation efficiency is, to first order, determined solely by halo mass.
Our UDG sample selected to have a large number of GCs shows at least 50% of them belonging to this high velocity-dispersion category, suggesting that whatever the process is turning these halos extremely inefficient to form stars, it should be relatively common in high-density regions such as galaxy clusters. Follow up spectroscopic studies of the stellar components in these galaxies are necessary to confirm the velocity dispersion measurements presented here without uncertainties associated to GC membership as well as to constrain their star formation histories, possibly revealing clues on the reason for their “failure” to grow galaxies - times brighter as they were destined to form according to their halo kinematics.
Appendix A Velocity Gradient
We investigate whether the GCs in these UDGs show any velocity gradient. For this task, we use the MCMC implementation described in Toloba et al. (2018). The logarithmic probability that includes a velocity gradient has the following shape:
| (A1) |
where is the velocity gradient along the projected distance with position angle , which is calculated as follows:
| (A2) |
and are the coordinates of the photometric galaxy center.
None of our galaxies have enough GCs to run this MCMC implementation with four free parameters (, , , ). Even when reducing it to three free parameters by assuming that coincides with the semimajor axis of the galaxy, there is no clear evidence of a velocity gradient in any of the galaxies. All priors used in this MCMC implementation are flat priors within plausible physical ranges: km s-1; km s-1; and km s-1 arcmin-1.
Figure 12 shows the MCMC results for NGVSUDG-04 and NGVSUDG-10, the only two for which the MCMC shows proper convergence, however, the velocity gradients estimated show large uncertaintites and are consistent with zero. The values obtained for NGVSUDG-04 agree within the error bars with our previous results (Toloba et al., 2018). These are also the only two galaxies in our sample that show some stellar elongation that may be indicative of tidal interactions.
References
- Amorisco & Loeb (2016) Amorisco, N. C., & Loeb, A. 2016, MNRAS, 459, L51, doi: 10.1093/mnrasl/slw055
- Amorisco et al. (2018) Amorisco, N. C., Monachesi, A., Agnello, A., & White, S. D. M. 2018, MNRAS, 475, 4235, doi: 10.1093/mnras/sty116
- Astropy Collaboration et al. (2013) Astropy Collaboration, Robitaille, T. P., Tollerud, E. J., et al. 2013, A&A, 558, A33, doi: 10.1051/0004-6361/201322068
- Astropy Collaboration et al. (2018) Astropy Collaboration, Price-Whelan, A. M., Sipőcz, B. M., et al. 2018, AJ, 156, 123, doi: 10.3847/1538-3881/aabc4f
- Beasley et al. (2016) Beasley, M. A., Romanowsky, A. J., Pota, V., et al. 2016, ApJ, 819, L20, doi: 10.3847/2041-8205/819/2/L20
- Behroozi et al. (2013) Behroozi, P. S., Wechsler, R. H., & Conroy, C. 2013, ApJ, 770, 57, doi: 10.1088/0004-637X/770/1/57
- Benavides et al. (2022) Benavides, J. A., Sales, L. V., Abadi, M. G., et al. 2022, arXiv e-prints, arXiv:2209.07539. https://arxiv.org/abs/2209.07539
- Benavides et al. (2021) —. 2021, Nature Astronomy, 5, 1255, doi: 10.1038/s41550-021-01458-1
- Binggeli et al. (1985) Binggeli, B., Sandage, A., & Tammann, G. A. 1985, AJ, 90, 1681, doi: 10.1086/113874
- Blakeslee et al. (2009) Blakeslee, J. P., Jordán, A., Mei, S., et al. 2009, ApJ, 694, 556, doi: 10.1088/0004-637X/694/1/556
- Boselli & Gavazzi (2006) Boselli, A., & Gavazzi, G. 2006, PASP, 118, 517, doi: 10.1086/500691
- Bullock & Boylan-Kolchin (2017) Bullock, J. S., & Boylan-Kolchin, M. 2017, ARA&A, 55, 343, doi: 10.1146/annurev-astro-091916-055313
- Cappellari (2017) Cappellari, M. 2017, MNRAS, 466, 798, doi: 10.1093/mnras/stw3020
- Cappellari & Emsellem (2004) Cappellari, M., & Emsellem, E. 2004, PASP, 116, 138, doi: 10.1086/381875
- Cappellari et al. (2006) Cappellari, M., Bacon, R., Bureau, M., et al. 2006, MNRAS, 366, 1126, doi: 10.1111/j.1365-2966.2005.09981.x
- Cappellari et al. (2011) Cappellari, M., Emsellem, E., Krajnović, D., et al. 2011, MNRAS, 413, 813, doi: 10.1111/j.1365-2966.2010.18174.x
- Cappellari et al. (2013) Cappellari, M., McDermid, R. M., Alatalo, K., et al. 2013, MNRAS, 432, 1862, doi: 10.1093/mnras/stt644
- Carleton et al. (2019) Carleton, T., Errani, R., Cooper, M., et al. 2019, MNRAS, 485, 382, doi: 10.1093/mnras/stz383
- Chabrier (2003) Chabrier, G. 2003, PASP, 115, 763, doi: 10.1086/376392
- Chamba et al. (2020) Chamba, N., Trujillo, I., & Knapen, J. H. 2020, A&A, 633, L3, doi: 10.1051/0004-6361/201936821
- Chan et al. (2018) Chan, T. K., Kereš, D., Wetzel, A., et al. 2018, MNRAS, 478, 906, doi: 10.1093/mnras/sty1153
- Chilingarian et al. (2019) Chilingarian, I. V., Afanasiev, A. V., Grishin, K. A., Fabricant, D., & Moran, S. 2019, ApJ, 884, 79, doi: 10.3847/1538-4357/ab4205
- Choi et al. (2016) Choi, J., Dotter, A., Conroy, C., et al. 2016, ApJ, 823, 102, doi: 10.3847/0004-637X/823/2/102
- Collins et al. (2020) Collins, M. L. M., Tollerud, E. J., Rich, R. M., et al. 2020, MNRAS, 491, 3496, doi: 10.1093/mnras/stz3252
- Collins et al. (2013) Collins, M. L. M., Chapman, S. C., Rich, R. M., et al. 2013, ApJ, 768, 172, doi: 10.1088/0004-637X/768/2/172
- Conroy et al. (2009) Conroy, C., Gunn, J. E., & White, M. 2009, ApJ, 699, 486, doi: 10.1088/0004-637X/699/1/486
- Cooper et al. (2012) Cooper, M. C., Newman, J. A., Davis, M., Finkbeiner, D. P., & Gerke, B. F. 2012, spec2d: DEEP2 DEIMOS Spectral Pipeline, Astrophysics Source Code Library, record ascl:1203.003. http://ascl.net/1203.003
- Correa & Schaye (2020) Correa, C. A., & Schaye, J. 2020, MNRAS, 499, 3578, doi: 10.1093/mnras/staa3053
- Cunningham et al. (2019) Cunningham, E. C., Deason, A. J., Rockosi, C. M., et al. 2019, ApJ, 876, 124, doi: 10.3847/1538-4357/ab16cb
- Danieli et al. (2019) Danieli, S., van Dokkum, P., Conroy, C., Abraham, R., & Romanowsky, A. J. 2019, ApJ, 874, L12, doi: 10.3847/2041-8213/ab0e8c
- Danieli et al. (2022a) Danieli, S., van Dokkum, P., Trujillo-Gomez, S., et al. 2022a, ApJ, 927, L28, doi: 10.3847/2041-8213/ac590a
- Danieli et al. (2022b) —. 2022b, ApJ, 927, L28, doi: 10.3847/2041-8213/ac590a
- Di Cintio et al. (2017) Di Cintio, A., Brook, C. B., Dutton, A. A., et al. 2017, MNRAS, 466, L1, doi: 10.1093/mnrasl/slw210
- Doppel et al. (2021) Doppel, J. E., Sales, L. V., Navarro, J. F., et al. 2021, MNRAS, 502, 1661, doi: 10.1093/mnras/staa3915
- Dotter (2016) Dotter, A. 2016, ApJS, 222, 8, doi: 10.3847/0067-0049/222/1/8
- Dutton & Macciò (2014) Dutton, A. A., & Macciò, A. V. 2014, MNRAS, 441, 3359, doi: 10.1093/mnras/stu742
- Emsellem et al. (2019) Emsellem, E., van der Burg, R. F. J., Fensch, J., et al. 2019, A&A, 625, A76, doi: 10.1051/0004-6361/201834909
- Engler et al. (2021) Engler, C., Pillepich, A., Joshi, G. D., et al. 2021, MNRAS, 500, 3957, doi: 10.1093/mnras/staa3505
- Faber et al. (2003) Faber, S. M., Phillips, A. C., Kibrick, R. I., et al. 2003, in Society of Photo-Optical Instrumentation Engineers (SPIE) Conference Series, Vol. 4841, Instrument Design and Performance for Optical/Infrared Ground-based Telescopes, ed. M. Iye & A. F. M. Moorwood, 1657–1669, doi: 10.1117/12.460346
- Falcón-Barroso et al. (2011) Falcón-Barroso, J., Sánchez-Blázquez, P., Vazdekis, A., et al. 2011, A&A, 532, A95, doi: 10.1051/0004-6361/201116842
- Fensch et al. (2019) Fensch, J., van der Burg, R. F. J., Jeřábková, T., et al. 2019, A&A, 625, A77, doi: 10.1051/0004-6361/201834911
- Ferrarese et al. (2012) Ferrarese, L., Côté, P., Cuillandre, J.-C., et al. 2012, ApJS, 200, 4, doi: 10.1088/0067-0049/200/1/4
- Ferrarese et al. (2020) Ferrarese, L., Côté, P., MacArthur, L. A., et al. 2020, ApJ, 890, 128, doi: 10.3847/1538-4357/ab339f
- Forbes et al. (2021) Forbes, D. A., Gannon, J. S., Romanowsky, A. J., et al. 2021, MNRAS, 500, 1279, doi: 10.1093/mnras/staa3289
- Foreman-Mackey et al. (2013) Foreman-Mackey, D., Hogg, D. W., Lang, D., & Goodman, J. 2013, PASP, 125, 306, doi: 10.1086/670067
- Gannon et al. (2021) Gannon, J. S., Dullo, B. T., Forbes, D. A., et al. 2021, MNRAS, 502, 3144, doi: 10.1093/mnras/stab277
- Graham & Driver (2005) Graham, A. W., & Driver, S. P. 2005, PASA, 22, 118, doi: 10.1071/AS05001
- Guo et al. (2010) Guo, Q., White, S., Li, C., & Boylan-Kolchin, M. 2010, MNRAS, 404, 1111, doi: 10.1111/j.1365-2966.2010.16341.x
- Janssens et al. (2022) Janssens, S. R., Romanowsky, A. J., Abraham, R., et al. 2022, MNRAS, 517, 858, doi: 10.1093/mnras/stac2717
- Jedrzejewski (1987) Jedrzejewski, R. I. 1987, MNRAS, 226, 747, doi: 10.1093/mnras/226.4.747
- Jiang et al. (2019) Jiang, F., Dekel, A., Freundlich, J., et al. 2019, MNRAS, 487, 5272, doi: 10.1093/mnras/stz1499
- Johnson et al. (2021) Johnson, B. D., Leja, J., Conroy, C., & Speagle, J. S. 2021, ApJS, 254, 22, doi: 10.3847/1538-4365/abef67
- Jones et al. (2021) Jones, M. G., Bennet, P., Mutlu-Pakdil, B., et al. 2021, ApJ, 919, 72, doi: 10.3847/1538-4357/ac0975
- Jones et al. (2022) Jones, M. G., Karunakaran, A., Bennet, P., et al. 2022, arXiv e-prints, arXiv:2211.00651. https://arxiv.org/abs/2211.00651
- Jordán et al. (2005) Jordán, A., Côté, P., Blakeslee, J. P., et al. 2005, ApJ, 634, 1002, doi: 10.1086/497092
- Jordán et al. (2009) Jordán, A., Peng, E. W., Blakeslee, J. P., et al. 2009, ApJS, 180, 54, doi: 10.1088/0067-0049/180/1/54
- King (1966) King, I. R. 1966, AJ, 71, 64, doi: 10.1086/109857
- Kirby et al. (2014) Kirby, E. N., Bullock, J. S., Boylan-Kolchin, M., Kaplinghat, M., & Cohen, J. G. 2014, MNRAS, 439, 1015, doi: 10.1093/mnras/stu025
- Kirby et al. (2015) Kirby, E. N., Simon, J. D., & Cohen, J. G. 2015, ApJ, 810, 56, doi: 10.1088/0004-637X/810/1/56
- Kong et al. (2022) Kong, D., Kaplinghat, M., Yu, H.-B., Fraternali, F., & Mancera Piña, P. E. 2022, ApJ, 936, 166, doi: 10.3847/1538-4357/ac8875
- Lim et al. (2018) Lim, S., Peng, E. W., Côté, P., et al. 2018, ApJ, 862, 82, doi: 10.3847/1538-4357/aacb81
- Lim et al. (2017) Lim, S., Peng, E. W., Duc, P.-A., et al. 2017, ApJ, 835, 123, doi: 10.3847/1538-4357/835/2/123
- Lim et al. (2020) Lim, S., Côté, P., Peng, E. W., et al. 2020, ApJ, 899, 69, doi: 10.3847/1538-4357/aba433
- Martín-Navarro et al. (2019) Martín-Navarro, I., Romanowsky, A. J., Brodie, J. P., et al. 2019, MNRAS, 484, 3425, doi: 10.1093/mnras/stz252
- Martínez-Delgado et al. (2016) Martínez-Delgado, D., Läsker, R., Sharina, M., et al. 2016, AJ, 151, 96, doi: 10.3847/0004-6256/151/4/96
- Martizzi et al. (2020) Martizzi, D., Vogelsberger, M., Torrey, P., et al. 2020, MNRAS, 491, 5747, doi: 10.1093/mnras/stz3418
- McDermid et al. (2015) McDermid, R. M., Alatalo, K., Blitz, L., et al. 2015, MNRAS, 448, 3484, doi: 10.1093/mnras/stv105
- Mei et al. (2007) Mei, S., Blakeslee, J. P., Côté, P., et al. 2007, ApJ, 655, 144, doi: 10.1086/509598
- Mihos et al. (2017) Mihos, J. C., Harding, P., Feldmeier, J. J., et al. 2017, ApJ, 834, 16, doi: 10.3847/1538-4357/834/1/16
- Mihos et al. (2015) Mihos, J. C., Durrell, P. R., Ferrarese, L., et al. 2015, ApJ, 809, L21, doi: 10.1088/2041-8205/809/2/L21
- Mihos et al. (2022) Mihos, J. C., Durrell, P. R., Toloba, E., et al. 2022, ApJ, 924, 87, doi: 10.3847/1538-4357/ac35d9
- Moreno et al. (2022) Moreno, J., Danieli, S., Bullock, J. S., et al. 2022, Nature Astronomy, 6, 496, doi: 10.1038/s41550-021-01598-4
- Moster et al. (2013) Moster, B. P., Naab, T., & White, S. D. M. 2013, MNRAS, 428, 3121, doi: 10.1093/mnras/sts261
- Muñoz et al. (2014) Muñoz, R. P., Puzia, T. H., Lançon, A., et al. 2014, ApJS, 210, 4, doi: 10.1088/0067-0049/210/1/4
- Müller et al. (2020) Müller, O., Marleau, F. R., Duc, P.-A., et al. 2020, A&A, 640, A106, doi: 10.1051/0004-6361/202038351
- Müller et al. (2021) Müller, O., Durrell, P. R., Marleau, F. R., et al. 2021, ApJ, 923, 9, doi: 10.3847/1538-4357/ac2831
- Navarro et al. (1997) Navarro, J. F., Frenk, C. S., & White, S. D. M. 1997, ApJ, 490, 493, doi: 10.1086/304888
- Newman et al. (2013) Newman, J. A., Cooper, M. C., Davis, M., et al. 2013, ApJS, 208, 5, doi: 10.1088/0067-0049/208/1/5
- Peng et al. (2002) Peng, C. Y., Ho, L. C., Impey, C. D., & Rix, H.-W. 2002, AJ, 124, 266, doi: 10.1086/340952
- Peng & Lim (2016) Peng, E. W., & Lim, S. 2016, ApJ, 822, L31, doi: 10.3847/2041-8205/822/2/L31
- Peng et al. (2006) Peng, E. W., Jordán, A., Côté, P., et al. 2006, ApJ, 639, 95, doi: 10.1086/498210
- Planck Collaboration et al. (2020) Planck Collaboration, Aghanim, N., Akrami, Y., et al. 2020, A&A, 641, A6, doi: 10.1051/0004-6361/201833910
- Ramos-Almendares et al. (2020) Ramos-Almendares, F., Sales, L. V., Abadi, M. G., et al. 2020, MNRAS, 493, 5357, doi: 10.1093/mnras/staa551
- Robin et al. (2012) Robin, A. C., Luri, X., Reylé, C., et al. 2012, A&A, 543, A100, doi: 10.1051/0004-6361/201118646
- Román & Trujillo (2017a) Román, J., & Trujillo, I. 2017a, MNRAS, 468, 4039, doi: 10.1093/mnras/stx694
- Román & Trujillo (2017b) —. 2017b, MNRAS, 468, 703, doi: 10.1093/mnras/stx438
- Rong et al. (2017) Rong, Y., Guo, Q., Gao, L., et al. 2017, MNRAS, 470, 4231, doi: 10.1093/mnras/stx1440
- Safarzadeh & Scannapieco (2017) Safarzadeh, M., & Scannapieco, E. 2017, ApJ, 850, 99, doi: 10.3847/1538-4357/aa94c8
- Saifollahi et al. (2021) Saifollahi, T., Trujillo, I., Beasley, M. A., Peletier, R. F., & Knapen, J. H. 2021, MNRAS, 502, 5921, doi: 10.1093/mnras/staa3016
- Saifollahi et al. (2022) Saifollahi, T., Zaritsky, D., Trujillo, I., et al. 2022, MNRAS, 511, 4633, doi: 10.1093/mnras/stac328
- Sales et al. (2020) Sales, L. V., Navarro, J. F., Peñafiel, L., et al. 2020, MNRAS, 494, 1848, doi: 10.1093/mnras/staa854
- Sánchez-Blázquez et al. (2006) Sánchez-Blázquez, P., Peletier, R. F., Jiménez-Vicente, J., et al. 2006, MNRAS, 371, 703, doi: 10.1111/j.1365-2966.2006.10699.x
- Sérsic (1963) Sérsic, J. L. 1963, Boletin de la Asociacion Argentina de Astronomia La Plata Argentina, 6, 41
- Shen et al. (2021) Shen, Z., van Dokkum, P., & Danieli, S. 2021, ApJ, 909, 179, doi: 10.3847/1538-4357/abdd29
- Somalwar et al. (2020) Somalwar, J. J., Greene, J. E., Greco, J. P., et al. 2020, ApJ, 902, 45, doi: 10.3847/1538-4357/abb1b2
- Somerville & Davé (2015) Somerville, R. S., & Davé, R. 2015, ARA&A, 53, 51, doi: 10.1146/annurev-astro-082812-140951
- Toloba et al. (2014) Toloba, E., Guhathakurta, P., Peletier, R. F., et al. 2014, ApJS, 215, 17, doi: 10.1088/0067-0049/215/2/17
- Toloba et al. (2016) Toloba, E., Sand, D. J., Spekkens, K., et al. 2016, ApJ, 816, L5, doi: 10.3847/2041-8205/816/1/L5
- Toloba et al. (2018) Toloba, E., Lim, S., Peng, E., et al. 2018, ApJ, 856, L31, doi: 10.3847/2041-8213/aab603
- Tremmel et al. (2020) Tremmel, M., Wright, A. C., Brooks, A. M., et al. 2020, MNRAS, 497, 2786, doi: 10.1093/mnras/staa2015
- van Dokkum et al. (2016) van Dokkum, P., Abraham, R., Brodie, J., et al. 2016, ApJ, 828, L6, doi: 10.3847/2041-8205/828/1/L6
- van Dokkum et al. (2017) van Dokkum, P., Abraham, R., Romanowsky, A. J., et al. 2017, ApJ, 844, L11, doi: 10.3847/2041-8213/aa7ca2
- van Dokkum et al. (2018a) van Dokkum, P., Danieli, S., Cohen, Y., et al. 2018a, Nature, 555, 629, doi: 10.1038/nature25767
- van Dokkum et al. (2018b) van Dokkum, P., Cohen, Y., Danieli, S., et al. 2018b, Research Notes of the American Astronomical Society, 2, 54, doi: 10.3847/2515-5172/aacc6f
- van Dokkum et al. (2019) van Dokkum, P., Wasserman, A., Danieli, S., et al. 2019, ApJ, 880, 91, doi: 10.3847/1538-4357/ab2914
- van Dokkum et al. (2022) van Dokkum, P., Shen, Z., Romanowsky, A. J., et al. 2022, ApJ, 940, L9, doi: 10.3847/2041-8213/ac94d6
- van Dokkum et al. (2015) van Dokkum, P. G., Abraham, R., Merritt, A., et al. 2015, ApJ, 798, L45, doi: 10.1088/2041-8205/798/2/L45
- Vogelsberger et al. (2020) Vogelsberger, M., Marinacci, F., Torrey, P., & Puchwein, E. 2020, Nature Reviews Physics, 2, 42, doi: 10.1038/s42254-019-0127-2
- Wheeler et al. (2017) Wheeler, C., Pace, A. B., Bullock, J. S., et al. 2017, MNRAS, 465, 2420, doi: 10.1093/mnras/stw2583
- White & Rees (1978) White, S. D. M., & Rees, M. J. 1978, MNRAS, 183, 341, doi: 10.1093/mnras/183.3.341
- Wolf et al. (2010) Wolf, J., Martinez, G. D., Bullock, J. S., et al. 2010, MNRAS, 406, 1220, doi: 10.1111/j.1365-2966.2010.16753.x
- Wright et al. (2021) Wright, A. C., Tremmel, M., Brooks, A. M., et al. 2021, MNRAS, 502, 5370, doi: 10.1093/mnras/stab081
- Zaritsky et al. (2006) Zaritsky, D., Gonzalez, A. H., & Zabludoff, A. I. 2006, ApJ, 642, L37, doi: 10.1086/504352