Simulations of Glitches in Isolated Pulsars
Abstract
Many radio pulsars exhibit glitches wherein the star’s spin rate increases fractionally by . Glitches are ascribed to variable coupling between the neutron star crust and its superfluid interior. With the aim of distinguishing among different theoretical explanations for the glitch phenomenon, we study the response of a neutron star to two types of perturbations to the vortex array that exists in the superfluid interior: 1) thermal motion of vortices pinned to inner crust nuclei, initiated by sudden heating of the crust, (e.g., a starquake), and 2) mechanical motion of vortices, (e.g., from crust cracking by superfluid stresses). Both mechanisms produce acceptable fits to glitch observations in four pulsars, with the exception of the 1989 glitch in the Crab pulsar, which is best fit by the thermal excitation model. The two models make different predictions for the generation of internal heat and subsequent enhancement of surface emission. The mechanical glitch model predicts a negligible temperature increase. For a pure and highly-conductive crust, the thermal glitch model predicts a surface temperature increase of as much as 2%, occurring several weeks after the glitch. If the thermal conductivity of the crust is lowered by a high concentration of impurities, however, the surface temperature increases by 10% about a decade after a thermal glitch. A thermal glitch in an impure crust is consistent with the surface emission limits following the January 2000 glitch in the Vela pulsar. Future surface emission measurements coordinated with radio observations will constrain glitch mechanisms and the conductivity of the crust.
keywords:
stars: interiors — stars: neutron — stars: evolution — stars: rotation — superfluid — dense matter1 Introduction
Many pulsars exhibit glitches, sudden jumps in spin rate, superimposed on the gradual spin down due to electromagnetic torque (see, e.g., Lyne, Shemar & Smith 2000). Glitches involve fractional jumps in spin rate of to , with recovery to the pre-glitch spin-down rate occurring over days to months in most cases. Some pulsars show no obvious recovery, and continue to spin down faster than had the glitch not occurred. The 1989 glitch of the Crab pulsar () was partially time-resolved [Lyne, Smith & Pritchard 1992]. This glitch showed a quick rise on a timescale of hours with additional spin-up taking place over approximately one day. In contrast, the Vela “Christmas” glitch () observed in December of 1988 [McCulloch et al. 1990] showed much different behaviour. In this case the glitch was not time-resolved, and occurred in under two minutes. The January 2000 glitch in the Vela pulsar () was similar to the Christmas glitch [Dodson, McCulloch & Costa 2000]. A number of pulsars (the Crab in particular) exhibit permanent increases in spin-down rate after a glitch occurs, typically . In the Crab, these offsets produce much larger cumulative timing residuals than the glitches themselves. In addition to glitches, nearly all pulsars exhibit low level fluctuations in their spin rate, timing noise, believed to be of a different origin than glitches (see e.g., D’Alessandro et al. 1995).
Glitches are thought to represent variable coupling between the stellar crust and the superfluid interior. Two questions concerning the glitch phenomena are: 1) where in the star the coupling occurs, and, 2) how the coupling is triggered. The rotation of the neutron superfluid interior is governed by the dynamics of vortex lines; a spin jump of the crust would result from sudden motion of vortices away from the rotation axis. In the inner crust, vortices could pin to the lattice [Anderson & Itoh 1975, Alpar 1977, Alpar, Langer & Sauls 1984, Epstein & Baym 1988], allowing the superfluid to store angular momentum as the crust spins down under electromagnetic torque. As a velocity difference between the solid and the superfluid develops, vortices creep through the crust at a rate that is highly sensitive to temperature [Alpar 1977, Alpar, Cheng & Pines 1989, Link & Epstein 1991, Link, Epstein & Baym 1993, Chau & Cheng 1993a, Chau & Cheng 1993b]. Based on an idea by Greenstein (1979a,b), Link & Epstein [Link & Epstein 1996] have proposed a thermal glitch mechanism in which a temperature perturbation causes a large increase in the vortex creep rate; in consequence, the superfluid quickly loses angular momentum and delivers a spin-up torque to the crust. A candidate mechanism for providing the required heat is a starquake arising from relaxation of crustal strain as the star spins down. Starquakes could deposit as much as ergs of heat in the crust [Baym & Pines 1971, Cheng et al. 1992]. Ruderman [Ruderman 1991] has proposed a different model in which vortices strongly pinned to the inner crust lattice stress the crust to the point of fracture, resulting in outward motion of vortices with plates of matter to which they are pinned. In the core, pinning may occur between the vortices and flux tubes associated with the superconducting proton fluid [Chau, Cheng & Ding 1992], allowing the core superfluid, or a portion of it, to store angular momentum. Ruderman, Zhu & Chen (1998) have proposed a core-driven glitch mechanism in which the expanding vortex array of the core forces the magnetic flux into the highly-conductive crust, stressing it to fracture. In this model, crust cracking allows the core vortex array to suddenly expand outward, spinning down a portion of the core superfluid and spinning up the crust. Carter, Langlois & Sedrakian [Carter, Langlois & Sedrakian 2000] have suggested that centrifugal buoyancy forces are the origin of pressure gradients sufficient to crack the crust, allowing outward vortex motion. Other proposed glitch mechanisms include catastrophic unpinning of vortices in the crust [Cheng et al. 1988, Alpar & Pines 1993, Mochizuki & Izuyama 1995], and vortex motion at the crust-core boundary due to proton flux tube annihilation there [Sedrakian & Cordes 1999]. In any of these crust or core-driven glitch models, dissipation that accompanies outward vortex motion generates heat that might produce detectable emission as the heat arrives at the stellar surface.
Quantitative calculations are necessary to distinguish among different models for the glitch phenomenon. The thermal glitch model of Link & Epstein [Link & Epstein 1996] produced good qualitative fits to glitch observations in the Crab and Vela pulsars. This paper is an extension of that work with more realistic physical inputs and detailed modeling of the timing data. We include nonlinear thermal diffusion which has the effect of slowing the glitch spin-up. We also include the effects of superfluid heating due to differential rotation between the superfluid and the crust [Greenstein 1975, Harding, Guyer & Greenstein 1978, Alpar et al. 1987, Shibazaki & Lamb 1989, Van Riper 1991, Van Riper, Epstein & Miller 1991, Umeda et al. 1993, Van Riper, Link & Epstein 1995, Larson & Link 1999] and study the propagation of heat to the stellar surface. We consider two types of rearrangement of the superfluid vortices: 1) thermal excitation of vortices over their pinning barriers (a thermal glitch) and 2) mechanical motion of vortices (a mechanical glitch). The first case models the response to sudden heating of the crust, e.g., from a starquake. The second case models catastrophic unpinning events, vortex motion as a result of crust cracking due to superfluid stresses, or core-driven glitches involving vortex motion near the crust-core boundary. In addition to simulations of the rotational dynamics, we predict the characteristics of the emerging thermal wave which could, in some cases, be visible from the surface of the neutron star weeks to years after a glitch occurs.
This paper is organized as follows. In Section 2 we provide an overview of the physical setting and discuss the treatment of the coupled rotational and thermal dynamics we use in our simulations of pulsar glitches. In Section 3 we discuss the details of our numerical models. In Section 4 we present our simulations of the spin-up process and the emergence of the thermal wave at the stellar surface. We compare our simulations with spin observations of four pulsars and surface emission data following a recent glitch in the Vela pulsar. In Section 5 we conclude with discussion.
2 Input Physics
A neutron star consists of an atmosphere, an outer and inner crust, and the core. The inner crust begins at a density of g cm-3 and extends to approximately nuclear saturation density, g cm-3. In this region, a neutron-rich lattice coexists with a neutron superfluid, protons and relativistically degenerate electrons. The inner crust lattice dissolves near nuclear density [Lorenz, Ravenhall & Pethick 1993, Pethick, Ravenhall & Lorenz 1995]. Most of the mass of the core is expected to reside in superfluid neutrons and superconducting protons, with electrons and muons also present.
Glitch models that rely on the superfluid interior as an angular momentum reservoir require a metastability of the vortex state to sustain differential rotation between the solid and liquid components of the star. In the inner crust, the metastability could arise through the pinning of vortices to the lattice. The details of pinning are uncertain. The form of the vortex-nucleus interaction potential is not well known due, in part, to uncertainties in the nucleon-nucleon interactions and the structure of the vortex core. Preliminary calculations of the vortex-nucleus interaction gave energies of 1-10 MeV [Epstein & Baym 1988]. Pizzochero, Viverit & Broglia [Pizzochero, Viverit & Broglia 1997] refined these calculations and found interaction energies on the order of several MeV per nucleus near nuclear density. By studying tension effects on the orientation of a vortex line relative to crystal axes, Jones [Jones 1997, Jones 1998, Jones 1999] has argued that there can be significant cancellation of the pinning forces on a vortex line. The magnitude of the cancellation is determined by the extent to which a vortex line can bend to intersect pinning nuclei. Link & Cutler (2001) have studied pinning of a vortex with finite tension, and estimate an effective pinning force per nucleus of keV. Given the uncertain nature of vortex pinning, we take the effective pinning energy per nucleus to be a free parameter. Our simulations fit the spin data for effective pinning strengths of .
2.1 Rotational Dynamics
The total angular momentum of the star is that of the effective crust (the crust and all components strongly coupled to it) plus the angular momentum of the superfluid,
| (1) |
where is the moment of inertia of the effective crust, is the crust superfluid moment of inertia, is the total moment of inertia, is the angular velocity of the effective crust and is the angular velocity of the superfluid. The initial angular momentum of the star is . The star slows under an external torque, . In rotational equilibrium the effective crust and the superfluid would spin down at the same rate, . The stellar core is thought to couple to the crust on timescales of less than a minute [Alpar, Langer & Sauls 1984, Abney, Epstein & Olinto 1996]. We therefore take the effective crust to include the mass of the core plus the crust, and the superfluid to exist between neutron drip ( g cm-3) and nuclear density.
We assume a geometry in which the angular velocity of the superfluid and crust are aligned with the external torque, as this is the state of lowest rotational energy for given angular momentum. The rotation rate of the inner crust superfluid is determined by the arrangement of the vortex lines which thread it. The equation of motion for the superfluid is (see e.g., Alpar et al. 1981; Link, Epstein & Baym 1993),
| (2) |
where is the distance from the rotation axis and is the radial component of the average vortex velocity. If vortex pinning is relatively effective, as we assume, vortices can move slowly with respect to the rotation axis through thermal excitations or quantum tunnelling in a process of vortex creep.
The average velocity of vortex creep is determined by the vortex-nucleus interaction, the vortex core structure, the characteristic energy of excitations on a pinned vortex, and the velocity difference between a pinned vortex and the superfluid flowing past it. Link & Epstein [Link & Epstein 1991] and Link, Epstein & Baym [Link, Epstein & Baym 1993] account for quantum effects and the vortex self-energy and obtain a creep velocity of the general form (see eq. [6.9], Link, Epstein & Baym 1993),
| (3) |
where is the activation energy for a pinned vortex segment to unpin. The effective temperature is , where is the thermodynamic temperature and is the crossover temperature which determines the transition from vortex motion through thermal activation to that by quantum tunnelling [Link, Epstein & Baym 1993]. The crossover temperature depends on the ground-state excitation energy of a pinned vortex. In our simulations the stellar temperatures are much greater than the crossover temperature, so that thermal activation (classical creep) is the dominant creep mechanism. In this limit reduces to the temperature . The multiplicative factor is comparable to the radial component of the velocity of an unpinned vortex line; we take its value to be [Link & Epstein 1991, Epstein & Baym 1992, Link, Epstein & Baym 1993].
The mechanics and energetics of unpinning are affected by the vortex self energy, or tension, . For a vortex line with a sinusoidal perturbation of wavenumber , the tension takes the form (Fetter 1967; see [Appendix A], Link & Epstein 1991),
| (4) |
where and is the vortex coherence length. The circulation associated with each vortex line is , where is the mass of a neutron and is Planck’s constant. Typically in the inner crust [Link & Epstein 1991]. The relative importance of tension is determined by the value of the stiffness parameter , where is the maximum attractive force between a nucleus and a vortex, is the range of the pinning potential, and is the internuclear spacing [Link & Epstein 1991]. We take , where is the effective pinning energy per nucleus. In terms of fiducial values the stiffness is,
| (5) |
Let the angular velocity lag between the superfluid and the crust be . The critical angular velocity difference above which the Magnus force prevents vortex pinning is . The number of pinning sites involved in an unpinning event is determined by the value of . When , many pinning bonds must be broken for a vortex segment to unpin. Exact expressions for the activation energy in this limit can be found in Link & Epstein (1991). In the limiting cases of and , is (eqs. [B.12] and [5.1], Link & Epstein 1991),
| (6) |
In our simulations, we use the exact expressions for given in Link & Epstein [Link & Epstein 1991].
2.2 Thermal Dynamics
Changes in the local temperature affect the vortex creep rate and hence the rotation rate of the star. A temperature enhancement generates a thermal wave which propagates through the star according to the thermal diffusion equation
| (7) |
Here is the specific heat and is the thermal conductivity, both of which depend on density and temperature. The internal heating rate from friction between the superfluid and crust is and is the cooling rate through neutrino emission. The heating rate due to superfluid friction [Alpar et al. 1984, Shibazaki & Lamb 1989, Umeda et al. 1993, Van Riper, Link & Epstein 1995] is,
| (8) |
Relevant cooling mechanisms include neutrino cooling via the modified URCA process, neutron-neutron and neutron-proton bremsstrahlung in the core [Friman & Maxwell 1979], and electron bremsstrahlung [Itoh et al. 1984] in the crust. The neutrino cooling rates are:
| (9) |
| (10) |
| (11) |
| (12) |
where is the ratio of the effective mass to the bare mass of the neutron, and similarly for the proton. We take in our calculations [Bäckman, Källman & Sjöberg 1973]. Our values for (the ion mass number) and (the ion proton number) are from Lattimer et al. [Lattimer et al. 1985], and is the internal temperature in units of K.
We take the surface of the star to cool through blackbody radiation,
| (13) |
where and are the radius and surface temperature seen by a distant observer. These quantities are related to their values at the surface through the redshift as
| (14) |
The specific heat of the star is due predominantly to degenerate electrons [Glen & Sutherland 1980] with significant contributions from the ions at lower densities (Van Riper 1991; see Chong & Cheng 1994 for corrections). The thermal conductivity is a function of density and temperature. We use the results of Itoh et al. [Itoh et al. 1983, Itoh et al. 1984] and Mitake, Ichimaru & Itoh [Mitake, Ichimaru & Itoh 1984] for a pure crust.
Impurities may arise in the crust as a result of the cooling history of the star. Early in the star’s thermal evolution ( K) lattice crystallization is expected to occur more quickly than beta equilibration processes [Flowers & Ruderman 1977, Jones 1999]. Consequently, nuclei with different nuclear charge (impurities) from the dominant nuclei are likely to be formed. The concentration of impurities lowers the mean-free-path of the electrons, reducing the thermal conductivity in the crust. The electron-impurity thermal conductivity is (see e.g. Ziman 1972, eq. 7.92),
| (15) |
where is the density of electrons, is the effective mass of the electron, is the Boltzmann constant, and is the electron-impurity relaxation time. For a high concentration of impurities, the impurity relaxation time can be approximated by the electron-ion relaxation time [Yakovlev & Urpin 1980].
| (16) |
where and are the momentum and velocity of an electron at the Fermi surface and . The ion density is and is the lattice order parameter. To obtain a lower limit on the thermal conductivity for an impure crust we calculate the conductivity due to electron-ion scattering, treating the ions as if they were liquified (see discussion in Brown 2000). We obtain the liquid-state thermal conductivity numerically, using the results of Itoh et al. (1983) and Mitake et al. (1984). We also use the liquid-state neutrino emissivity [Haensel, Kaminker & Yakovlev 1996] in this case.
3 Models
We consider the transfer of angular momentum from the superfluid to the crust through two mechanisms: 1) a deposition of thermal energy which liberates pinned vortex lines from their pinning barriers (a thermal glitch) and 2) mechanical motion of vortices (a mechanical glitch). The first case would arise from the heat deposition associated with a starquake. The second case applies if crust cracking occurs through direct vortex forces as a result of strong pinning [Ruderman 1991], or through magnetic stresses arising from the forcing of the field through the crust by core vortices [Ruderman, Zhu & Chen 1998]. Mechanism 2 would also describe a catastrophic unpinning event [Cheng et al. 1988, Alpar & Pines 1993, Mochizuki & Izuyama 1995]. In both models, the vortices are allowed to creep as described in Section 2.1. We initiate vortex motion in both models at a density of g cm-3, representative of the densest regions of the inner crust, where the contribution to the moment of inertia of pinned superfluid is largest. Since this density is near nuclear density, where the lattice is expected to dissolve, our treatment also models core-driven glitches when the vortex motion occurs near the crust-core boundary [Ruderman, Zhu & Chen 1998].
Sudden vortex motion generates heat. For a glitch which conserves angular momentum, the heating associated with the vortex motion is determined by the change in rotational energy. Angular momentum conservation gives
| (17) |
The heat liberated is
| (18) |
Here ) is the angular velocity lag before the glitch, and is the change in the superfluid angular velocity due to vortex motion.
If vortices unpin in a mechanical glitch, vortex drag will limit the spin-up timescale to 100 rotation periods [Epstein & Baym 1992] or minute in the slowest rotating pulsar that we consider. If vortex motion occurs through motion of crust material with little unpinning of vortices, the spin-up timescale is approximately the distance the vortices move divided by the transverse sound speed in the crust, s, a small fraction of a rotation period. Since these timescales are shorter than any time-resolved glitch observations, we approximate the spin-up in a mechanical glitch as an infinitely fast transfer of angular momentum from the superfluid to the crust. This produces a step-like initial increase in the spin rate of the crust.
3.1 Geometry
A complete treatment of the thermal and rotational dynamics described above would require a multi-dimensional analysis. The energy deposition due to a starquake could occur in a localized region [Link, Franco & Epstein 1998, Franco, Link & Epstein 2000]; the subsequent thermal diffusion probably lacks any simple symmetry, making the vortex dynamics complicated. Moreover, the heat dissipated by a moving vortex depends on position along the line, further complicating the dynamics. These effects make the coupled thermal and rotational dynamics a difficult two or three-dimensional problem. We adopt a one-dimensional (radial) treatment as a first step in modeling thermal and rotational changes, as we now describe.
The vortices of the rotating superfluid would align themselves with the rotation axis of the solid if there were no pinning. The number of vortex lines present in the superfluid is
| (19) |
where is the spin period in seconds. A bundle of vortex lines has times the circulation and therefore times the tension of a single line (eq. 4) and effectively resists bending. Consequently, a bundle of vortices tends to remain straight and aligned with the rotation axis even when forces vary along the bundle. We therefore treat the vortex array as infinitely stiff over the dimensions of the crust and average the vortex creep velocity along a vortex. In this approximation, the vortices are always aligned with the rotation axis of the crust. We take the vortex distribution to be axi-symmetric, and follow changes in the superfluid rotation rate as a function of the distance from the rotation axis.
We follow thermal changes in the star by solving the thermal diffusion equation (eq. 7) with spherical symmetry. Though a crude approximation, this treatment of the thermal evolution captures the essence of the dynamics while conserving energy. We account for the frictional heat generation, which has axi-symmetry, in the following way. The heat generated (eq. 8, supplemented by eq. 18 for a mechanical glitch) is integrated over each cylindrical shell in the inner crust. The total heat liberated is then divided by the volume of the inner crust and is included as a source term in the spherical treatment of the thermal diffusion. Because the heat is distributed with spherical symmetry throughout the crust, this approach underestimates the temperature increase in some parts of the star. We begin the stellar core at nuclear density and treat it as isothermal. The surface temperature is obtained by matching the surface temperature to the internal temperature using the prescription of Gudmundsson, Pethick & Epstein [Gudmundsson, Pethick & Epstein 1982] with equation 13 as a boundary condition on the heat flux.
4 Simulations
We model a neutron star using the equation of state of Friedman & Pandharipande [Friedman & Pandharipande 1981]. The stellar radius is 10.5 km and the central density is g cm-3. The moment of inertia of the effective crust (which includes the mass of the core plus the crust) is g cm2. To compare with observed glitches, we begin our simulations using values of the spin parameters () reported from observations. We take the temperature of the Crab pulsar to be approximately half its observed upper limit [Becker & Ashenbach 1995]. We choose Vela’s temperature in the middle of the observationally determined range [Seward et al. 2000]. For the older pulsars PSR 1822-09 and PSR 0355+54, we take temperatures consistent with standard cooling models which include superfluid effects [Van Riper 1991]. Temperatures and spin parameters for the pulsars in our study are listed in Table 1.
We solve for the initial lag ) numerically using equation 2 with the spin-down rate set equal to the observed value. After a glitch is initiated, we solve the thermal diffusion equation to update the internal temperature. The vortex creep velocity is then obtained using equation 3. Once the creep velocity is known, equation 2 is solved for the superfluid rotation rate as a function of location in the star. Equation 1 is used to obtain the angular velocity of the crust. With the angular velocities of the superfluid and the crust now known, the lag is updated as the difference between the two and the entire process is repeated. We evaluate the vortex stiffness at a density of . We choose a lattice spacing of = 50 fm which represents an average value for the inner crust (see Link & Epstein 1991; Link, Epstein & Baym 1993). We vary the pinning parameters and to obtain the best fit to the data, and take them to be constant throughout the crust. At each time step the internal temperature is updated using the thermal diffusion equation (eq. 7).
We initiate a thermal glitch with a spherically-symmetric deposition of heat centered on a density of . The shell has a gaussian distribution in radius with a full width of 40 meters. Density gradients in the inner crust are not significant over this length scale, so the deposition is isolated to a high density region. A thermal glitch occurs in two phases. A quick rise in the crust’s spin rate, resulting from the initial energy deposition, is followed by a slower rise as the thermal wave dissipates. The angular velocity lag is reduced as a result of the glitch, which in turn decreases the coupling between the superfluid and the crust. As a result, the external torque temporarily acts on a smaller moment of inertia and the star spins down at a greater rate than before the glitch. In older (presumably colder) stars, which have a lower specific heat, the energy deposition causes a larger increase in temperature which generates a faster glitch than the same energy deposition would in a younger star. Our results depend on the location of the energy deposition. Less energy is required when the deposition is at lower density to produce a similar spin response, holding all other parameters constant. A wider pulse requires more total energy to generate the same spin response.
We initiate a mechanical glitch with an axi-symmetric impulsive change in the superfluid angular velocity from its steady-state value centered on a density of . The shell has a gaussian distribution in radius with a full width of 40 meters. Sudden movement of the superfluid vortices generates heat, as described in Section 3 (see eq. 18). After the initial angular velocity change, we solve for the thermal and rotational response of the star. A mechanical glitch occurs as a step corresponding to the repositioning of vortex lines with respect to their steady state locations. Following the initial spin jump the superfluid relaxes and eventually the lag is recovered. The thermal pulse associated with a mechanical glitch is orders of magnitude smaller that that resulting from a thermal glitch. This difference occurs because the heat deposition required to mobilize pinned vortices in a thermal glitch is much larger than the heat generated by vortex motion in a mechanical glitch. A larger change in the superfluid angular velocity is required to produce the same spin response if the vortex motion occurs at lower density, holding all other parameters constant. If the change in superfluid velocity occurs through a wider shell, a smaller peak in the gaussian profile is needed to give the same spin response.
The parameters which best fit the data, along with the /dof, are listed in Tables 2 and 3 for the thermal and mechanical glitch models, respectively. For comparison, the /dof of the steady state observations is given (preglitch /dof) as a measure of the inherent scatter in the data. We report values for and , where is the energy deposited in a thermal glitch and is the angular velocity difference between the superfluid and the crust, averaged over the superfluid moment of inertia.
4.1 PSR 0531+21 (Crab Pulsar)
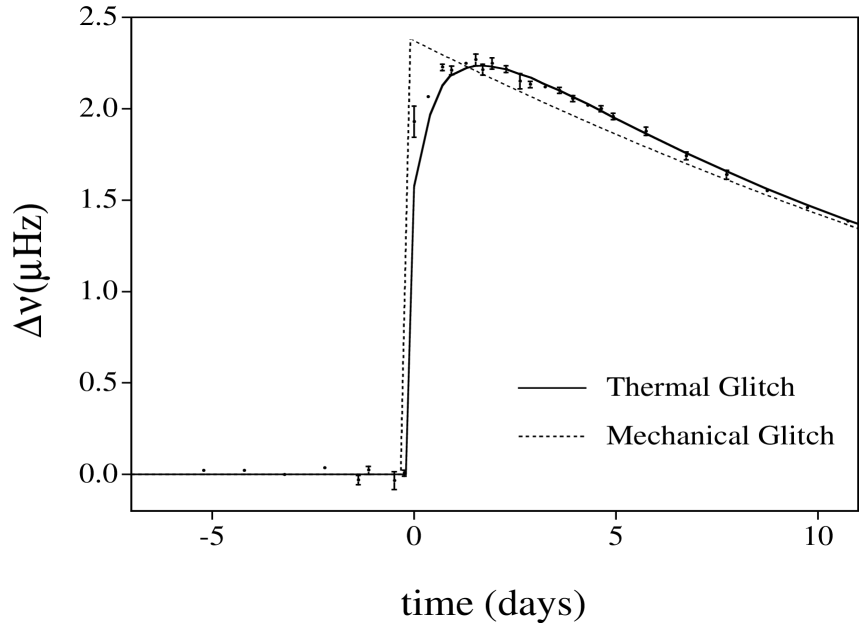
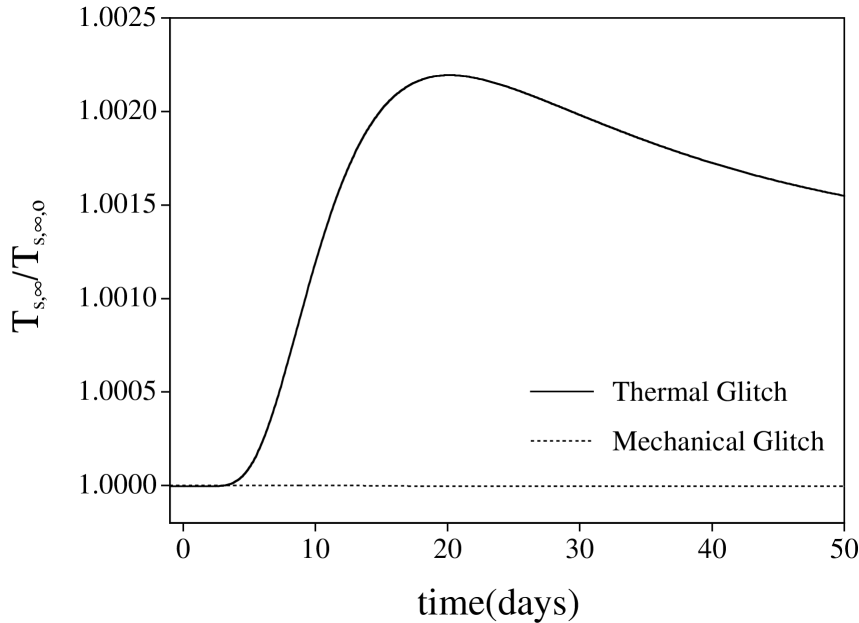
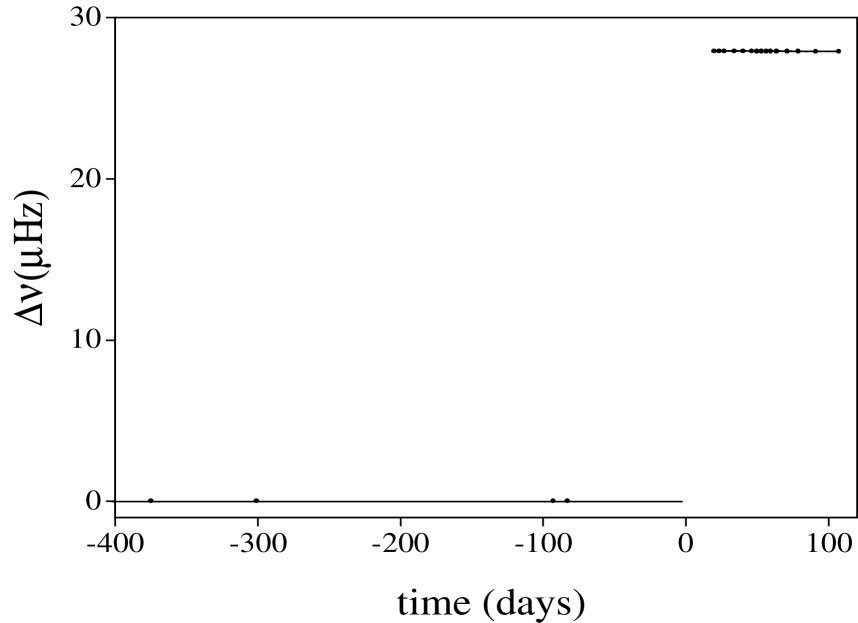
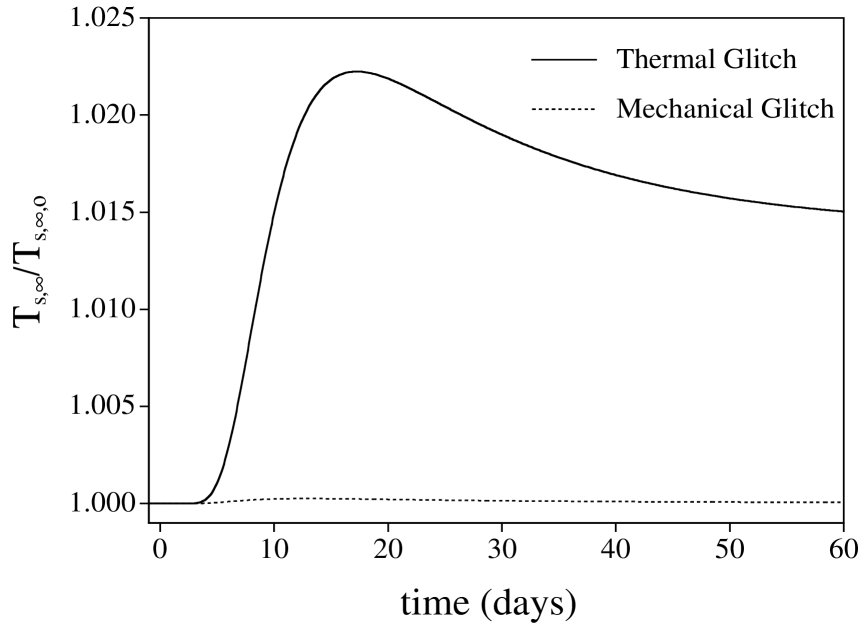
Simulations of the 1988 glitch in the Crab pulsar [Lyne, Smith & Pritchard 1992] are shown in Fig. 1. The glitch is best modeled by a thermal glitch with an energy deposition of ergs (solid line). The thermal pulse triggers transfer of angular momentum to the crust over a timescale of minutes. As the thermal pulse dissipates, the remaining spin-up occurs over approximately one day. The glitch has a fractional increase in rotation rate of . The mechanical glitch model is unable to simulate the gradual rise of the Crab observations. The quick spin up is followed by slow decay of the spin increase (Fig. 1, dashed line). The thermal pulse associated with the thermal glitch peaks at the stellar surface days after glitch onset and shows a maximum temperature increase of (Fig. 2, solid line). The surface temperature increase associated with the mechanical glitch is of negligible magnitude.
4.2 PSR 0833-45 (Vela Pulsar)
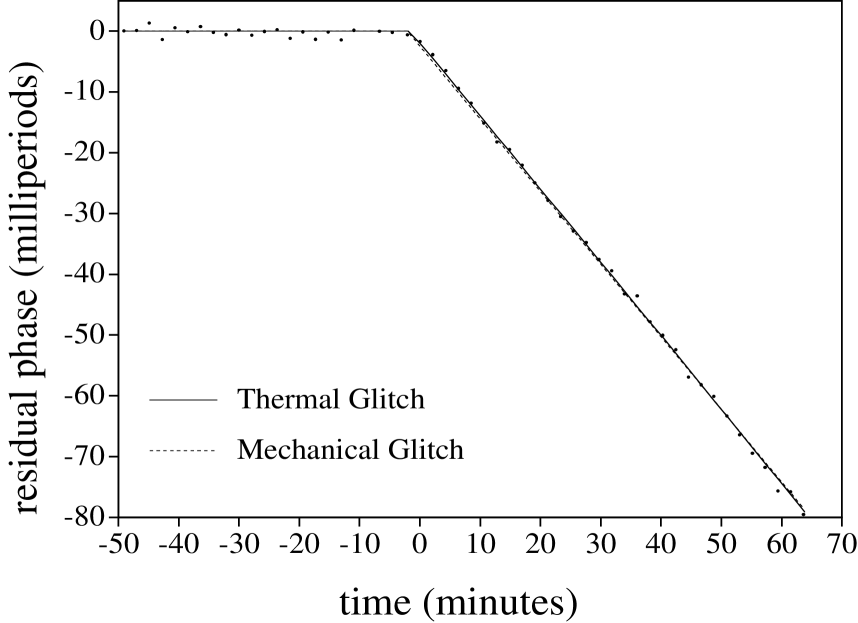
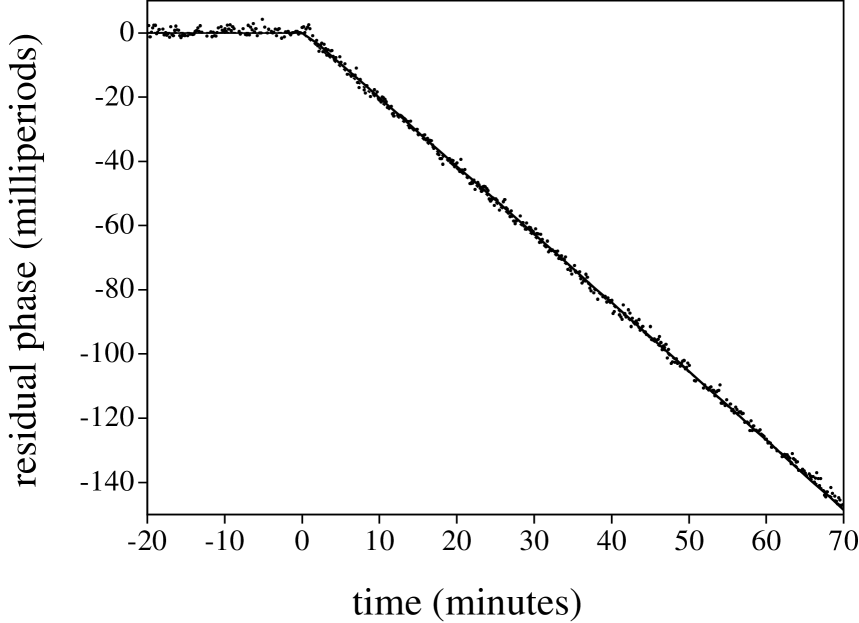
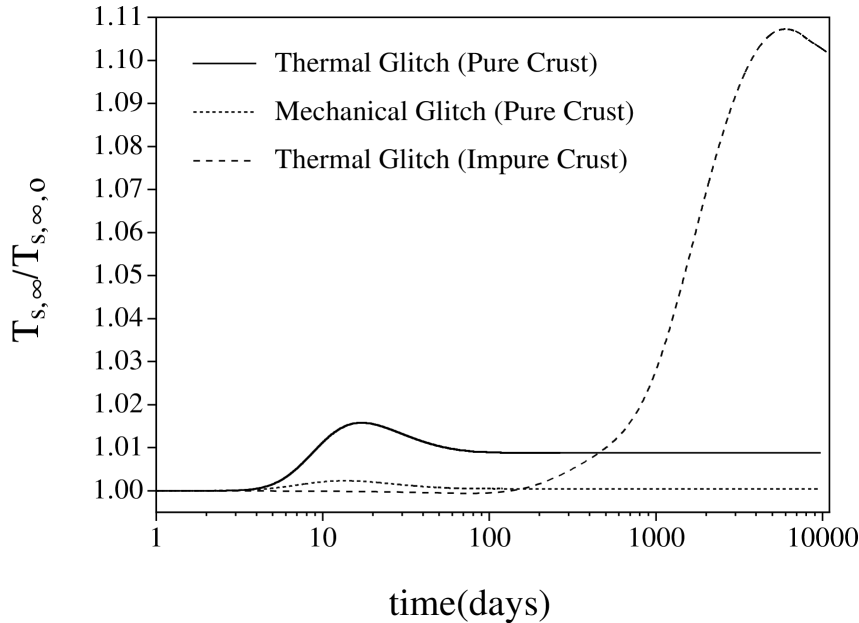
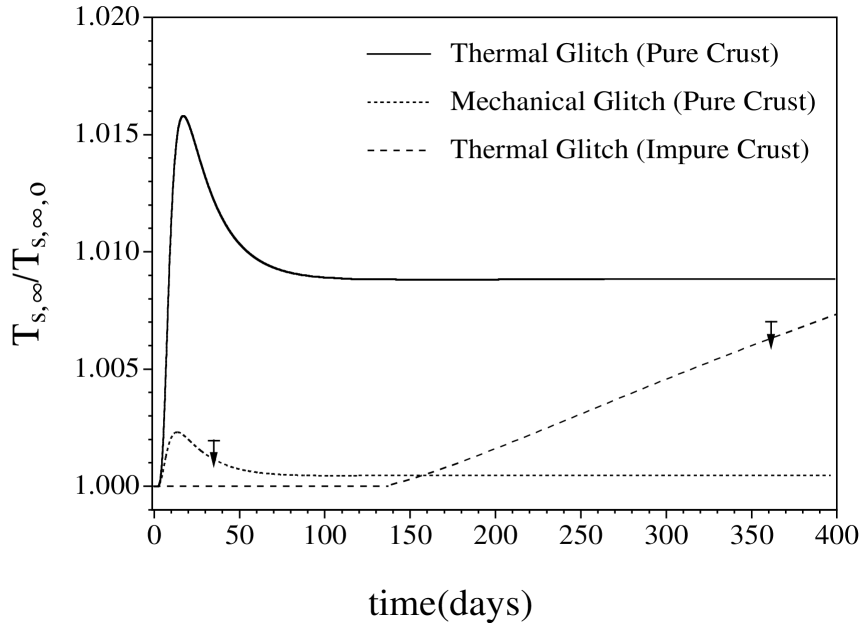
The 1989 “Christmas” glitch () in the Vela pulsar [McCulloch et al. 1990] is well modeled as either a thermal or mechanical glitch (Fig. 3); the simulations are virtually indistinguishable. The two models are also indistinguishable in the January 2000 glitch [Dodson, McCulloch & Costa 2000] in the Vela pulsar (Fig. 4). The thermal pulse which reaches the stellar surface differs significantly between the two mechanisms, with a thermal glitch generating a pulse approximately 2 orders of magnitude larger than that resulting from the mechanical glitch. In Figs. 5 and 6 we show the surface temperature increase following a thermal and mechanical glitch for the January 2000 glitch in Vela. CHANDRA observations of thermal emission from the surface following the glitch in the Vela pulsar on January 16, 2000 limit the temperature difference to 35 days after the glitch [Helfand, Gotthelf & Halpern 2000, Pavlov et al. 2000], and 361 days after the glitch (Pavlov, private communication). These upper limits are marked in Fig. 6. Lattice impurities in the stellar crust would delay the arrival of the thermal wave at the stellar surface. The low thermal conductivity of an impure crust also prevents the thermal wave from entering the core, resulting in a larger increase in the surface temperature. We find that for a highly impure crust, the thermal pulse from a thermal glitch peaks at the surface 16 years after the glitch, having a magnitude of 10% (Fig. 5). Lowering the thermal conductivity in this manner does not affect the spin-up because vortex motion occurs over a relatively quick timescale during the initial energy deposition. The upper limits marked in Fig. 6 are inconsistent with a thermal glitch in a pure crust but are consistent with a highly-impure crust. Our simulation of an impure crust gives an upper limit on the effects that impurities could have. A smaller impurity fraction would decrease the time at which the thermal pulse peaks at the surface.
4.3 PSR 1822-09
Shabanova [Shabanova 1998] observed an extremely small glitch, with a fractional change in spin rate of only , in PSR 1822-09 in September of 1994. The thermal glitch simulation in Fig. 7 (solid line) turns over slowly as the thermal wave propagates through the star, consistent with the findings of Link & Epstein [Link & Epstein 1996]. Although the mechanical glitch appears to the eye to be a better fit (Fig. 7, dashed line), both models are statistically consistent with the observations, having a /dof within the scatter of the data. The thermal pulse peaks at the surface of the star approximately 16 days after the onset of a thermal glitch (Fig. 8) and has a maximum value of only 0.075%. There is a negligible increase in the surface temperature following a mechanical glitch.
4.4 PSR 0355+54
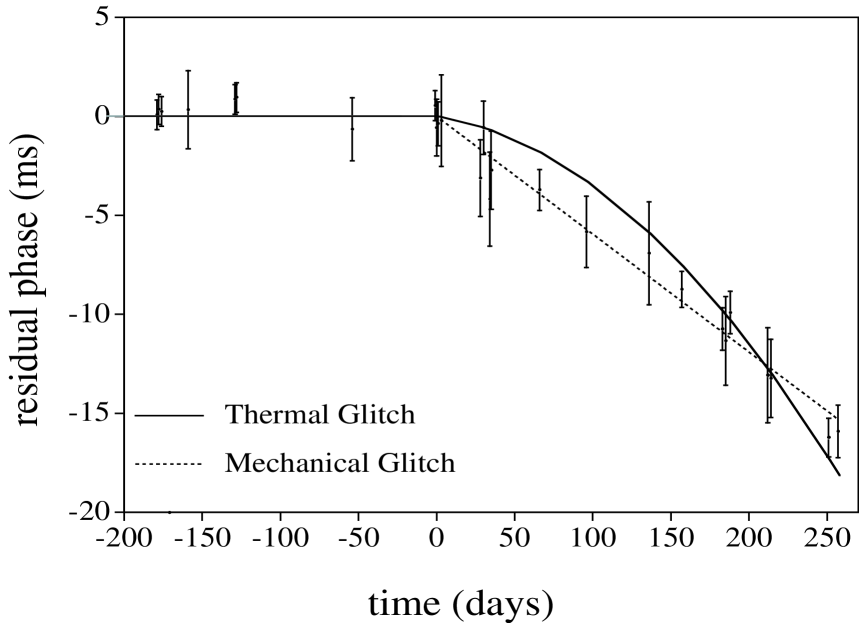
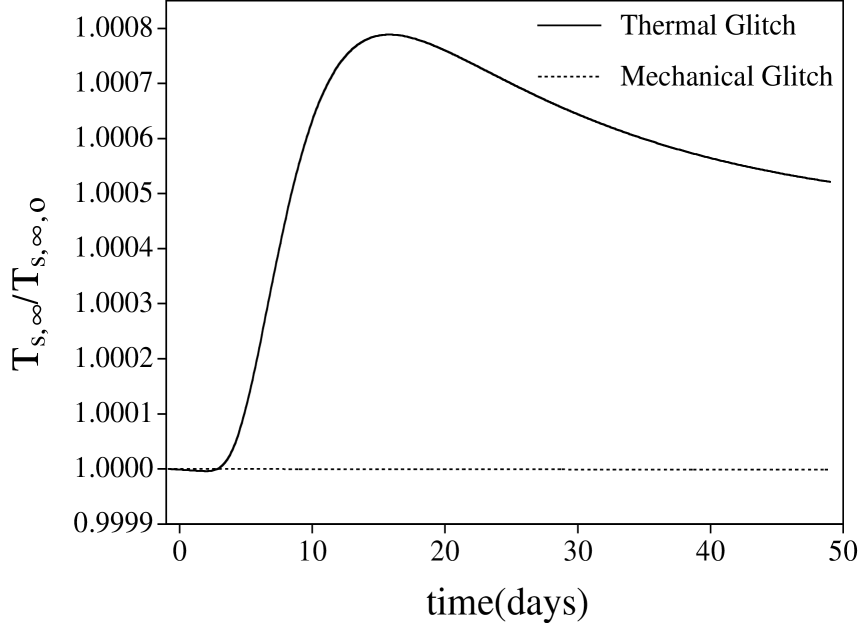
The largest glitch observed in any pulsar occurred in PSR 0355+54 in March 1986 with a glitch magnitude of [Shemar & Lyne 1996]. The glitch is well fit by either glitch model; the simulations are indistinguishable in Fig. 9. A thermal glitch generates a thermal pulse at the surface which peaks days after the glitch with a fractional temperature increase of (Fig. 10, solid line). A mechanical glitch generates a thermal pulse which peaks at a magnitude of , about 13 days after the initial spin up (Fig. 10, dashed line).
5 Discussion
This work has considered two different glitch scenarios involving the movement of superfluid vortex lines near nuclear density. The thermal glitch model of Link & Epstein [Link & Epstein 1996] is consistent with all glitches modeled in this study. The mechanical glitch model produces a spin jump that is too quick to explain the 1988 glitch in the Crab pulsar, but is consistent with glitch data in the other pulsars in our sample. However, plastic flow of the crust following a mechanical glitch, an effect we have not accounted for, might provide a slow component to the spin-up in this younger, and presumably hotter star.
At present, timing measurements of glitching pulsars are too sparse to distinguish between the predicted spin behavior of thermal and mechanical glitches in most cases. However, a distinguishing feature between these models is the size of the surface temperature pulse which accompanies the glitch. The larger temperature increase associated with a thermal glitch lowers the thermal conductivity, slowing the pulse as it travels through the crust as compared to a mechanical glitch. In general, a thermal glitch in a pure crust exhibits a thermal pulse at the stellar surface which is much larger, and occurs a few days later, than a mechanical glitch. Impurities in the stellar crust lower the thermal conductivity and could delay the surface pulse by years. A thermal glitch in an impure crust is consistent with surface emission limits following the January 2000 glitch in the Vela pulsar [Helfand, Gotthelf & Halpern 2000, Pavlov et al. 2000]. However, the temperature simulation curve for an impure crust is still rising at the time of the latest upper limit (see Fig. 6), and refinement of this upper limit, as well as additional measurements, may conflict with a thermal glitch in an impure crust as well. Future glitch observations coordinated with surface emission measurements will play a key role in distinguishing between these two models. Further work is needed to fully understand the effects of crust impurities on the emerging thermal wave.
Other time-resolved observations of slow spin-ups in young pulsars, similar to the Crab glitch of 1989, would support the thermal glitch model. A mechanical glitch does not occur slowly enough to explain such behaviour, but is a viable model for glitches which spin up the star quickly. However, detection of an early thermal wave of large amplitude could rule out the mechanical glitch model in a pure crust. It is possible that both thermal and mechanical mechanisms are at work in generating pulsar glitches.
For both models we obtain effective pinning energies in the range 10-500 keV. These values are less than calculated pinning energies per nucleus [Pizzochero, Viverit & Broglia 1997] and may indicate the presence of vortex tension effects which act to reduce the effective pinning energy (Jones 1997;1998;1999; Link & Cutler 2001). The relatively low values of we find for the Crab pulsar could indicate that glitches originate in a different pinning region for this object than in other pulsars. The values we obtain for the range of the pinning potential are consistent with existing estimates [Pizzochero, Viverit & Broglia 1997, Epstein & Baym 1988]. Larson & Link (1999) obtained constraints on the average angular velocity difference assuming that superfluid friction accounts for the unexpectedly high surface temperatures of some older pulsars. That work also provided upper limits on in younger pulsars, by requiring that young stars be stable against a thermal-rotational instability. For stars of the same age, our values of are in agreement with those results.
We thank K. Van Riper and K. Nomoto for providing subroutines to calculate the thermal conductivity and R.G. Dodson, A.G. Lyne, P.C. McCulloch, and T.V. Shabanova for providing pulsar glitch data. We thank G.G. Pavlov for providing surface emission data from Vela and for useful discussions. We also thank R.I. Epstein for valuable discussions. This work was supported in part by NASA EPSCoR Grant No. 291748 and NASA ATP No. NAG 53688. M.B.L thanks the Montana Space Grant Consortium for fellowship support during the time of this research.
References
- [Abney, Epstein & Olinto 1996] Abney M., Epstein R.I., Olinto A., 1996, ApJ, 466, L91
- [Alpar 1977] Alpar M.A., ApJ, 1977, 213, 527
- [Alpar & Pines 1993] Alpar M.A., Pines D., in Isolated Pulsars, ed. K.A. Van Riper, R.I. Epstein, & C. Ho (Cambridge Univ. Press), 18
- [Alpar, Cheng & Pines 1989] Alpar M.A.,Cheng K.S., Pines D., ApJ, 1989, 346, 823
- [Alpar, Langer & Sauls 1984] Alpar M.A., Langer S.A., Sauls J.A., 1984, ApJ, 282, 533
- [Alpar et al. 1981] Alpar M.A., Anderson P.W., Pines D., Shaham J., 1981, ApJ, 249, L29
- [Alpar et al. 1984] Alpar M.A., Anderson P.W., Pines D., Shaham J., 1984, ApJ, 276, 325
- [Alpar et al. 1987] Alpar M.A., Brinkmann W., Kızıloğlu Ü., Ögelman H.,1987, A&A, 177, 101
- [Anderson & Itoh 1975] Anderson P.W., Itoh N., 1975, Nature, 256, 25
- [Bäckman, Källman & Sjöberg 1973] Bäckman S.-O., Källman C.G. Sjöberg O., 1973, Phys. Letters, 43B, 263
- [Baykal 1997] Baykal A., 1997, A&A, 319,515
- [Baykal, Alpar & Kızıloğlu 1991] Baykal A., Alpar M.A., Kızıloğlu Ü., 1991, A&A, 252, 664
- [Baym & Pines 1971] Baym, G., Pines D., 1971, Ann. Phys. 66, 816
- [Becker & Ashenbach 1995] Becker W., Ashenbach B., 1995, in Lives of Neutron Stars, ed. M.A. Alpar, Ü. Kızıloğlu, J. van Paradijs (Dordrecht:Kluwer),47
- [Boynton 1981] Boynton P.E., 1981, IAU Symp. 95, Pulsars, ed. R. Wielebinski & W. Sieber (Dordrecht:Reidel), 279
- [Boynton et al. 1984] Boynton P.E., Deeter J.E., Lamb F.K., Zylstra G., Pravdo S.H., White N.E., Wood K.S., Yentis D.J., 1984, ApJ, 283, L53
- [Brown 2000] Brown E.F., 2000, ApJ, 531, 988
- [Carter, Langlois & Sedrakian 2000] Carter B., Langlois D., Sedrakian D.M., 2000, A&A, 361, 795
- [Chau & Cheng 1993a] Chau H.F., Cheng K.S., 1993a, in Isolated Pulsars, ed. K.A. Van Riper, R.I. Epstein, & C. Ho (Cambridge Univ. Press), 35
- [Chau & Cheng 1993b] Chau H.F., Cheng K.S., 1993b, Phys. Rev. B, 47, 2707
- [Chau, Cheng & Ding 1992] Chau H.F., Cheng K.S., Ding X.X., 1992, ApJ, 399, 213
- [Chau et al. 1993] Chau H.F., McCulloch P.M., Nandkumar R., Pines D., ApJ, 1993, ApJ, 413, L113
- [Cheng et al. 1992] Cheng K.S., Chau W.Y., Zhang J.L., Chau H.F., 1992, ApJ, 396, 135
- [Cheng et al. 1988] Cheng K.S., Pines D., Alpar M.A., Shaham J., 1988, ApJ, 330, 835
- [Chong & Cheng 1994] Chong N, Cheng K.S., 1994, ApJ, 425, 210
- [D’Alessandro et al. 1995] D’Alessandro F., McCulloch P.M., Hamilton P.A., Deshpande A.A., 1995, MNRAS, 277, 1033
- [Deeter 1981] Deeter J.E., 1981, Ph.D. thesis Univ. Washington
- [Dodson, McCulloch & Costa 2000] Dodson R.G., McCulloch P.M., Costa M.E. 2000, IAUC 7347
- [Epstein & Baym 1988] Epstein, R.I., Baym, G. 1988, ApJ 328, 680
- [Epstein & Baym 1992] Epstein, R.I., Baym, G. 1992, ApJ 387,276
- [Fetter 1967] Fetter, A.L., 1967, Phys. Rev., 162, 143
- [Flowers & Ruderman 1977] Flowers E.G., Ruderman M.A., 1977, ApJ, 215, 302
- [Franco, Link & Epstein 2000] Franco, L.M., Link B., Epstein R.I., 2000, ApJ, 543, 987
- [Friedman & Pandharipande 1981] Friedman, B.,Pandharipande, V.R., 1981, Nucl. Phys. A, 361, 502
- [Friman & Maxwell 1979] Friman B.L., Maxwell O.V., 1979, ApJ, 232, 541
- [Glen & Sutherland 1980] Glen G., Sutherland P., 1980, ApJ, 239, 671
- [Greenstein 1975] Greenstein G., 1975, ApJ, 200, 281
- [Greenstein 1979a] Greenstein G., 1979a, 231, 880
- [Greenstein 1979b] Greenstein G., 1979b, Nature, 277 ,521
- [Gudmundsson, Pethick & Epstein 1982] Gudmundsson E.,Pethick C., Epstein R.I. 1982, ApJ, 259, L19
- [Haensel, Kaminker & Yakovlev 1996] Haensel P., Kaminker A.D., Yakovlev D.G., 1996, A&A, 314, 328
- [Harding, Guyer & Greenstein 1978] Harding D., Guyer R.A., Greenstein G., 1978, ApJ, 222, 991
- [Helfand, Gotthelf & Halpern 2000] Helfand D.J., Gotthelf E.V., Halpern J.P., 2000, astro-ph 0007310
- [Itoh et al. 1983] Itoh N, Mitake S., Iyetomi H., Ichimaru S., 1983, ApJ, 273, 774
- [Itoh et al. 1984] Itoh N, Kohyama Y., Matsumoto N., Seki M., 1984, ApJ, 285, 758
- [Jones 1997] Jones P.B., 1997, Phys. Rev. Lett., 79, 792
- [Jones 1998] Jones P.B., 1998, MNRAS, 296, 217
- [Jones 1999] Jones P.B., 1999, MNRAS, 306,327
- [Larson & Link 1999] Larson M.B., Link B., 1999, ApJ, 521, 271
- [Lattimer et al. 1985] Lattimer J.M., Pethick C.J., Ravenhall D.G., Lamb D.Q., 1985, Nucl. Phys. A, 432, 646
- [Link & Cutler2001] Link B., Cutler, C., 2001, in preparation
- [Link & Epstein 1991] Link B., Epstein R.I., 1991, ApJ, 373, 592
- [Link & Epstein 1996] Link B., Epstein R.I., 1996, ApJ, 457, 844
- [Link, Epstein & Baym 1993] Link B., Epstein R.I., Baym, G.,1993, ApJ, 403,285
- [Link, Franco & Epstein 1998] Link B., Franco L.M., Epstein R.I., 1998, ApJ, 508, 838
- [Lorenz, Ravenhall & Pethick 1993] Lorenz C.P., Ravenhall D.G., Pethick C.J., 1993, Phys. Rev. Lett., 70, 379
- [Lyne, Smith & Pritchard 1992] Lyne A.G., Smith F.G., Pritchard R.S., 1992, Nature, 359, 706
- [Lyne, Shemar & Smith 2000] Lyne A.G., Shemar S.L., Smith F.G., 2000, MNRAS, 315, 534
- [McCulloch et al. 1990] McCulloch P.M., Hamilton P.A., McConnell D., King E.A., 1990, Nature, 346, 822
- [Mitake, Ichimaru & Itoh 1984] Mitake S., Ichimaru S., Itoh N., 1984, ApJ, 277, 375
- [Mochizuki & Izuyama 1995] Mochizuki Y., Izuyama T., ApJ, 440, 263
- [Pavlov et al. 2000] Pavlov G.G., Sanwal D., Garmire G.P., Zavlin V.E., Burwitz V., Dodson R., 2000, AAS Mtg. 196, 37.04
- [Pethick, Ravenhall & Lorenz 1995] Pethick C.J., Ravenhall D.G., Lorenz C.P., 1995, Nucl. Phys. A, 584, 675
- [Pines & Alpar 1985] Pines D., Alpar M.A., 1985, Nature, 316, 27
- [Pizzochero, Viverit & Broglia 1997] Pizzochero P.M., Viverit L., Broglia R.A., 1997, Phys. Rev. Lett., 79, 3347
- [Ruderman 1991] Ruderman M., 1991, ApJ, 366, 261
- [Ruderman, Zhu & Chen 1998] Ruderman M., Zhu T. Chen K., 1998, ApJ, 492, 267
- [Sedrakian & Cordes 1999] Sedrakian A., Cordes J.M., 1999, MNRAS, 307, 365
- [Seward et al. 2000] Seward F.D., Alpar M.A., Flanagan C., Kızıloğlu Ü., Markwardt C., McCulloch P., Ögelman H., 2000, ApJ, 536, 948
- [Shabanova 1998] Shabanova T.V., 1998, A&A, 337, 723
- [Shemar & Lyne 1996] Shemar S.L., Lyne A.G., 1996, MNRAS, 282, 677
- [Shibazaki & Lamb 1989] Shibazaki N., Lamb F.K., 1989, ApJ, 438, 288
- [Umeda et al. 1993] Umeda H., Shibazaki N., Nomoto K., Tsuruta S., 1993, ApJ, 408, 186
- [Van Riper 1991] Van Riper K.A., 1991, ApJ, 372, 251
- [Van Riper, Epstein & Miller 1991] Van Riper K.A., Epstein R.I., Miller G.S., 1991, ApJ, 381, L47
- [Van Riper, Link & Epstein 1995] Van Riper K.A., Link B., Epstein R.I., 1995, ApJ, 448, 294
- [Yakovlev & Urpin 1980] Yakovlev D.G., Urpin V.A., 1980, Soviet Astron., 24, 303
- [Ziman 1972] Ziman J.M., 1972, Principles of the Theory of Solids, 2nd ed., Cambridge: Cambridge Univ. Press
| Pulsar | |||||
|---|---|---|---|---|---|
| (yr) | (K) | (K) | |||
| 0531+21 | 189 | ||||
| 0833-45 | 70.4 | ||||
| 1822-09 | 8.2 | ||||
| 0355+54 | 40.2 |
| Pulsar | E | /dof | /dof | |||
|---|---|---|---|---|---|---|
| (keV) | (fm) | (ergs) | (preglitch) | |||
| 0531+21 | 18 | 0.08 | 1.2 | 10.5 | 11.2 | |
| 0833-45 (1989) | 470 | 0.62 | 8.7 | 0.55 | 0.55 | |
| 0833-45 (2000) | 554 | 0.78 | 8.1 | 2.1 | 1.6 | |
| 1822-09 | 610 | 1.24 | 5.6 | 1.2 | 1.0 | |
| 0355+54 | 62 | 0.08 | 8.0 | 15.0 | 19.8 |
| Pulsar | /dof | /dof | |||
|---|---|---|---|---|---|
| (keV) | (fm) | (preglitch) | |||
| 0531+21 | 19 | 0.09 | 1.1 | 52.3 | 11.2 |
| 0833-45 (1989) | 220 | 0.57 | 4.2 | 0.84 | 0.55 |
| 0833-45 (2000) | 418 | 1.1 | 4.2 | 1.87 | 1.6 |
| 1822-09 | 520 | 1.18 | 4.9 | 0.52 | 1.0 |
| 0355+54 | 100 | 0.19 | 6.1 | 11.1 | 19.8 |