Intrinsic and dust-induced polarization in gamma-ray burst afterglows: the case of GRB 021004 ††thanks: Based on observations made with ESO telescopes at the Paranal Observatory under programme Id 70.D-0111, on data from the ESO/ST-ECF Science Archive Facility and on observations made with the TNG under programme TAC 8_01(47).
Polarization measurements for the optical counterpart to GRB 021004 are presented and discussed. Our observations were performed with the TNG and the VLT–UT3 (Melipal) during the first and fourth night after the gamma-ray burst discovery. We find robust evidence of temporal evolution of the polarization, which is therefore, at least partially, intrinsic to the optical transient. We do not find convincing evidence of wavelength dependence for the intrinsic polarization of the transient, in agreement with current polarization models for optical afterglows. We discuss the role of dust, both in our galaxy and in the host, in modifying the transmitted polarization vector, showing how a sizable fraction of the observed polarized flux is due to Galactic selective extinction, while it is not possible to single out any clear contribution from dust in the host galaxy. We discuss how our data compare to those obtained by different groups showing that a two-component model is required to describe the complete dataset. This is not surprising given the complex lightcurve of GRB 021004.
Key Words.:
gamma rays: bursts – polarization – dust – radiation mechanisms: non-thermal1 Introduction
It is now well established that gamma-ray burst (GRB) optical afterglows (OA) can show some degree of linear polarization. To date, in five cases a positive detection was obtained: GRB 990510 (Covino et al. Co99 (1999); Wijers et al. WVG99 (1999)), GRB 990712 (Rol et al. Rol00 (2000)), GRB 020405 (Bersier et al. 2003a ; Covino et al. 2003a ; Masetti et al. Ma03 (2003)), GRB 020813 (Barth et al. Ba03 (2003); Covino et al. 2002a ), and GRB 030329 (Covino et al. Co03c (2003); Efimov et al. Ef03 (2003); Magalhães et al. MP03 (2003)). Usually, the polarized flux is not large, , but in most cases it has been possible to rule out that the observed polarization was induced111Here and in the following the only dust induced polarization that we consider is the one due to the dichroism of the aligned grains and not the polarization induced by scattering. by dust along the line of sight in our own Galaxy (e.g. Covino et al. Co99 (1999), 2003c ). More recently, it was also possible to exclude, at least for some cases, a major contribution to the observed polarization level due to the interposition of dust in the host galaxy. In fact, interstellar polarization is necessarily associated with reddening, and by modelling the spectral shape of the OA, the total amount of dust interposed on the line of sight can be constrained, allowing us to put limits on the dust-induced polarization.
This method is however model dependent, and relies also on the knowledge of the dust properties in the GRB environment (see e.g. Lazzati et al. 2002a ). Given the present uncertainties, the possibility that for at least some OA a sizable fraction of the observed polarization is induced by dust in the GRB environment or in the host galaxy cannot be excluded yet. In principle, there are at least two safe ways to unambiguously detect intrinsic polarization: the first is to perform multiple observations, looking for temporal variation of the polarization degree and/or position angle. Such a polarization variability would also provide a direct link between the dynamics of the fireball evolution and the geometry of the emitting region (Ghisellini & Lazzati GL99 (1999), hereafter GL99; Sari S99 (1999); Granot et al. GP02 (2002)). The second is to study the wavelength dependence of the polarization, possibly extending it to the infrared, in an attempt to exclude that it follows the “Serkowski curve” typical of Milky Way (MW) interstellar dust polarization (Serkowski et al. SMF75 (1975)), bearing in mind, however, that the OA emission could be intrinsically polarized in a wavelength dependent way.
Recently, some steps in this direction were performed. First, for GRB 020813 secure polarization variability was detected, the degree of polarization decreasing on a day time scale from (Barth et al. Ba03 (2003)) to (Covino et al. 2002a ), at a fixed polarization angle. Moreover, again for GRB 020813 (Barth et al. Ba03 (2003)), and very recently for GRB 030329 (Covino et al. Co03c (2003)), spectropolarimetry could be performed; in both cases, small but significant wavelength dependence was found.
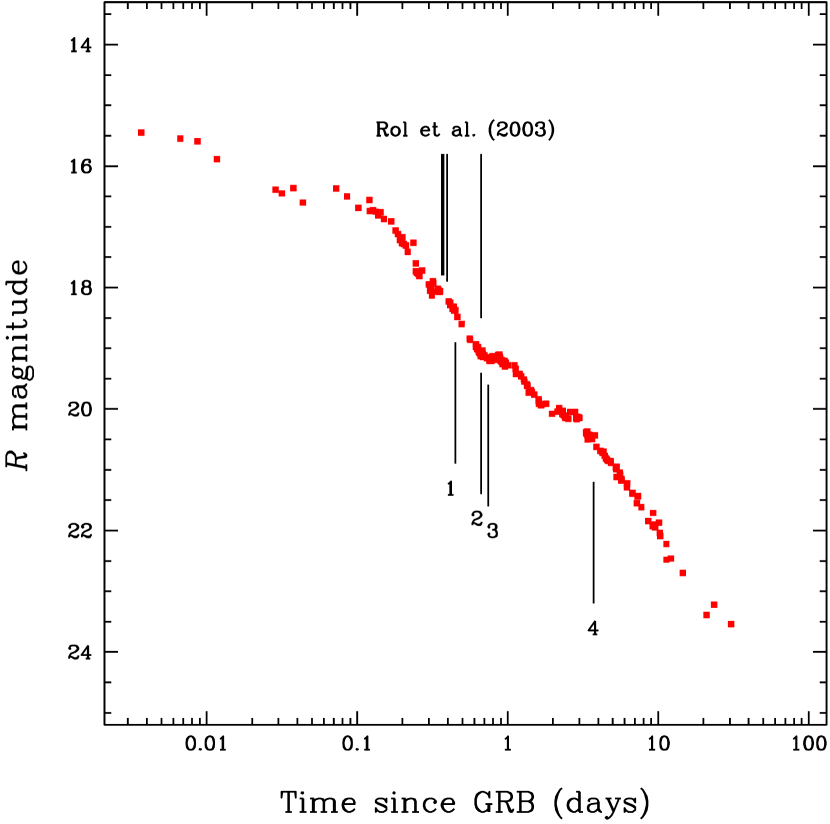
GRB 021004 was localized on 2002 October 4 at 12:06:14 UT by the HETE–II satellite (Shirasaki et al. SGM02 (2002)). In the FREGATE 8–40 keV and in the WXM 2–25 keV bands the burst had a duration of about 100 seconds. It thus belonged to the class of long-duration GRBs. The optical counterpart was identified less than 10 min after the burst (Fox Fo02 (2002)) as an fading object at the coordinates , . The early detection of the OA and its brightness allowed a dense sampling of the light curve (see e.g. Lazzati et al. 2002b and references therein), the identification of several absorption systems, and of a prominent emission feature in the optical spectra identified as a Ly emission line from the host galaxy at a redshift (Mirabal et al. MH02 (2002), MH03; Matheson et al. MG02 (2002); Møller et al. MF02 (2002); Schaefer et al. SG03 (2003)).
In the following we will discuss our three polarimetric observations of GRB 021004: one performed in the near infrared (NIR) with the Italian Telescopio Nazionale Galileo (TNG) at the Canary Islands, and two in the visible band at the VLT. Furthermore, we analyzed a publicly available spectropolarimetric dataset retrieved from the ESO VLT Science Archive. We will then compare these measurements, including the polarimetric observations performed by Rol et al. (Rol03 (2003)), with theoretical models.
2 Observations and analysis
Observations of GRB 021004 made use of two telescopes. First, the TNG, equipped with the Near Infrared Camera Spectrometer (NICS) and a filter, in the imaging polarimetry mode; second, the ESO VLT–UT3 (Melipal), equipped with the Focal Reducer/low dispersion Spectrometer (FORS 1) with a Bessel filter in the imaging polarimetry mode, and with the grism 300 V in the spectropolarimetry mode.
2.1 TNG observation
The TNG observation (hereafter run 1) started on October 4.915 (9.86 hours after the GRB trigger) and lasted for hours. The optical transient (OT) magnitude was derived by the acquisition frames as (hereafter 1- errors are reported). The observations were performed under mediocre seeing conditions () in the large field mode with a scale of pixel.
2.2 VLT observations
We analyzed three sets of polarimetric observations of GRB 021004 carried out by the ESO VLT–UT3 (Melipal).
First VLT observation
Our first VLT observation (here called run 2) started on October 5.080 (13.82 hours after the GRB trigger) and lasted for hours (see Fig. 1). The OT was clearly detected in the acquisition image with a magnitude with respect to the USNO–A2.0 star reported by Fox (Fo02 (2002)), as calibrated by Henden (2002a , 2002b ).
Second VLT observation
From the ESO archive we retrieved a public spectropolarimetric observation (run 3). It started on October 5.247 (17.83 hours after the GRB trigger) and lasted for hours. The spectrum covers the range from 350 nm to 860 nm and the observations were performed with the 300 V grism.
Third VLT observation
Eventually, a last VLT observation (run 4) was performed starting on October 8.225 (89.3 hours after the GRB trigger), and lasting for hours. The OT magnitude was with respect to the same USNO–A2.0 star.
All VLT observations were performed under good/excellent seeing conditions () in standard resolution mode with a scale of /pixel.
Polarimetric standard stars were also observed. One polarized, BD-125133, in order to fix the offset between the polarization and the instrumental angles, and three non-polarized, WD 0310–688, WD 1615–154, and BD+284211, to estimate the degree of spurious polarization possibly introduced by the instruments. In addition, we have also analyzed the ESO archive spectropolarimentric data for the NGC 2024 NIR1 polarization standard star, obtaining in all cases a good Serkowski curve completely consistent with the available data222http://www.eso.org/instruments/fors1/pola.html.
2.3 Data reduction and analysis
The data reduction was carried out with the Eclipse package (version 4.3.1; Devillard D97 (1997)). After bias subtraction, non-uniformities were corrected using flat-fields obtained without the Wollaston prism. For the IR data sky flat-fields were applied. The flux of each point source in the field of view was derived by means of aperture photometry by the Graphical Astronomy and Image Analysis (GAIA) tools333http://star-www.dur.ac.uk/pdraper/gaia/gaia.html (version 2.6-6).
The general procedure followed for the analysis of imaging polarimetry observations is indeed extensively discussed in Covino et al. (Co99 (1999), 2002b , 2003a ) and di Serego Alighieri (dS97 (1997)), while details about the NICS polarimetric capabilities are discussed by Oliva (O97 (1997)).
The VLT Spectra were extracted with the apall tool included in the IRAF package (version 2.11), which extracts the spectrum in a fixed-width window, allowing for a polynomial evolution of the centroid with wavelength. Suitable IDL routines were also developed to perform an independent extraction and check for any possible bias. In this case the extraction of the 1D spectrum from the 2D frame was performed by fitting a bell-shaped function to all the vertical stripes of the 2D spectrum, allowing for a first order variation of the background and for a 4th degree polynomial variation of the flux centroid and width of the fitting function. The result of this “fitted” extraction were not entirely consistent with those of a more standard sliding window, as discussed below.
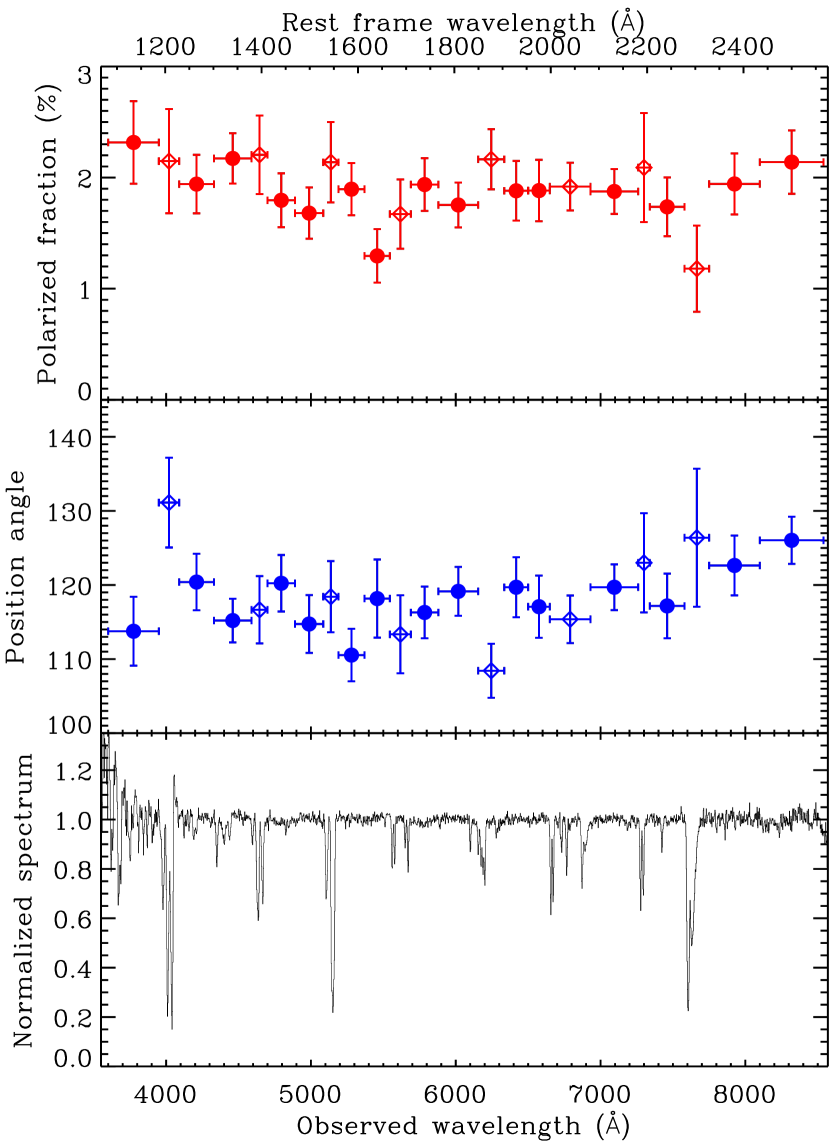
The results of the spectropolarimetric observations are shown in Fig. 2. To all our data we have applied a correction for the wavelength dependence of the half-wave plate axis as measured by the FORS team444http://www.eso.org/instruments/fors1/. The plot is based on the fitting extraction (hereinafter F) which, as anticipated, is not fully consistent with the more standard window extraction (hereinafter W). The F extraction shown in the figure yields a polarization which is consistent with being wavelength independent. A simultaneous constant fit to the polarization degree and angle returns and with (null probability ). The bin size has been made large enough to make the polarization bias (Wardle & Kronberg WK74 (1974)) unimportant. Completely consistent results are obtained with the W extraction if a small window (6 pixels width) is adopted, while a wider window (20 pixels) yields different results. The polarization obtained using the wide W extraction is wavelength dependent, the polarization decreasing from at 600 nm to at 800 nm. The resulting polarization also presents a significant dip at around 550 nm. In principle, both methods are prone to inadequacies in extracting the data, and it is not possible to decide a priori which is the best one. The fit and small W extraction are in fact sensitive to non centrally symmetric 2D spectra. The large window, instead, can yield an unbiased extraction of non-symmetric 2D spectra, but is subject to a varying background and to contribution from nearby sources. In an “Ockham razor” approach, we decided to show the result which requires less parameters to be explained, namely the constant one, warning however the reader that according to the large window extraction, the polarization may be wavelength dependent, being smaller in the red part of the spectrum.
From an independent analysis of the same data, Wang et al. (W03 (2003)) report a marginal evidence of increasing polarization at nm, across the rest-frame Ly absorption features. They interpret this as a consequence of absorption of the fireball emission by nearby high velocity clumps of HI atoms, with a covering factor smaller than, but comparable to, unity. As can be seen in the upper panel of Fig. 2, our binned data do not support this claim, and the same result is obtained with a binning of nm, comparable to the one adopted by Wang et al. (W03 (2003)). However we find that using smaller wavelength bins (e.g. 0.52 nm) the polarization, not corrected for the bias (Wardle & Kronberg WK74 (1974)), steadily increases from 400 nm down to the shortest available wavelength as expected for a low sensitivity region at the blue edge of the spectral range. Therefore this UV rise of the polarization looks consistent with a bias effect, although the possibility that some of it might be real cannot be completely excluded.
We stress that the difference between the various spectrum extraction methods discussed here are at the level. While being small, if not negligible, for a standard spectral analysis, these differences become significant when weak polarization levels are investigated.
| Run | Tel. | Filter | UT (10/02) | Magnitude | () | () | ||
|---|---|---|---|---|---|---|---|---|
| 1 | TNG | 4.953 | — | |||||
| 2 | VLT | 5.172 | ||||||
| 3 | VLT | 5.247 | — | |||||
| 4 | VLT | 8.225 |
2.4 Other observations
Rol et al. (Rol03 (2003)) obtained three independent measurements of the optical polarization of the afterglow of GRB 021004, three with the Nordic Optical Telescope, in the -band, and one with the VLT, in the -band. They obtain with position angle at d after the GRB, with position angle at d, at d and with position angle at d.
3 Results and modelling
3.1 Imaging polarimetry
The IR polarimetric observation (run 1) provided and Stokes parameters compatible with those derived for run 2 (see below and Tab. 1), even though the larger errors only allowed us to derive a upper limit ( confidence level). This limit is not particularly stringent compared to those derived in the optical for other afterglows (e.g. Hjorth et al. Hj99 (1999); Covino et al. 2002b ; Björnsson et al. Bj02 (2002); Covino et al. 2003d ). However, it is the first IR polarimetric observation that provides a useful constraint, since the previous upper limits were rather loose (; Klose et al. KSF01 (2001)).
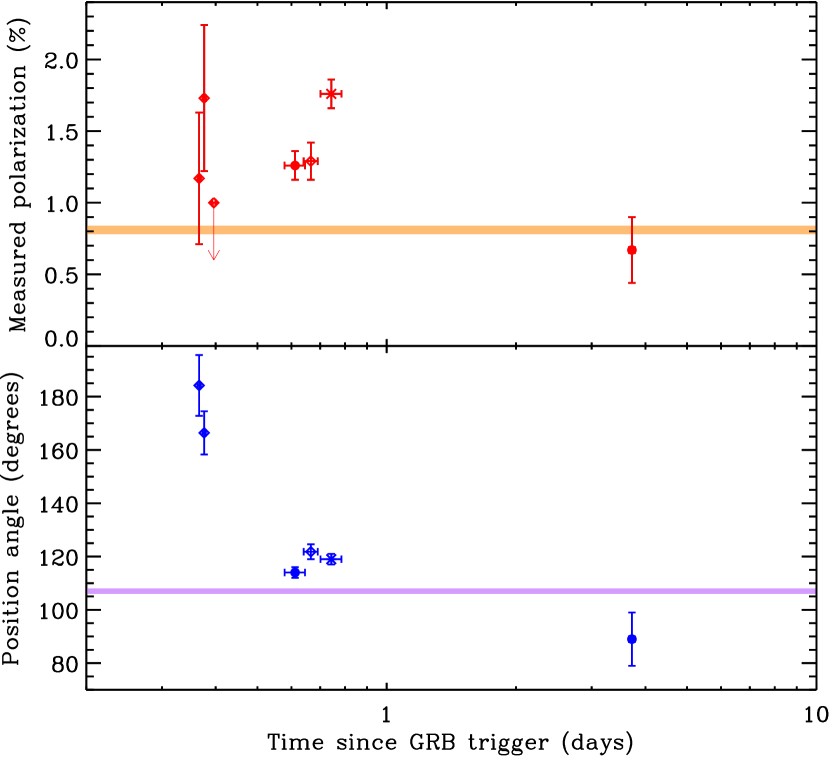
The results of VLT -band imaging polarimetry, as well as a synthetic -band measurement derived from the spectropolarimetric measurement, are plotted in Fig. 3 as a function of the time elapsed since the GRB trigger. We also report the value of polarization induced by the MW selective extinction, as derived by averaging the and parameters for several bright stars in the field. We obtain and . Such a polarization is slightly larger than the maximum interstellar (ISM) polarization according to the empirical law (Serkowski et al. SMF75 (1975)), given the reddening estimated for the GRB 021004 field (Schlegel et al. SFD98 (1998)). We note however that deviations from the above law are observed especially along low-reddening lines of sight (see Fig. 9 of Serkowski et al. SMF75 (1975)). An important conclusion that can be drawn from Fig. 3 is that neither the polarized fraction nor the position angle of the OT were constant during the evolution of the afterglow (Rol et al. Rol03 (2003)). We conclude that the relative contribution of the polarizing components, namely the MW ISM, the GRB host ISM, and the OT itself, did vary on short time scales. Since the ISM polarization cannot vary on short (day) time scales, we conclude that the OT was intrinsically polarized. The rotation of the polarization angle between the first measurements of Rol et al. (Rol03 (2003)) and our late-time datum is consistent with , a quantity predicted in the more commonly accepted models for the polarizations of GRB jets (GL99; Sari S99 (1999)). However, in contrast with the prediction, the transition between the two angles is not sharp, but rather smooth. This suggest the presence of an additional polarizing component, as we will discuss below.
3.2 Spectropolarimetry
We have shown in Fig. 2 the result of our reduction of the spectropolarimetric observation publicly available at ESO. Spectropolarimetric observations of OTs are important since they allow us, in principle, to single out which component is contributing more to the observed polarization: the OT itself, the host ISM, or the MW ISM. This is possible since the three components have different wavelength dependencies.
The OT polarization is supposed to be wavelength independent, at least in the limited spectral range investigated here. ISM polarization is instead wavelength dependent. It follows a “Serkowski law”:
| (1) |
where is the maximum induced polarization, obtained at . Experimentally, m, and this parameter is considered to be a measure of the size of the polarizing grains: the larger , the larger the grains. For the numerical value of the coefficient , we follow the more recent study of Martin et al. (MCW99 (1999)):
| (2) |
| Model | (∘) | (m) | ||
|---|---|---|---|---|
| OT† | — | |||
| MW ISM | ||||
| Host ISM |
To model the polarization results shown in Fig. 2, we have assumed first that the entire polarization is due to only one of the three possible components (i.e. OT, MW, host), taking into account the wavelength dependence of the ISM polarization as detailed above, and calculating the effect of the host-ISM in the host rest frame555The application of the Serkowski law to high-redshift systems is not directly supported by observations, given the intrinsic difficulty in performing spectropolarimetric studies of distant objects. It is however at least partly justified by the observation of interstellar polarization following a Serkowski curve in SN 1986G in Centaurus A, at (Hough et al. H87 (1987)).. As reported in Tab. 2, the quality of the data allows us to exclude a dominant role of the host ISM in producing the observed polarization, but it is not possible to identify a dominant component between MW-ISM and intrinsic. The first two fits are both acceptable (), with a slight preference for the OT model, while the host-ISM fit yields a significantly worst . Performing the fit only on the high quality dataset (filled symbols in Fig. 2) yields statistically indistinguishable results. However, since the field stars do show a moderate degree of polarization, we know that the observed polarization cannot be entirely due to the OT itself. Furthermore, at all frequencies the polarization position angle is very similar to that of the field stars in the imaging polarimetry (see above).
3.3 Combined modelling
Since the polarization levels are small and different effects seem to contribute at comparable degree, it is mandatory to perform a combined modelling of the imaging and spectral polarimetry, combining the effects of the OT polarization and of the MW ISM selective extinction. The need of at least two polarizing components is due to the presence a) of time variability of the measured polarization (OT component) and b) of significant polarization in the field stars (MW ISM component).
3.3.1 Transmission of variably polarized light in a polarizing ISM
In order to combine the effects of ISM selective extinction with the evolving intrinsic polarization of the OT, we adopt a Mueller calculus approach (see e.g. di Serego Alighieri dS97 (1997) and references therein). In this formalism, the transmitted Stokes vector is computed from the incident one through a matrix, called “Mueller matrix”, which incorporates all the properties of the transmitting medium: . Since developing a complete treatment of the polarizing properties of the ISM is far beyond the scope of this paper, here and in the following we adopt a simplified version of the Mueller matrix which is correct for a non-birefringent dichroic medium. With this simplification we assume that the ISM is not able to induce circular polarization to any incident light, either polarized or not. In fact, the ISM does induce a small degree of circular polarization even in unpolarized sources (Martin & Angel MA76 (1976)), which indicates that a non-coaxial birefringent and dichroic medium should be considered. However, the optical properties of such a medium are described by five parameters (extinction, orientation of the optical axes of birefringence and of dichroism and the two respective refraction indexes) while we can constrain only four parameters observationally (extinction, induced linear polarization, position angle and induced circular polarization). It is therefore not feasible to derive a complete Mueller matrix without going into a detailed modelling of the structure and geometry of dust grain and their alignment.
Consider a dichroic ISM that induces a polarization on unpolarized stars. Its Mueller matrix has then the form:
| (3) |
where , and is the opacity of the medium to non-polarized radiation. In order to conserve energy (i.e. not to have an increased transmitted intensity), this parameter must satisfy:
| (4) |
the equality holding for a perfect polarizing medium, i.e. one that does not absorb any radiation completely polarized with its same angle. It can also be easily shown that if and the matrix computation is equivalent to a simple sum of the incident and ISM normalized Stokes parameters: , . Formally, the Mueller matrix in Eq. 3 is not valid in the case of a birefringent medium. It can however be shown that it is a good approximation (deviations ) if the incoming light is moderately polarized (), the linear and circular interstellar polarizations are small ( and ; Martin & Angel MA76 (1976)) and the circular polarization induced on polarized sources is small ( for active galactic nuclei; Landstreet & Angel LA72 (1972)).
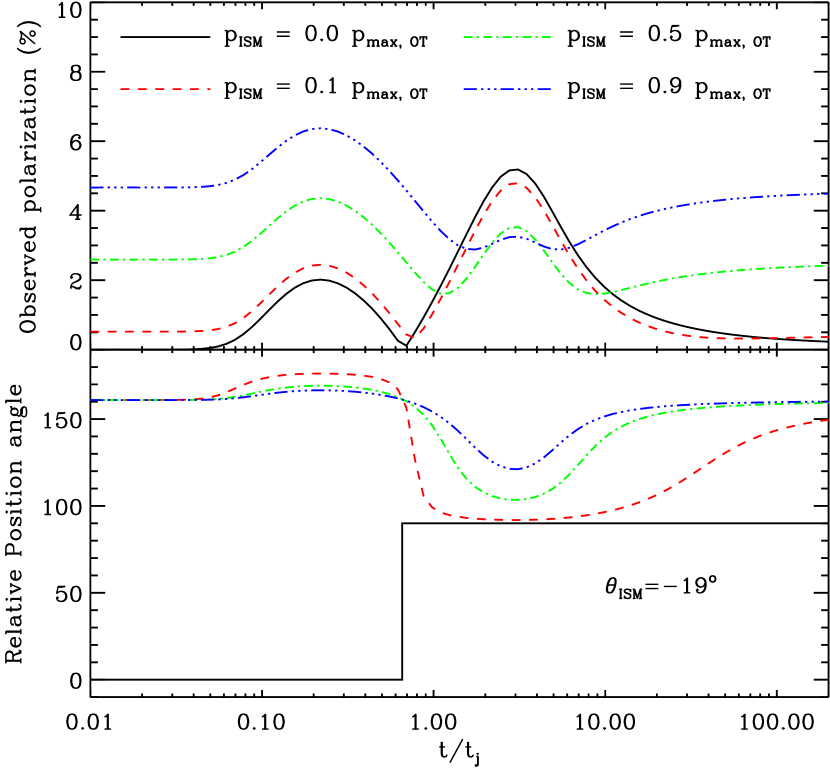
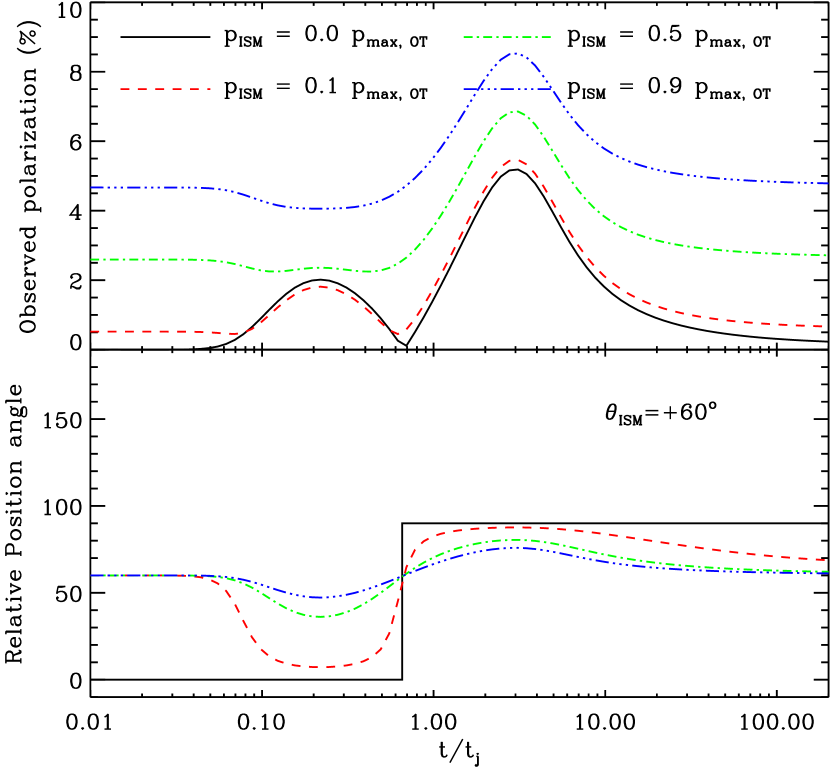
In order to exemplify the effect of a polarizing ISM on the intrinsic OT polarization, we adopt the polarization model by GL99. This model predicts a polarization curve characterised by two distinct peaks, whose absolute intensity depend on the angle between the line of sight and the axis of the fireball (assumed to be collimated in a jet). The polarization position angle is rotated by 90 degrees at the time of null polarization between the two peaks. This model is illustrated by the solid lines in Fig. 4 (i.e. no ISM polarization). With different line-styles, this figure also shows how the predicted polarization degree and polarization angle change in time once modified by some intervening polarizing ISM. All angles are reported relative to the initial OT polarization angle. In the left panel the case relative to this burst is shown (; see below), while in the right panel a larger misalignment between the OT and ISM angles is shown. The figure shows that the presence of the ISM modifies quite substantially the observed polarization, especially at times when . Note also that the presence of the polarizing ISM makes the position angle to vary smoothly, instead of sharply.
3.3.2 Modelling of the polarization curve
To model the time-resolved polarization measurements in the framework of available models (GL99) with a polarizing ISM we perform a fit to the polarization curve propagating the intrinsic OT polarization through the MW ISM with the use of the Mueller matrix derived in Eq. 3. The model has 6 degrees of freedom: the initial position angle of the OT intrinsic polarization, the off-axis angle of the line of sight, the degree of alignment of the magnetic field, the jet break time and the ISM and parameters. The last three parameters can be constrained with the observations, but we let them free to vary here to check a posteriori the agreement of the derived values with the observations. In addition, we adopt models with and without sideways expansion of the jet (GL99; Sari S99 (1999); Rossi et al. 2003, in prep). A particularly important issue is to check whether the prediction of the models are consistent with the position angle rotation detected by Rol et al. (Rol03 (2003)). The fit is performed on the and parameters rather than on and due to their better statistical properties.
The result of the fit is that it is not possible to model the rotation of the position angle in the framework of the proposed models, not even with the addition of a polarizing ISM with free properties. In fact, the smallest that can be obtained is for 8 degrees of freedom (for a non sideways expanding jet). In addition, the fit formally yields a best break time d, in disagreement with the value inferred from the lightcurve modelling (Holland et al. H03 (2003)). Also, the best fit excludes the presence of a sizably polarizing ISM, in disagreement with the observation of polarization of the stars in the field of GRB 021004. This could be explained with a polarizing ISM in the host galaxy with properties opposite to those of our ISM. Such a possibility would however require an unacceptable fine tuning and is ruled out by the modelling of the spectropolarimetric observation (see § 3.2). The formal best fit model, re-converted in polarization and position angle, is shown in Fig. 5 with a solid line.
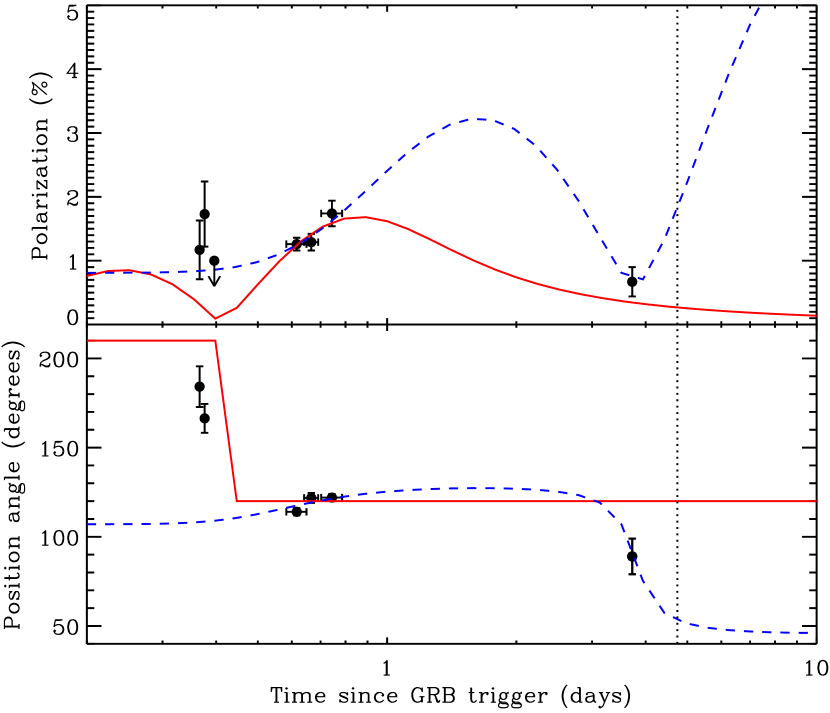
There is one important issue, however, that makes this result non conclusive. The models for polarization that we have used in the fit above are derived under the assumption that the fireball and the ISM are homogeneous. In this case, the total lightcurve should be characterised by a smooth broken power-law decay. This is not the case for GRB 021004. Its lightcurve, as shown in Fig. 1 (see also Lazzati et al. 2002b ), shows prominent bumps overlaid on this power-law. There are several possible explanations for these bumps: inhomogeneities in the ISM (Lazzati et al. 2002b ), inhomogeneities in the fireball (Nakar et al. N03 (2003)) or delayed injection of energy from the central engine (Fox et al. F03 (2003)). While in the latter hypothesis the polarization curve should not be affected, inhomogeneities, either in the fireball or in the ISM, can produce a polarization signal by breaking the symmetry of the fireball emission at early times (Granot & Königl 2003). Such polarization would have a randomly oriented position angle, depending on the azimuthal location of the inhomogeneity with respect to the line of sight. A similar effect is predicted in the case of micro-lensing events (Loeb & Perna LP98 (1998)). If we look more closely at Fig. 1, we note that the first three measurement of Rol et al. (Rol03 (2003)) lie on top of a major rebrightening, while the remaining four observations were performed in relatively unaffected time intervals. Only the last four measurements should therefore closely follow the theoretical model.
To check this idea, we have performed the same modelling described above only on the final four points, fixing the ISM polarizing properties to that of the stars in the field of GRB 021004 in order to limit the number of free parameters. Indeed, the last four points can be successfully described by the model, with a break time days, in good agreement with the d obtained by Holland et al. (H03 (2003)) from the break in the lightcurve. The best fit model, which has for 4 degrees of freedom, is shown with a dashed line in Fig. 5. The fit requires a large degree of alignment of the magnetic field of and a moderate off-axis line of sight . The best fit model is obtained for a non sideways expanding jet. A sideways expanding jet cannot however be rejected, with . This ambiguity is due to the fact that, according to the best fit model, the measured points lie in the first peak of the polarization curve, where the sideways expansion has only a marginal effect. The best fit model requires a misalignment of between the OT initial position angle and the ISM polarization. The effect of such a misalignment is shown in the left panel of Fig. 4.
3.4 Complications
Additional complications can be envisaged in locally reddened afterglows. If in fact a strong polarization is induced by dust in the close vicinity of the burst explosion site, two effects can take place. First, dust destruction by the burst prompt and afterglow emission (Waxman & Draine WD00 (2000); Perna & Lazzati PL02 (2002)) can imprint a strong temporal evolution in the host ISM polarization. This is however unlikely to be relevant for our observations, since the typical time scale for this process is of the order of minutes, rather than days. Second, a patchy absorber may obscure in a different way different portions of the fireball (e.g. Wang et al. W03 (2003)), altering one of the key assumptions of the models. None of these effects should alter dramatically the lightcurve, but a random noise could be overlaid on the smooth theoretical evolution of the polarization predicted by the models.
In addition, a preferential direction for the polarization, different from the one defined by the plane containing the jet axis and the line of sight, can be defined by the presence of an interstellar magnetic field of sufficient magnitude. Such a possibility has been recently studied by Granot & Königl (GK03 (2003)). Qualitatively, the effect of such a pre-existing field is not different from that of a polarizing ISM. Due to the presence of a second asymmetry, the evolution of the polarization angle is smooth rather than sharp, and the external component dominates the observed polarization properties when the intrinsic OT one is small. Such additional degrees of freedom were not necessary in our last fit (nor they can explain the early angle rotation). We stress however that, since all our data were observed before the jet break, we cannot exclude the presence of an ISM magnetic field with a well defined orientation.
4 Summary and conclusions
We have presented multi-time and multi-filter observations of the polarization of the afterglow of GRB 021004 performed with ESO–VLT and TNG as well as our analysis of the publicly available ESO–VLT spectropolarimetric observation. The interpretation of the observations is complex since none of the polarizing mechanisms that contribute to the observed polarization seems to clearly dominate over the others. We therefore adopt this afterglow as a case study to investigate and describe these three main effects: intrinsic (and time varying) OT polarization, host ISM polarization, and MW ISM polarization. By modelling the spectropolarimetric and time-resolved imaging polarimetry we were able to get rid of the contribution of the host ISM, while OT and MW ISM polarizations seem to play an intertwined role, one dominating over the other at different times.
To perform a detailed time dependent modelling of the polarization and position angle evolutions, we implemented our data-set with the four observations of Rol et al. (Rol03 (2003)). The complete dataset is particularly interesting since a sizable rotation of the position angle is present. Our attempt to fit the polarization data within the framework of GL99 models was however a failure, given the short timescale of the evolution and the lack of an appreciable break in the lightcurve at the time of the position angle evolution. Since the angle rotation is associated to one of the rebrightening events in the lightcurve, this burst is not suited for a comparison with models, which are computed for homogeneous fireballs producing featureless lightcurves. A possible explanation within exsisting models is that the early time polarization is dominated by a local enhancement of the fireball emission, which breaks the symmetry of the fireball producing a polarized signal. Indeed, the late time polarization data can be successfully and consistently described by the models. We therefore suggest that the lightcurve bumps are due to local events on the fireball surface, such as inhomogeneities in the ISM (Lazzati et al. 2002b ) or within the fireball itself (Nakar et al. N03 (2003)). Refreshed shocks (Fox et al. F03 (2003)) are instead unable to account for the combined lightcurve and polarization evolution and can be rejected.
The quality of the data, and in particular the lack of late time measurements) does not allow us to pin down the geometry and dynamic of the outflow, but we have shown that, with good quality spectropolarimetry and multi-time/multi-filter imaging polarimetry, it is in principle possible to disentangle the three effects and get a hold on the intrinsic polarization and on the structure and dynamics of GRB outflows. The added value of such a measurement would be the study of the polarizing properties of dust in high redshift galaxies, a poorly studied property of such an important component of high redshift objects.
Acknowledgements.
We thank the TNG and Paranal ESO staffs for the professional, kind and reliable support. We thank Evert Rol for providing its results in table form. This work was partly made using public data from the ESO VLT Science archive. The work of Scott Barthelmy in maintaining the GCN system is invaluable and greatly appreciated. DL acknowledges support from the PPARC postdoctoral fellowship PPA/P/S/2001/00268.References
- (1) Barth A.J., Sari R., Cohen M.H., et al. 2003, ApJ, 584, L47
- (2) Bersier D., McLeod B., Garnavich P., et al. 2003a, ApJ, 583, L63
- (3) Bersier D., Stanek K.Z., Winn J., et al. 2003b, ApJ, 584, L43
- (4) Björnsson G., Hjorth J., Pedersen K., & Fynbo J.P.U. 2002, ApJ, 579, L59
- (5) Covino S., Lazzati D., Ghisellini G., et al. 1999, A&A, 348, L1
- (6) Covino S., Malesani D., Ghisellini G., et al. 2002a, GCN 1498
- (7) Covino S., Lazzati D., Malesani D., et al. 2002b, A&A, 392, 865
- (8) Covino S., Malesani D., Ghisellini G., et al. 2003a, A&A, 400, L9
- (9) Covino S., Ghisellini G., Malesani D., et al. 2003b, GCN 2167
- (10) Covino S., Ghisellini G., Lazzati D., & Malesani D. 2003c, in “Gamma-Ray Bursts in the Afterglow Era”, Roma (Sept. 16–20), in press (astro-ph/0301608)
- (11) Covino S., Ghisellini G., Malesani D., et al. 2003d, GCN 1909
- (12) Devillard N. 1997, The Messenger, 87, 19
- (13) di Serego Alighieri S. 1997, in “Instrumentation for Large Telescopes”, eds. J.M. Rodriguez Espinosa, A. Herrero, F. Sanchez, Cambridge University Press, 287
- (14) Efimov Y., Antoniuk K., Rumyantsev V., & Pozanenko A. 2003, GCN 2144
- (15) Fox D.W. 2002, GCN 1564
- (16) Fox D.W., Yost S., Kulkarni S.R., et al. 2003, Nature, 422, 284
- (17) Ghisellini G., & Lazzati D. 1999, MNRAS, 309, L7 (GL99)
- (18) Granot J., Panaitescu A., Kumar P., & Woosley S.E. 2002, ApJ, 570, 61
- (19) Granot J., & Königl A., 2003, ApJ, 594, L83
- (20) Henden A. 2002a, GCN 1583
- (21) Henden A. 2002b, GCN 1630
- (22) Hjorth J., Bjornsson G., Andersen M.I., et al. 1999, Science, 283, 2073
- (23) Holland S.T., Weidinger M., Fynbo J.P.U., et al. 2003, AJ, 125, 2291
- (24) Hough J.H., Bailey J.A., Rouse M.F., Whittet D.C.B. 1987, MNRAS, 227, 1
- (25) Klose S., Stecklum B., & Fischer O. 2001, in “Gamma-Ray Burst in the Afterglow Era”, eds. E. Costa, F. Frontera, J. Hjorth. Berlin Heidelberg: Springer, 2001, 188
- (26) Lazzati D., Covino S., Ghisellini G. 2002a, MNRAS, 330, 583
- (27) Lazzati D., Rossi E., Covino S., Ghisellini G., & Malesani D. 2002b, A&A, 396, L5
- (28) Landstreet J.D., & Angel J.R.P. 1972, ApJ, 174, L127
- (29) Loeb A., & Perna R. 1998, ApJ, 495, 597
- (30) Magalhães A.M., Pereyra A., Dominici T., & Abraham Z. 2003, GCN 2163
- (31) Martin P.G., & Angel J.R.P. 1976, ApJ, 207, 126
- (32) Martin P.G., Clayton G.C., & Wolff M.J. 1999, ApJ, 510, 905
- (33) Masetti N., Palazzi E., Pian E., et al. 2003, A&A, 404, 465
- (34) Matheson T., Garnavich P.M., Foltz C., et al. 2002, ApJ, 582, L5
- (35) Mirabal N., Halpern J.P., Chornock R., & Filippenko A.V. 2002, GCN 1618
- (36) Møller P., Fynbo J.P.U., Hjorth J., et al. 2002, A&A, 396, L21
- (37) Nakar E., Piran T., & Granot J., 2003, New Ast., 8, 495
- (38) Oliva E. 1997, A&AS, 123, 589
- (39) Pandey S.B., Sahu D.K., Resmi L., et al. 2002, BASI submitted; astro-ph/0211108
- (40) Perna R., & Lazzati D. 2002, ApJ, 580, 261
- (41) Rol E., Wijers R.A.M.J., Vreeswijk P.M., et al. 2000, ApJ, 544, 707
- (42) Rol E., Wijers R.A.M.J., Fynbo J.P.U., et al. 2003, A&A, 405, L23
- (43) Sari R. 1999, ApJ, 524, L43
- (44) Schaefer B.E., Gerardy C.L., Höflich P., et al. 2003, ApJ, 588, 387
- (45) Schlegel D.J., Finkbeiner D.P., & Davis M. 1998, ApJ, 500, 525
- (46) Serkowski K., Mathewson D.L., & Ford V.L. 1975, ApJ, 196, 261
- (47) Shirasaki Y., Graziani C., Matsuoka M., et al. 2002, GCN 1565
- (48) Uemura M., Kato T., Ishioka R., & Yamaoka H. 2003, PASJ, 55, L31
- (49) Wang L., Baade D., Hoeflich P., & Wheeler J.C. 2003, ApJL submitted (astro-ph/0301266)
- (50) Wardle J.F.C., & Kronberg P.P. 1974, ApJ, 194, 249
- (51) Waxman E., & Draine B.T. 2000, ApJ, 537, 796
- (52) Wijers R.A.M.J., Vreeswijk P.M., Galama T.J., et al. 1999, ApJ, 523, L33