The Lyman Break Galaxies: Colors and Theoretical Predictions55affiliation: Based on observations taken with the NASA/ESA Hubble Space Telescope, which is operated by the Association of Universities for Research in Astronomy, Inc. (AURA) under NASA contract NAS5–26555 66affiliation: Based on observations collected at the European Southern Observatory, Chile (ESO Programmes 168.A-0485, 64.0-0643, 66.A-0572, 68.A-0544)
Abstract
We investigate several fundamental properties of Lyman-break galaxies by comparing observations with the predictions of a semi-analytic model based on the Cold Dark Matter theory of hierarchical structure formation. We use a sample of -dropouts from the Great Observatories Origins Deep Survey, and complement the ACS optical , , , and data with the VLT ISAAC , , and observations. We extract -dropouts from our semi-analytic mock catalog using the same color criteria and magnitude limits that were applied to the observed sample. We find that the colors of the model-derived and observed -dropouts are in good agreement. However, we find that the colors differ significantly, indicating perhaps that either too little dust or an incorrect extinction curve have been used. Motivated by the reasonably good agreement between the model and observed data we present predictions for the stellar masses, star formation rates, and ages for the Lyman-break sample. We find that according to our model the color selection criteria used to select our sample surveys of all galaxies at this epoch down to . We find that our model predicts a mass build-up between the and epochs for the UV rest-frame galaxies. Furthermore, according to our model, at least of the total stellar mass resides in relatively massive UV-faint objects that fall below our observational detection limit.
1 Introduction
The ”Lyman-break” color selection technique has been shown to be a highly effective means of selecting galaxies at high redshift (Steidel et al 1999; Madau et al. 1996). Fairly large samples of Lyman-break galaxies (LBGs) in the redshift range have been compiled, and the characteristics of these objects have been studied with much vigor over the past several years. Optical and NIR photometric colors have been used to ascertain various attributes of these high-redshift objects. For example, colors spanning the rest-frame Balmer break ( Å) have been used to constrain the range of possible stellar ages and masses of these galaxies through application of maximum-likelihood techniques to synthesized stellar population models (Papovich, Dickinson, & Ferguson 2001; Shapley et al. 2001).
As well, many researchers have compared theoretical models of galaxy evolution with various aspects of the observations (Wechsler et al. 2001; Baugh et al. 1998). Somerville, Primack, & Faber (2001, hereafter SPF2001) have used semi-analytic models to perform detailed comparative studies on the sample. In SPF2001 it was shown that the luminosity function and rest-frame UV and UV-optical colors of LBGs could be reproduced well by the models, implying that the ages and dust contents of the model galaxies were consistent with the observations.
In this letter, we compare the colors of observed -dropouts, selected from ACS imaging from the Great Observatories Origins Deep Survey (GOODS) and supplemented with deep NIR () data from ISAAC on the VLT, with the colors of model-derived -dropouts. We then present model predictions for physical properties of these objects, such as stellar masses, ages, and star formation rates. We also investigate selection effects on the stellar mass content for the redshift that we sample, and we look at the stellar mass build-up between the and epochs.
All quoted magnitudes throughout the letter are in the AB magnitude system (Oke 1974).
2 Observations and Measurements
We use three epochs of HST ACS observations of the Chandra Deep Field South (CDF-S) obtained as part of the GOODS program. The data consist of image mosaics in all four ACS bands , , , and (the ACS F435W, F606W, F775W, F850LP filters, respectively) spanning wavelength range of to 1 , and covering approximately a field of view of x . The specifics of data acquisition and reduction, as well as object detection and photometry can be found in Giavalisco et al. (2003a).
We supplement our ACS data set with the VLT ISAAC near-infrared imaging. The NIR data consists of the J, H, and bands that extend our wavelength coverage out to Å(rest-frame ). We combine the ACS and ISAAC data using a method that optimally matches the relative photometry between these bands (Papovich 2002; Papovich et al. 2003).
3 Theoretical Model
We make use of a semi-analytic model, based on the hierarchical structure formation paradigm in a CDM cosmology (, , ). The model treats the formation of structure via a hierarchical ‘merger tree’, and includes a treatment of gas cooling, star formation, supernova feedback and chemical enrichment, galaxy mergers, stellar populations and dust (see Somerville & Primack (1999) and SPF2001 for details). We follow halo merger histories down to a circular velocity of , as gas collapse and star formation in smaller halos is assumed to be suppressed by the presence of a photoionizing background (see Somerville 2002, and references therein). We use the multi-metallicity stellar SEDs from the STARDUST models (Devriendt, Guiderdoni, & Sadat 1999), with a Kennicutt IMF. Dust extinction is modeled in a similar manner as in SPF2001. We use this model to produce a ‘mock-GOODS’ catalog with the same geometry, sky area, filter passbands, etc. as the real GOODS.
4 Galaxy Sample
The -dropout sample was chosen using the color selection criteria described in detail by Giavalisco et al. (2003b). The sample was refined by applying detection limits at (S/N) for the ACS data set, and another one at (S/N) for the matched NIR set. These signal-to-noise restrictions limited our sample to galaxies with , which helped curtail the presence of spurious detections. The relatively faint cut-off was necessitated by the desire for a large enough sample for our study and did not significantly affect our conclusions. After further visual inspection, we chose 136 color-selected galaxies for analysis.
Using the same color selection criteria that were applied to the observed sample we produced a model-derived -dropout sample. We then applied a magnitude cut-off of in order to comply with the observational detection limit. Before applying the color selection criteria we incorporated simulated observational scatter into our model-derived photometric catalogs. The observational scatter was drawn from a Gaussian distribution with the typical signal-to-noise values found in the observed CDF-S data set.
Due to the dearth of spectroscopic data, empirical Monte Carlo simulations were performed to estimate the redshift distribution of the observed -dropout sample. These simulations were based on artificial LBGs distributed over a wide redshift range () with assumed distribution functions of UV luminosity, SED, morphology, and size, adjusted to match the colors of observed -dropouts observed at . Reader is urged to see Giavalisco et al. (2003b) for a detailed discussion on these simulations. The redshift distribution of the simulated color-selected sample was found to have a mean value of with a standard deviation of .
One of the interesting tests that we can perform is to test for the incompleteness of our color-selected sample. According to the Monte Carlo simulations, of all the simulated -dropout galaxies down to and in the interval are recovered using our color selection criteria. When we apply the color criteria to our model, we select of all model galaxies in the same redshift range, down to the same limiting magnitude of . This implies that the simulations performed by Giavalisco et al. (2003b) and the semi-analytic model show concordant incompleteness estimates with respect to the -dropout selection technique in the above redshift range and down to our detection limit.
5 Galaxy Properties
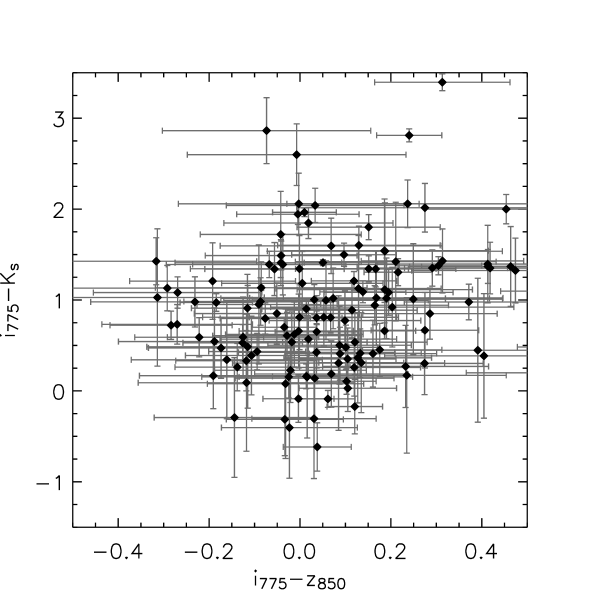
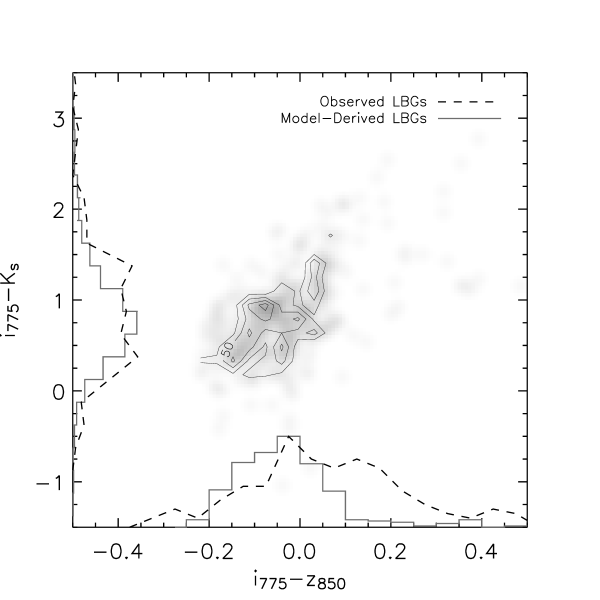
The vs. (1550 - 4400 vs. 1550 - 1700 Å, rest-frame ) colors for the observed and model-derived -dropout samples are presented in Figures 1a and 1b, respectively. A Kolmogorov-Smirnov test reveals a likelihood that the colors are drawn from the same underlying distribution for the two -dropout samples. A probability of 2 X is obtained for the corresponding colors. This indicates a relatively good agreement in the color distribution between the two samples, but a poor correlation in the colors.
The colors probe the slope of the UV continuum, which is believed to be primarily an indicator of internal dust content in young stellar populations (e.g. Meurer, Heckman, & Calzetti 1999). In our model we used dust normalized against the data and a Galactic extinction curve. The apparent disparity could be fixed by employing a different extinction curve (Calzetti 1997), or including the expected dependence of the extinction on the age of the stellar populaton (Charlot & Fall 2000).
Aside from the photometric analysis, we compared the luminosity function from our model with the one for G-dropouts from Steidel et al (1999) and B-dropouts from HDF-N to ensure proper number counts. We found good agreement, which is not surprising since our model is very similar to the one that was used (and optimized) in SPF2001. In fact, the reader is urged to refer to SPF2001 for a detailed discussion on this topic.
Several researchers (e.g. Papovich, Dickinson, & Ferguson 2001; Shapley et al. 2001) have used simple parameterized star formation histories and stellar population synthesis models to estimate physical properties of LBG’s at using the optical-NIR photometry as a constraint on the star formation history. Here, as we have shown that our model reproduces (modulo dust) the observed color distribution for objects selected via their and colors and corresponding magnitude limits, we argue on similar grounds that our model should reproduce the statistical distribution of underlying stellar ages and masses of the observed -dropout population. Thus we can use our models to obtain estimates for some of these quantities.
In Figure 2 we show the stellar masses of our color-selected model galaxies. We note that the stellar masses range from to , which is roughly two orders of magnitude less than the stellar masses of the present day spirals and ellipticals — this indicates that, as with the population, the Lyman-break galaxies are not the fully assembled progenitors of the present-day galaxies (Giavalisco, Steidel, & Macchetto 1996; Steidel et al. 1996a), and that several generations of merging events must take place between and the present epoch. The median mass of ( ) is 0.5 dex less than for the galaxies studied in SPF2001. This implies a stellar mass build-up between the two epochs. To further explore the last point we have looked at the mean stellar masses of all galaxies measured in rest-frame UV and predicted by our model at and . We find that at , with (UV rest-frame), we get a mean value of ( ) in a magnitude interval, and at , with (UV rest-frame), we get a mean value of ( ), again in a magnitude interval. This corresponds to a mass build-up of approximately . This type of mass build-up between and is similar to that inferred from the Papovich et al. (2003) comparison of volume-averaged SEDs of observed Lyman-break galaxies.
Our model also provides us with the star formation rates (SFR) and ages of our color-selected model galaxies. Our model results tell us that the values of these two quantities for the sample are very similar to the ones found for the sample studied by SPF2001. We observe a branch of actively star-forming galaxies, and a broader branch of galaxies with lower SFR, corresponding to bursting and fading galaxies. The star formation rates for the brightest galaxies in the model approach 100 , similar to what has been found for Lyman-break galaxies studied by SPF2001.
We have also looked at the distribution of stellar-mass-weighted mean stellar ages. We found that the distribution is very broad and skewed toward ages of less than 300 Myr, with a median age of 200 Myr, and a peak at about 100 Myr. There is, however, a tail of objects with older stellar populations, reaching a mean age of Gyr — close to the age of the universe at that redshift in our adopted cosmology ( Gyr).
Drawing on the stellar mass distribution results (Figure 2) we plot in Figure 3 the mass distribution of all (i.e. not just color-selected) galaxies from our mock catalog, limited to galaxies with ( ) (the median value from Figure 2) and spanning the redshift range of . As was mentioned in §4, we select of model galaxies in this redshift range with our color selection criteria, down to a limiting magnitude of . This corresponds to of the total stellar mass available in that redshift range, down to that magnitude limit. Hence, with our color criteria, we ’observe’ the majority of the stellar mass that resides in galaxies brighter than and spanning . Figure 2 indicates that of our color-selected objects lie above ( ), we find though that only of all model galaxies more massive than ( ) are brighter than . So for model-derived objects residing in we only sample of the available stellar mass down to . The rest of the stellar mass resides in relatively massive UV-faint galaxies. The color selection incompleteness down to and the mass contained in the UV-faint objects with magnitudes are two effects that conspire to severely limit the amount of mass selected with optical surveys (Franx et al. 2003). Given how well our model predicts the observed colors (modulo dust), number counts, and other properties, this points to a substantial deficit in optically-selected galaxies, and by extension, the total stellar mass. Since our model catalog was limited to galaxies with values, the ’unseen’ mass fraction estimate should be taken as a lower limit.
6 Summary and Conclusions
We performed a comparative analysis of the color-selected -dropout samples taken from GOODS observations and a variant of a CDM-based semi-analytic model. We found that the color selection technique used to obtain the -dropout sample does a relatively good job in selecting a complete census of galaxies spanning and down to . The color selection incompleteness limits are roughly the same when applied to our model and the empirical Monte Carlo simulations preformed by Giavalisco et al. (2003b). We select of all galaxies and of stellar mass in that redshift range, down to . This lends further credence to applicability of the -dropout color selection technique outlined in Giavalisco et al. (2003b), which was designed based on simpler, more empirical models of galaxy SEDs at this epoch, and has not, as yet, been extensively verified with spectroscopic data.
We found a relatively good agreement between the model-derived and observed CDF-S -dropout galaxy colors. The colors showed much less agreement, however, we attribute the discrepancy to potentially inadequate dust recipe employed in the model. In general, we found that the stellar age, mass, and the star formation properties of the sample were similar to the sample studied by SPF2001. We found a model-derived stellar mass build-up for the UV rest-frame galaxies between the two epochs. In addition we found that if we look at all galaxies predicted by our model, spanning redshift range, then at least of the stellar mass contained in objects with ( ) is missed due to the observational limit. If our model is correct, and it does show reasonable agreement with respect to colors (modulo dust), number counts, and other physical quantities, this result has significant implications for the completeness of the optically-selected surveys at this epoch.
References
- Baugh et al. (1998) Baugh, C. M., Cole, S., Frenk, C. S., & Lacey, C. G. 1998, ApJ, 498, 504
- Calzetti (1997) Calzetti, D. 1997, AJ, 113, 162
- Charlot & Fall (2000) Charlot, S., Fall, S. M. 2000, ApJ, 539, 718C
- Devriendt, Guiderdoni, & Sadat (1999) Devriendt, J. E. G., Guiderdoni, B., & Sadat, R. 1999, A&A, 350, 381D
- Franx et al. (2003) Franx, M. et al. 2003, ApJ, 587, L79
- Giavalisco et al. (2003a) Giavalisco, M. et al. 2003a, this ApJL issue
- Giavalisco et al. (2003b) Giavalisco, M. et al. 2003b, this ApJL issue
- Giavalisco, Steidel, & Macchetto (1996) Giavalisco, M., Steidel, C., & Macchetto, D. 1996, ApJ, 470, 189
- Madau et al. (1996) Madau, P., Ferguson, H., Dickinson, M., Giavalisco, M., Steidel, C., & Fruchter, A. 1996, MNRAS, 283, 1388
- Meurer, Heckman, & Calzetti (1999) Meurer, G., Heckman, T., & Calzetti, D. 1999, ApJ, 521, 64
- Oke (1974) Oke, J. B. 1974, ApJS, 27, 21
- Papovich et al. (2003) Papovich, C. et al. 2003, this ApJL issue
- Papovich (2002) Papovich, C. 2002, Ph. D. thesis, The Johns Hopkins University
- Papovich, Dickinson, & Ferguson (2001) Papovich, C., Dickinson, M., & Ferguson, H. C. 2001, ApJ, 559, 620
- Shapley et al. (2001) Shapley, A. E., Steidel. C. C., Adelberger, K. L., Dickinson, M., Giavalisco, M., & Pettini, M. 2001, ApJ, 562, 95
- Somerville (2002) Somerville, R. S. 2002, ApJ, 572, L23
- Somerville, Primack, & Faber (2001) Somerville, R. S., Primack, J. R., & Faber 2001, ApJ, 310, 1087
- Somerville & Primack (1999) Somerville, R. S., & Primack, J. R. 1999, MNRAS, 310, 1087
- Steidel et al (1999) Steidel, C., Adelberger, K. A., Giavalisco, M., Dickinson, M., & Pettini, M. 1999, ApJ, 519, 1
- Steidel et al. (1996a) Steidel, C., Giavalisco, M., Dickinson, M., & Adelberger, K. 1996a, AJ, 112, 352
- Wechsler et al. (2001) Wechsler, R. H., Somerville, S. S., Bullock, J. S., Kolatt, T. S., Primack, J. R., Blumenthal, G. R., & Dekel, A. 2001, ApJ, 554, 85
![[Uncaptioned image]](/html/astro-ph/0308541/assets/x3.png)
The stellar masses of the color-selected model galaxies. The filled-diamond symbols show stellar masses of the individual color-selected model galaxies vs. their corresponding magnitudes. The histogram shows the projected distributions for the same color-selected model galaxies with an imposed magnitude limit (shown as a gray dash-line). The predicted masses are two magnitudes lower than the stellar masses of the present day spirals and ellipticals.
![[Uncaptioned image]](/html/astro-ph/0308541/assets/x4.png)
This figure illustrates the stellar mass distribution of all model-derived galaxies spanning the redshift range of and with ( ) (the median value from Figure 2). Galaxies were binned into 0.25 magnitude intervals and weighted by their corresponding stellar mass. A gray dash-line is included to delineate our observational magnitude limit. This figure shows the amount of model-predicted mass potentially missed by the current optical surveys.