Morphology of Galactic Open Clusters
Abstract
We analyzed the shapes of Galactic open clusters by the star counting technique with the 2MASS star catalog database. Morphological parameters such as the ellipticity and size have been derived via stellar density distribution, weighed by clustering probability. We find that most star clusters are elongated, even for the youngest star clusters of a few million years old, which are located near to the Galactic disk. The shapes of young star clusters must reflect the conditions in the parental molecular clouds and during the cluster formation process. As an open cluster ages, stellar dynamics cause the inner part of the cluster to circularize, but the overall radius gets larger and the stellar density becomes sparser. We discuss how internal relaxation process competes with Galactic external perturbation during cluster evolution.
1 Morphology of Star Clusters
The way member stars distribute within a star cluster changes as the cluster evolves. The initial stellar distribution is governed by the structure of the parental molecular cloud, and by how star formation proceeds. Sequential star formation, for example, may result in massive stars, which are responsible for inducing the formation of next-generation stars, to have a birth place markedly different from that of low-mass stars. As the star cluster evolves, the distribution is modified by internal gravitational interaction among member stars. Subsequently stellar evaporation and external disturbances—e.g., Galactic tidal force, differential rotation, and encounters with molecular clouds—would alter the spatial structure and eventually dissolve the cluster. While individual star clusters are good laboratories to study stellar dynamics (Friel, 1995), they also serve as test particles to probe the local physical (e.g., gravitational field) and chemical (e.g., metallicity) conditions. Open clusters in particular, with their wide ranges of age and location distribution, would be valuable tools to study the star formation history and chemical evolution of the Galactic disk.
Stars in a globular cluster are known to concentrate progressively toward the center, more so for massive stars than for low-mass stars. The density distribution, prescribed by the King model (King, 1966), is understood as a combination of an isothermal sphere (i.e., dynamically relaxed) in the inner part of the cluster, and tidal truncation by the Milky Way in the outer part. In contrast, open clusters appear irregularly shaped, with member stars sparsely distributed. The youngest clusters must still bear the imprint of their formation history, so their structure, when compared with that of molecular clouds, may shed crucial light to the fragmentation process during cloud collapse. At the other end, the oldest open clusters serve as tracers of the structural and evolutionary history of the Galactic disk (Friel, 1995). Even though some open clusters are known to follow the King model (King, 1962), and despite some elaborative theoretical considerations on the dynamics of open clusters (e.g., Portegies Zwart et al., 2001)), few observational studies have been done systematically until recently (e.g., Pandey, Mahra, & Sagar, 1990; Nilakshi et al., 2002), perhaps due to the complexity of the problem arising from the small number of member stars, and the lack of comprehensive data of open clusters on large angular scales.
As early as almost a century ago, Jeans (1916) already considered the flattening effect of a moving cluster through a general gravitation field of stars. Oort (1979) noticed the uneven distribution of stars in Hyades by comparison of the numbers of stars in quadrants about the cluster’s apparent center. He concluded that the cluster appeared flattened with an axial ratio of about 2 aligned with the Galactic plane. Bergond, Leon, & Guibert (2001) analyzed the surface star density in 3 open clusters by the star counting method and found elongated shapes parallel to the Galactic plane. These authors furthermore employed wavelet transform to bring out possible tidal tails, presumably caused by the Galactic tidal field.
A comprehensive diagnosis of the spatial structure of open clusters appears elusive because they are loose systems with shallow gravitational potential, hence lack of organized symmetry in structure, and likewise the morphology and shape would be vulnerable to external perturbation. We would like to learn whether young clusters are mass segregated, and if so, to what extent this is due to dynamical relaxation, as opposed to relic structure in molecular clouds. To answer questions like these, it is desirable to study the spatial structure of the youngest star clusters, and see how it evolves as a cluster ages and moves in its Galactic orbit.
As a pilot study on how a star cluster shapes out of the molecular cloud, we (Chen & Chen, 2002) investigated the radial star density profiles of 7 open clusters with ages ranging from a few million years to a few billion years, based on the 2MASS (Two-Micron All-Sky Survey) Second Increment Release star catalog. The infrared data enabled us to probe the distribution of member stars of clusters that are very young and still embedded in molecular clouds. Our study indicated that stars, regardless of their masses, tend to concentrate progressively toward the center of a cluster, and the degree of concentration is higher for luminous (presumably more massive, or as binary) stars than for fainter members. Such a segregation structure appears to exist in even the youngest star clusters. The relaxation time , where is the number of stars and is the crossing time of the system (Binney & Tremaine, 1987). For a typical open cluster , and where the size of the cluster pc and the velocity dispersion km s-1, yielding yrs. The youngest open clusters (ages of a few million years) therefore have not had time for dynamical relaxation to take place efficiently. The spatial distribution of member stars in the youngest star clusters hence is much relevant to the structure in the parental cloud out of which the cluster was formed, and to subsequent mass redistribution during star (cluster) formation process.
Nilakshi et al. (2002) analyzed the radial star density profiles of some 38 open clusters based on the U.S. Naval Observatory (USNO)-A v2.0 star catalog, which in turns was derived from the Digital Sky Survey (DSS) plates. Because no membership information is available, the extent, size, shape, or any spatial structure of a particular star cluster is estimated in a statistical sense against adjacent Galactic star fields. One of the advantages of working with a homogeneous sky-survey database, such as the 2MASS or USNO catalog, in addition to the convenient availability, is the extended angular coverage to encompass not only the entirety of a cluster itself (core, envelope, or possible tails), but also sufficient field regions for comparison. A fair assessment of the stellar density fluctuations in comparison fields is crucial in the star counting technique.
Parameterization of the spatial structure of an open cluster by its radial distribution alone obviously is not adequate, as already pointed out by Nilakshi et al. (2002). Many open clusters have highly irregular shapes, often even with no clear centers, so circular symmetry cannot be readily assumed. Dense molecular cloud cores are shaped on average as a prolate Gaussian with an intrinsic axial ratio of 0.54, as a part of an evolutionary sequence from filamentary molecular cloud complexes to roughly spherically condensed cores (Curry, 2002). It is therefore desirable to represent the stellar distribution by a more sophisticated method than a one-dimensional analysis. This paper summarizes the result of our attempt to analyze the morphological shapes of open clusters, and how the shaping would evolve in Galactic environments.
We take a probabilistic approach to estimate the stellar surface density of stars in the 2MASS point source catalog, and represent a star cluster with an ellipsoid. This allows us to investigate not only the structure (concentration, segregation) but also the shape (elongation, orientation) of a cluster, and hence by a sample of clusters of different ages and environments, to delineate the morphological evolution influenced by Galactic dynamics. The 2MASS infrared data are free from much of interstellar extinction, and so would reveal the true shape of a star cluster more readily than in optical wavelengths. Some youngest star clusters may be seen only in infrared wavelengths (Lada & Lada, 2003). We describe our 2MASS sample of open clusters in Section 2, and present the methodology to analyze the morphology of open clusters in Section 3. The results and discussions are summarized as the last section.
2 Data of Open Clusters
Dias et al. (2002) complied the latest catalog of open clusters, which is based on the previous work of Lyngä (1987) and of Mermilliod111http://obswww.unige.ch/webda, with some updated data on radial velocity, proper motion and metallicity. Of the total of more than 1600 entries, about 38% have distance, age and color-excess determinations. We note that while such a compilation is useful for information retrieval, one should exercise caution when deriving statistics from the dataset, because the catalog is far from completion—some of the entries may not be bona fide stellar groups at all, and perhaps a lot more open clusters are yet to be discovered. Severe extinction by dust near the Galactic plane makes it difficult at wavelengths shortward of infrared to recover the true shapes, or even their bare existence, of young star clusters, which as recent studies show may outnumber optically visible open clusters by a factor of an order (Lada & Lada, 2003).
We selected among the first 800 entries in the Dias et al. (2002) catalog open clusters, roughly from RA to which suffer less extinction and source crowdedness toward the Galactic center, have distance and age determinations available and have angular sizes between 3′and 40′. The choice of the angular range, somewhat arbitrary, is a convenient compromise between spatial resolution and the practical limit of maximal data (1 degree field of view) downloadable from the 2MASS web interface. We selected those clusters that are rich in density enhancement (by eye) and with as complete data coverage in the 2MASS star catalog (All-Sky Data Release) as possible, i.e., no nearby bright stars so as to contaminate the field. In addition to bright field stars, young open clusters often contain hot, luminous members. A real bright star would leave a blank pattern, rendering an incomplete listing in the 2MASS database. Even a moderately bright star would cause unreliable astrometric and photometric determinations on neighboring stars. By working with the 2MASS data, our sample suffers less brightness contrast between the hottest stars and faint members than in the visible wavelengths. Interpolation of stellar density is possible in most cases as long as the contamination is not overwhelming (e.g., too bright or too close within the cluster boundary). In the study we report here, none of the sample suffers bright-star contamination, and a total of 31 open clusters were selected in the morphological analysis.
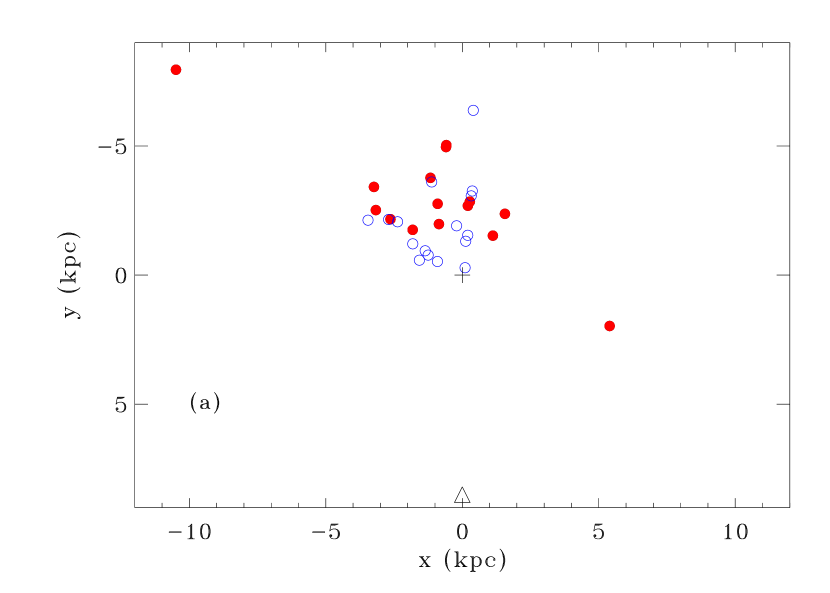
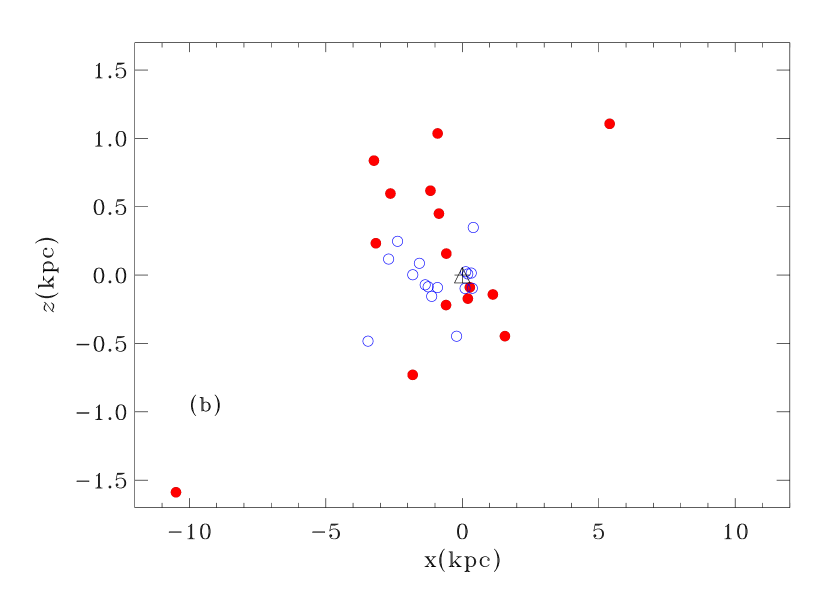
Our sample has no obvious additional selection effects, other than to avoid the Galactic center where the open cluster catalog (Dias et al., 2002) itself may be highly incomplete. Figure 1 shows the pole-on and edge-on Galactic distributions of our star cluster sample. Clusters younger and older than 800 Myrs are marked differently. It is noted that the majority (29) of our sample are in the direction of Galactic anti-center, a consequence of our sample selection from half of the Dias et al. (2002) catalog. It is seen that old open clusters have a larger average scale height above the Galactic plane than young star clusters do.
3 Methodology
3.1 Statistical Membership
In the absence of membership information on individual stars, we estimate the structure of a star cluster by a probabilistic star counting technique, i.e., the boundary, shape, size are all determined in a statistical sense. In essence, the degree of clustering of neighbors around any star gives a measure of the likelihood of that star being in a cluster environment. One defines for each individual star the clustering parameter,
| (1) |
for which is the total number of neighboring stars within a specified angular size (a “neighborhood aperture” centering on the th star) and is the average number of field stars within the same aperture. The number of field stars can be estimated by where is the surface number density of field stars, estimated in regions away from the apparent star cluster and is the radius of the neighborhood aperture.
We see that the clustering parameter gives a measure of local enhancement of stellar density, whose value ranges from in a field region (for which ) to near a rich cluster (). In other words, behaves very much like a probability of cluster membership. Our probabilistic method to analyze membership in a star cluster is similar to that used by Danilov & Seleznev (1990).
Note that the choice of should not be arbitrary. If is too small, the uncertainty in will be large due to small-number statistics. On the other hand, if is too large, the intrinsic structure of the cluster will be smoothed out and detailed structure information is no longer available.
We describe below our procedure to select an appropriate aperture size from the surface density of field stars . Once both and for a cluster are determined, we can estimate the membership probability for each star by Eq. 1.
3.2 Surface Density of Field Stars
The cluster membership probability defined above is based on a measure of enhancement of local stellar density compared to field stars. A fair estimate of the density of field stars therefore is prerequisite. For each cluster, we use regions away () from the central cluster to estimate the mean number density of field stars.
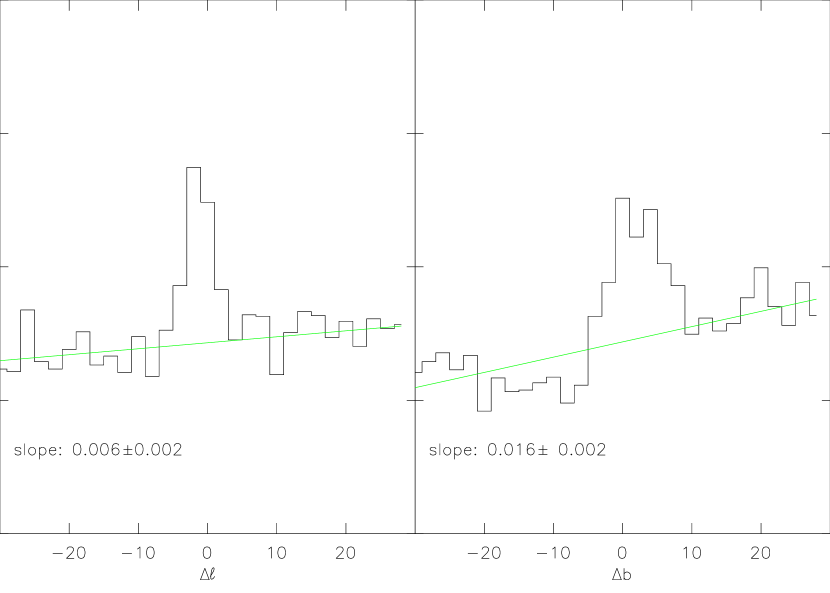
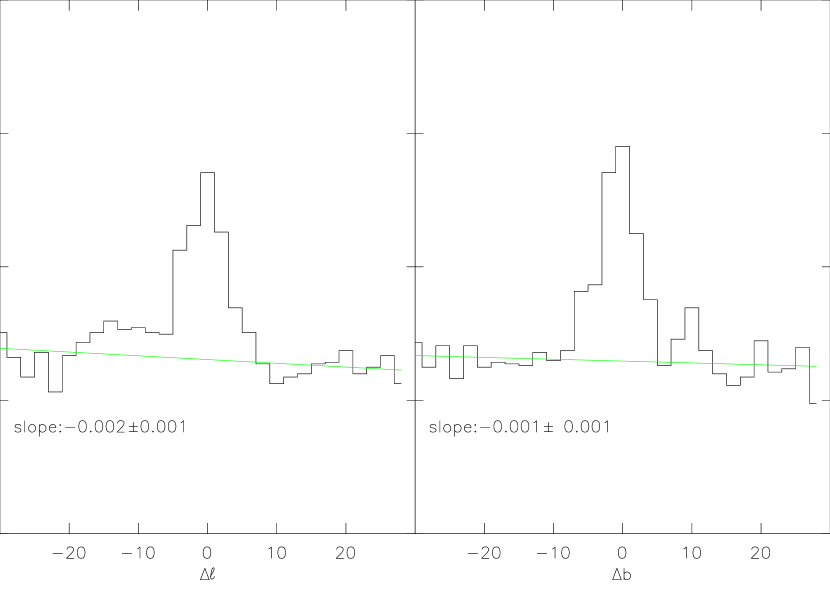
Since our analysis of the cluster parameters is based on the statistics (star density, aperture size) in the surrounding field regions, obviously a homogeneous distribution of field stars must be assumed in order for our technique to work. We note actually in almost every case we encountered, the distribution of field stars is not homogeneous, due to the general stellar gradient vertical to the Galactic disk. Figure 2 shows such an example for which a density gradient is seen in both the RA and the DEC projections, with the overall gradient vector pointing toward the Galactic disk, as expected. We also find that, not surprisingly, the density gradient is higher for a line of sight with a lower Galactic latitude. In our analysis we removed a flat surface density as background for individual star clusters, but empirically found this kind of density gradient—though potentially useful for study of Galactic disk stellar populations—to have little effect on our morphological results because the density differs no more than a few percents across the fields of our star clusters.
The surface number density of field stars is computed by counting the number of stars in a certain sky area. Due to the discrete nature of individual stars, even for a uniform star field, would approach a constant only when the sampling sky area is large enough to include a sufficient number of stars. Otherwise, when the sampling size is smaller than about the average angular separation of stars, large fluctuations result. As the minimum, one would demand a sky area to have a signal-to-noise of against Poisson fluctuations, or field stars to determine accordingly the optimal neighborhood aperture size . In our analysis we take (i.e., ) and select the corresponding for each cluster. In general is on order of a few arcminutes.
3.3 Cluster Shape and Morphology
With each star now being represented by a membership probability, the surface density of cluster member stars is then the sum of the clustering parameter of every star within each sky-coordinate grid (with area ); that is, the effective number density of member stars is,
| (2) |
Obviously in field regions, . The morphology of a cluster is prescribed by density contours, at both the one-third level of the maximal density (), and at the boundary, defined as where the density drops to 2–3 times the background fluctuations. In the extreme case, e.g., in NGC 2567, for which the star cluster is very sparse, a mere 1- outer boundary was used. Effectively the inner and outer ellipses trace, respectively, the core and the halo (or the corona as termed by some researchers) of a star cluster. The density contours are least-squares fitted with ellipses to obtain the eccentricities of the inner and outer ellipses, and the corresponding sizes (average of the semimajor and semiminor axes). We use the flattening parameter to quantify the shape of an ellipse. The flattening parameter (or oblateness222http://mathworld.wolfram.com/) is defined as , where and are respectively the semimajor and semiminor axes of an ellipse, so is related to the eccentricity by . For very close to 0 (highly flattened) or 1 (our case), the flattening parameter is more discriminative than the eccentricity itself.
The uncertainties in the determination of the flattening are estimated by Monte Carlo simulations of star clusters of different shapes. For typical parameters of the open clusters in our sample, i.e., with times enrichment of stellar number density of cluster members with respect to the field, the uncertainties in the flattening for the outer boundary and for the core (1/3 maximum) are and for a spherical cluster (i.e., ), and are and for an elongated cluster with . Obviously, the richer the cluster, the smaller the uncertainties. For instance, for a spherical globular cluster with 100 times density enhancement, , and .
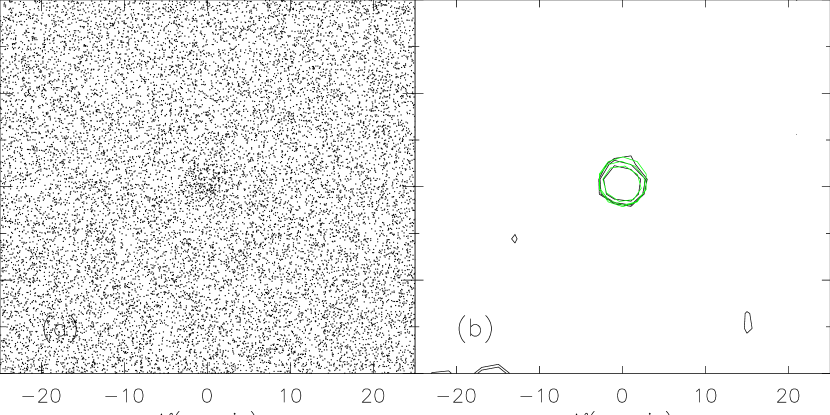
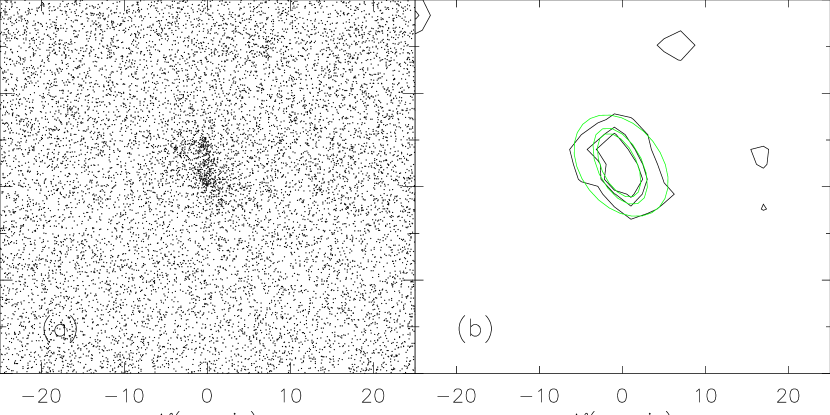
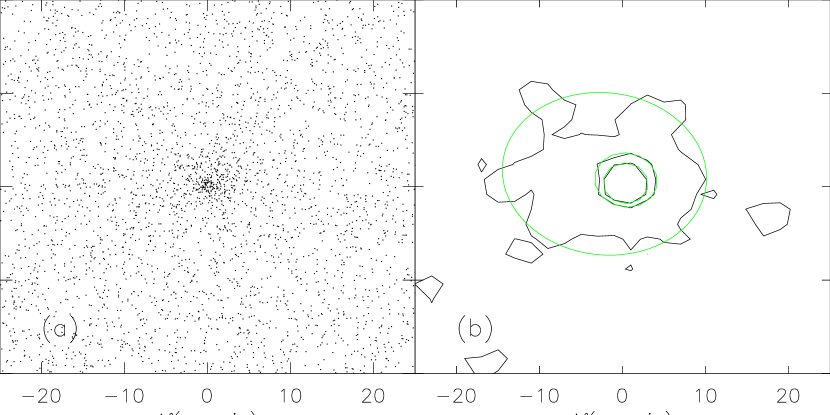
In addition to the shape (flattening) and size, other parameters, such as the position angle of the ellipse, can also be obtained. We illustrate in Fig. 3 examples of two clusters with different morphology, one of relatively round shape (NGC 2414) and the other of elongated shape (NGC 1893). These two clusters will be compared in details in the next section.
We list the results of individual clusters in our sample in Table 1, where the first column gives the name of the cluster, the second column is the Galactic coordinates in degrees, and the next three columns are the heliocentric distance, height from the Galactic disk, and the age of each star cluster, with the distance and age taken from Dias et al. (2002). Columns 6 to 11 list, respectively, the flattening parameters and corresponding sizes (average of semimajor and semiminor axes) derived from the density contours of member stars. The last column gives the total number of member stars, by summing the total membership probability of a cluster.
4 Morphological Evolution of Open Clusters
Two kinds of dynamical effects act on, and influence the morphology of, an open cluster. The first is internal interaction of two-body relaxation due to encounters among member stars. This leads to stellar distribution in spherical shape, ever denser toward the cluster center. At the same time, low-mass members may gain enough kinetic energy through the encounters and get thrown out of the system (i.e., stellar “evaporation”). The other dynamical process is external interaction, including tidal force due to Galactic disk or giant molecular clouds, and differential rotation especially for a cluster located in the inner disk region. These disruptive effects tend to make a star cluster elongated in shape, with the outer parts particularly vulnerable.
Tidal disturbance on a star cluster is stronger when closer to the Galactic disk plane. Fig. 5 shows the vertical heights from the Galactic disk versus the ages of the open clusters in the Dias et al. (2002) catalog, of which our sample, separately marked, is a subset. As can be seen, young open clusters tend to reside close to the disk where molecular clouds, from which the star clusters were formed, are distributed (Tadross et al., 2002; Chen, Hou, & Wang, 2003). If open clusters are separated into two age groups, old and young, with the dividing age, somewhat arbitrary, of that of the Hyades, 0.8 Gyr (Phelps et al., 1994; Chen, et al., 2003), the scale heights are 354 pc (old) and 57 pc (young), respectively (Chen, et al., 2003), based on the data compiled by Dias et al. (2002)). Tadross (2003) included additional consideration of the galacto-distances of the clusters and the results support the previous assertion (Lyngä & Palous, 1987) that old clusters seem to distribute at larger scale-heights in the outer parts of the Galaxy than in the inner parts. Obviously, only star clusters away from the inner disk regions—where the tidal force from giant molecular clouds plays a major disruptive role in the structure or even the existence of a star cluster—would have survived on Galactic dynamical time scales (Janes & Phelps, 1994).
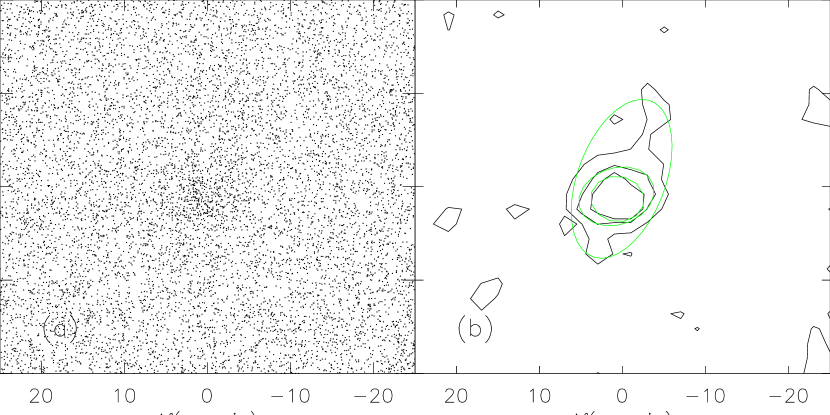
Comparison between the two open clusters in Fig. 3 is informative. NGC 2414 is relatively poorly studied, perhaps because of its paucity and small angular extent. Much of the literature about this open cluster can be traced back to the photometric measurements in Vogt & Moffat (1972), based on 10 member stars. In comparison, NGC 1893 is prominently stretched toward the disk plane. The cluster is associated with bright nebulosity and dark clouds, but does not seem to show positional variation of color excess across the cluster (Yadav & Sagar, 2001). The extinction effect would certainly be even smaller in the 2MASS 2 µm data. Its elongated shape (or two subgroups) thus should be inherent to the stellar distribution within the cluter, rather than caused by extinction variation.
These two clusters share some similarities, namely both being relatively young, , and close to the disk plane, with NGC 2414 at , , and NGC 1893 at , . They however contrast greatly in shape, size, and apparent richness. NGC 2414 is round (flattering throughout the entire cluster), small, and contains some 74 member stars within its derived radius . NGC 1893 on the other hand is oval, twice as large in angular extent, and encompasses 645 member stars. NGC 1893 therefore has a much stronger gravitational binding than NGC 2414 against external disruption. What we see now in NGC 2414 may well be its remnant cluster core.
Such a stripping off of cluster halos is not uncommon. For example, Berkeley 17 (=C0517+305), the oldest open cluster known (Salarism, Weiss, & Percival, 2004), has a protrusion manifestly pointing toward the Galactic disk (Fig. 6), with a projected extent comparable to the cluster’s radius, –7′, or about 5 pc in projected length assuming a 2.7 kpc distance (Dias et al., 2002). The enhancement (”corona”) has already been inferred from radial stellar density distribution, and from the color-magnitude diagram of stars away from the nominal cluster region (Kałużny, 1994). Our analysis brings up clearly the tail and its geometry, and further hints on an associated antitail, which typifies tidal distortion.
The old, metal-poor, and large-height cluster NGC 2420 (Friel et al., 2002), serves as a good showcase for interplay between internal stellar dynamics and external disturbances. This cluster is nominally listed in Dias et al. (2002) to have an angular diameter of 5′, at a distance of 3085 pc, and a logarithmic age of 9.048 years, apparently taken from WEBDA. We adopt this distance and those of other star clusters in our studies from the Dias et al. (2002) catalog as a homogeneous source of input data, but note that this cluster may be considerably closer, at 2.28 kpc (Janes & Phelps, 1994). Errors in distance estimation—which often turn out to be quite significant among open clusters—would not affect the shape determination, but obviously would influence the results of any statistical analysis. Using star counting on a Palomar Sky Survey plate, Leonard (1988) already noticed a much larger extent, to at least 20′, from the apparent center of NGC 2420. Our analysis of the 2MASS data shows a negligible gradient in the field star density toward NGC 2420 (Fig. 4). The cluster itself is determined to have an inner (1/3 maximum) and outer (3- sky) ellipses with flattening of , and , respectively. Average sizes of and were obtained. For NGC 2420, an aperture size 6 has been used to estimate the field star density, arcmin-2, from which the surface density of member stars is then derived according to Eq. 2. At the 2MASS limit of Ks=15.6 mag, by summing up all s (Eq. 1), there are a total of 46822 member stars. This is to be compared with 68527 within a radius of 20′ up to the completeness of photographic 19.5 mag studied by Leonard (1988), which covers a larger sky area with deeper stellar photometry than the 2MASS data we have used. We may be witnessing the disintegrating process of the outer part of NGC 2420.
Globular clusters are known to have elliptical shapes (White & Shawl, 1987), likely due mainly to their overall rotation, rather than to Galactic tidal interactions (King, 1961; Meyan & Mayor, 1986). Kontizas et al. (1990) compared globular clusters in the Large and Small Magellanic Clouds, and found that in virtually all cases, the inner parts are more elliptical than the outer parts. This is understood as the diminishing effect of rotation from the inner to the outer parts of a globular cluster. These authors also found that the SMC globular clusters are more elliptical than those of the LMC, which in turn are more elliptical than those in our galaxy, and that the outer shapes are somewhat flatter for younger systems (Kontizas et al., 1991).
Open clusters are also recognized to have elongated shapes but the orientation of the flattening, however, cannot be accounted for by Galactic tides alone (Jefferys, 1976). This may be because a giant molecular cloud, local to a particular open cluster, plays a more influential role in shaping the cluster than a general Galactic disk potential (Danilov, 1996). Our analysis shows that even the youngest open clusters (several Myrs old) have very elongated shapes, with . This is to be compared with the inferred mean intrinsic axial ratio of 0.54 for the observed shapes of molecular cloud cores (Curry, 2002). The youngest star clusters hence appear by and large to have inherited the morphological shapes from the prenatal molecular clouds. Because of the low volume stellar number density of an open cluster, internal dynamics never becomes dominant so as to sphericalize the system (Portegies Zwart et al., 2001), in contrast to the case in globular clusters.
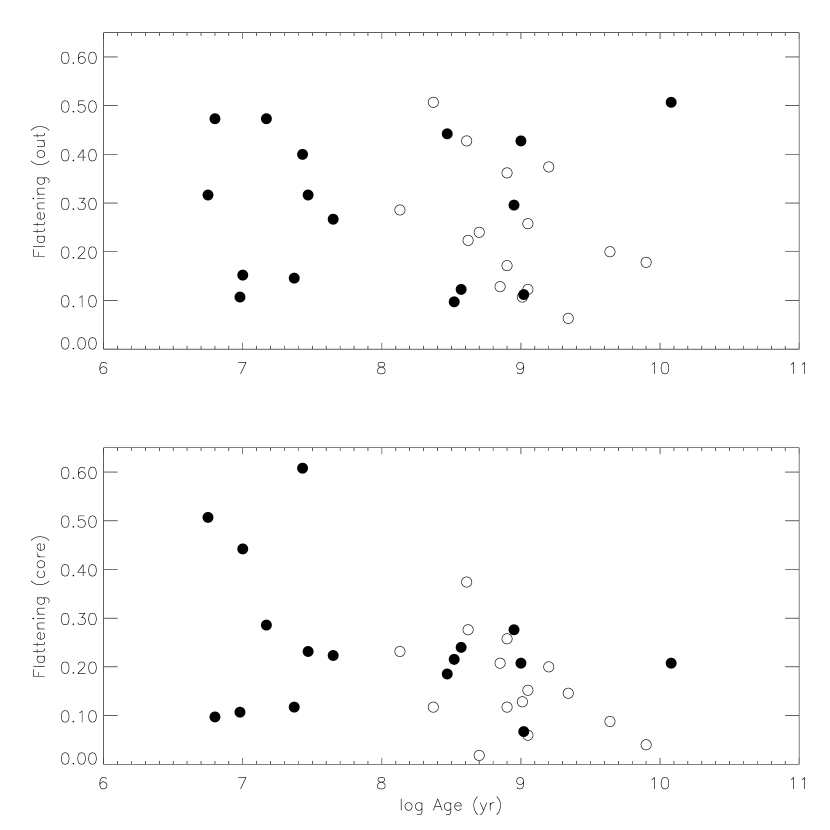
Fig. 7 and Fig. 8 summarize our analysis of the shapes of the open cluster sample. In Fig. 7 the shapes of the cluster core (diagnosed with ) and of the outer boundary () are shown as a function of age. One sees that most open clusters are elongated in shape. Because what we see is the projected shape, the clusters can only actually be flatter. The number of our sample of open clusters is small (31), yet it is tantalizing to note that while the shape of the outer boundary remains unconstrained with age, the core tends to circularize as a star cluster ages. If the sample is further divided to two groups according to the height from the disk plane by the median value of the sample pc, one sees clearly that the large-height group (denoted by open circles in Fig. 7) evinces a noticeable tendency of rapid spheridalization both in the core and in the halo. Low-lying clusters remain elongated from birth to date, prominently so for the outer halos, which are the most vulnerable to disruption. Fig. 8 shows how the flattening of star clusters varies with the height from the disk plane, for young (filled circles) and old (open circles) systems. The youngest star clusters close to the disk clearly manifest the most elongated shapes. The tendency toward spherical shaping away from the disk, in particular in the cores of old systems, demonstrates again the working of internal dynamical relaxation. The flattening shapes of young clusters are primarily inherited from cluster formation process, but after some yr or so, internal stellar dynamics become effective in shaping the core of a cluster.
Internal stellar dynamics affect not only the shape of a cluster, but also its size. Steller evaporation results in a reduction of number of member stars, and the cluster responds by expansion in radius and hence a decrease in stellar density. This is clearly shown in Fig. 9 for which older clusters tend to be larger in size and less dense in stellar density. Young open clusters are born to be rich in members, amounting to more than stars per cubic parsec. Subsequent dynamical evolution apparently causes them to ”loose up” and become dispersed, with the stellar number density dropping to that comparable to the field in the solar neighborhood, or even lower (for large-height clusters). Because old clusters on average have large scale heights, it is difficult to distinguish from our data unambiguously the distortion effect by aging from that by Galactic tides. Fig. 10 plots the same radius and stellar density of our sample versus the height. The stellar density remains more or less the same for clusters within the disk (height less than pc), yet diminishes markedly with height. The age seems to play a more definite role in the cluster dynamics than Galactic tidal force.
This paper presents our first attempt to delineate the structural evolution as a tool to probe the mass distribution and perhaps the dynamical evolution of our Galaxy. Our sample is too small for firm quantitative inference, but some preliminary conclusions can be drawn. Our study indicates that the shape or morphological structure of a young open cluster is dictated by the initial conditions in the parental molecular cloud and, as the cluster evolves, by both the internal gravitational interaction and external tidal perturbations. Only the initially massive and compact star clusters would have strong enough self-gravitational binding to endure the continuing destructive effects, which intensify near the disk plane and toward the inner parts of the Galaxy. Statistics based on a larger sample of open clusters are obviously needed to quantify, e.g., the time scales, the intricate interplay between cluster evolution (age) and its Galactic location (galacto-centric distance, and height from the Galactic disk).
References
- Adler & Janes (1982) Adler, D. S., & Janes, K. A., 1982, PASP, 94, 905
- Anthony-Twarog et al. (1990) Anthony-Twarog, B. J., Twarog, B. A., Kaluzny, J., Shara, M. M. 1990, AJ, 99, 1504
- Bergond, Leon, & Guibert (2001) Bergond, G., Leon, S., & Guibert, J., 2001, A&A, 377, 462
- Binney & Tremaine (1987) Binney, J., & Tremaine, S., 1987, Galactic Dynamics, pp. 187 (Princeton U. Press)
- Chaboyer, Green & Liebert (1999) Chaboyer, B., Green, E. M., & Liebert, J. 1999, AJ, 117, 1360
- Chen, et al. (2003) Chen, L., Hou, J. L., & Wang, J. J., 2003 AJ, 125, 1397
- Chen & Chen (2002) Chen, W.P. & Chen, C.W. 2002, IAU/APRM proceedings
- Curry (2002) Curry, C. L., 2002, ApJ, 576, 849
- Danilov & Seleznev (1990) Danilov, V. M., & Seleznev, A. F., 1990, Bull. Inform. CDS, 38, 109
- Danilov (1996) Danilov, V. M., 1996, IAUS, 174, 389
- Dias et al. (2002) Dias, W. S., Alessi, B. S., Moitinho, A., & Lepine, J. R. D. 2002, A&A, 389, 871, updated information in http://www.astro.iag.usp.br/ wilton/
- Durgapal & Pandey (2001) Durgapal, A. K., & Pandey, A. K., 2001, A&A, 375, 840
- Friel (1995) Friel, E. D., 1995, ARA&A, 33, 381
- Friel et al. (2002) Friel, E. D., Janes, K. A., Tavarez, M., Scott, J., Katsanis, R., Lotz, J., Hong, L., Miller, N., 2002, AJ, 124, 2693
- Janes & Phelps (1994) Janes, K. A. & Phelps, R. L., 1994, AJ, 108, 1773
- Jeans (1916) Jeans, J. H., 1916, MNRAS, 76, 567
- Jefferys (1976) Jefferys, W. H., 1976, AJ, 81, 983
- King (1961) King, I., 1961 AJ, 66, 68
- King (1962) King, I., 1962, AJ, 67, 471
- King (1966) King, I., 1966, AJ, 71, 64
- Kontizas et al. (1990) Kontizas, E., Kontizas, M., Sedmak, G., Smareglia, R., Dapergolas, A., 1990, AJ, 100, 425
- Kontizas et al. (1991) Kontizas, E, Kontizas, M, Sedmak, G, & Smareglia, R, 1991, IAUS 148, 234
- Kałużny (1994) Kałużny, J. 1994, Acta Astron., 44, 247
- Lada & Lada (2003) Lada, C. & Lada, E. 2003, ARA&A,
- Leonard (1988) Leonard, P. J. T. 1998, AJ, 95, 108
- Lyngä (1987) Lyngä, G., 1987, Catalogue of open cluster data, computer-based catalogue, 5th edition.
- Lyngä & Palous (1987) Lyngä, G., & Palous, J., 1987, A&A, 188, 35
- McClure, Forrester, & Gibson (1974) McClure, R. D., Forrester, W. T., Gibson, J. 1974, ApJ, 189, 409
- Meyan & Mayor (1986) Meyan, G., & Mayor, M., 1986, A&A, 166, 122
- Nilakshi et al. (2002) Nilakshi, N. , Sagar, R., Pandey, A. K., & Mohan, V., 2002, A&A, 383, 153
- Oort (1979) Oort, J. H., 1979, A&A, 78, 312
- Pandey, Mahra, & Sagar (1990) Pandey, A. K., Mahra, H. S., & Sagar, R., 1990, AJ, 99, 617
- Phelps et al. (1994) Phelps, R. L., Janes, K. A., & Montgomery, K. A., 1994, AJ, 1994, 107, 1079
- Portegies Zwart et al. (2001) Portegies Zwart, S. F., McMillan, S. L. W., Hut, P., Makino, J., 2001, MNRAS, 321, 199
- Salarism, Weiss, & Percival (2004) Salarism, M., Weiss, A., Percival, S. M. 2004, A&A, 414, 163
- Tadross (2003) Tadross, A. L., 2003, New Astro., 8, 737
- Tadross et al. (2002) Tadross, A. L., Werner, P., Osman, A., & Marie, M., 2002, New Astro., 7, 553
- Vogt & Moffat (1972) Vogt, N., Moffat, A. F. J. 1972, A&AS, 7, 133
- White & Shawl (1987) White, R. E., & Shawl, S. J., 1987, ApJ, 317, 246
- Yadav & Sagar (2001) Yadav, R. K. S., Sagar, R. 2001, MNRAS, 328, 370
| Name | age | ||||||||
|---|---|---|---|---|---|---|---|---|---|
| (°, °) | (pc) | (pc) | (yr) | (arcmin) | (arcmin) | ||||
| NGC 2420 | (198.11,+19.63) | 3085 | 1036 | 9.05 | 0.12 | 0.06 | 11.60 | 3.72 | 468 |
| NGC 2506 | (230.56,+09.93) | 3460 | 597 | 9.05 | 0.26 | 0.15 | 10.42 | 3.48 | 1091 |
| NGC 1893 | (173.59,-01.68) | 3280 | -96 | 6.75 | 0.32 | 0.51 | 6.13 | 4.11 | 645 |
| King 5 | (143.74,-04.27) | 1900 | -141 | 9.00 | 0.43 | 0.21 | 4.86 | 2.65 | 329 |
| NGC 6791 | (69.96,+10.90) | 5853 | 1107 | 9.64 | 0.20 | 0.09 | 8.60 | 3.90 | 1180 |
| Berkeley 17 | (175.65,-03.65) | 2700 | -172 | 10.08 | 0.51 | 0.21 | 8.19 | 4.23 | 373 |
| Melotte 71 | (228.95,+04.50) | 3154 | 247 | 8.37 | 0.51 | 0.12 | 10.13 | 3.83 | 659 |
| NGC 1245 | (146.65,-08.93) | 2876 | -446 | 8.70 | 0.24 | 0.02 | 10.21 | 4.40 | 629 |
| Berkeley 69 | (174.44,-01.79) | 2860 | -89 | 8.95 | 0.30 | 0.28 | 3.79 | 3.08 | 110 |
| NGC 1960 | (174.53,+01.07) | 1318 | 25 | 7.47 | 0.32 | 0.23 | 7.60 | 5.65 | 607 |
| King 8 | (176.39,+03.12) | 6403 | 348 | 8.62 | 0.22 | 0.28 | 2.54 | 1.69 | 190 |
| Berkeley 21 | (186.84,-02.51) | 5000 | -219 | 9.34 | 0.06 | 0.14 | 3.84 | 2.55 | 288 |
| NGC 2414 | (231.41,+01.95) | 3455 | 118 | 6.98 | 0.11 | 0.11 | 3.14 | 2.81 | 74 |
| Trumpler 7 | (238.21,-03.33) | 1474 | -86 | 7.43 | 0.40 | 0.61 | 8.60 | 4.56 | 178 |
| NGC 1907 | (172.62,+00.31) | 1556 | 8 | 8.57 | 0.12 | 0.24 | 4.19 | 3.33 | 55 |
| NGC 2421 | (236.27,+00.07) | 2181 | 3 | 7.37 | 0.14 | 0.12 | 4.16 | 3.70 | 335 |
| NGC 1817 | (186.20,-13.10) | 1972 | -447 | 8.61 | 0.43 | 0.37 | 13.92 | 9.92 | 239 |
| NGC 2567 | (249.80,+02.96) | 1677 | 87 | 8.47 | 0.44 | 0.18 | 7.51 | 4.02 | 290 |
| Ruprecht 18 | (239.93,-04.94) | 1056 | -91 | 7.65 | 0.27 | 0.22 | 6.84 | 6.29 | 411 |
| NGC 2354 | (238.37,-06.79) | 4085 | -483 | 8.13 | 0.28 | 0.23 | 3.35 | 1.95 | 51 |
| Berkeley 39 | (223.46,+10.09) | 4780 | 837 | 9.90 | 0.18 | 0.04 | 7.76 | 3.55 | 424 |
| NGC 2425 | (231.50,+03.30) | 4053 | 233 | 9.20 | 0.37 | 0.20 | 3.23 | 2.59 | 372 |
| NGC 2383 | (235.27,-02.46) | 1655 | -71 | 7.17 | 0.47 | 0.28 | 4.58 | 2.95 | 258 |
| NGC 2355 | (203.39,+11.80) | 2200 | 450 | 8.85 | 0.13 | 0.21 | 7.47 | 4.04 | 343 |
| NGC 2158 | (186.63,+01.78) | 5071 | 158 | 9.02 | 0.11 | 0.07 | 7.43 | 2.89 | 1455 |
| NGC 2194 | (197.25,-02.35) | 3781 | -155 | 8.52 | 0.10 | 0.21 | 7.35 | 4.14 | 925 |
| NGC 2204 | (226.01,-16.11) | 2629 | -730 | 8.90 | 0.36 | 0.26 | 8.27 | 4.16 | 311 |
| NGC 2304 | (197.20,+08.90) | 3991 | 617 | 8.90 | 0.17 | 0.12 | 3.16 | 2.20 | 186 |
| Tombaugh 2 | (232.83,-06.88) | 13260 | -1588 | 9.01 | 0.11 | 0.13 | 2.90 | 2.46 | 95 |
| IC 348 | (160.40,-17.72) | 320 | -97 | 6.80 | 0.47 | 0.10 | 8.53 | 3.87 | 269 |
| NGC 1931 | (173.90,+00.28) | 3086 | 15 | 7.00 | 0.15 | 0.44 | 4.13 | 2.71 | 316 |