The Molecular and Dust Envelope of HD 56126
Abstract
We present millimeter interferometry images of the CO J=1-0 line emission arising in the circumstellar envelope of HD 56126 (a.k.a. IRAS 07134+1005), which is one of the best studied 21-m proto-planetary nebulae (PPNs). The CO emission extends from 1.2″ to 7″ in radius from the central star and appears consistent with a simple expanding envelope, as expected for a post-AGB star. The CO envelope is very clumpy with no apparent fast wind to explain these microstructures that must have arisen during the AGB mass-loss. We quantitatively model the molecular envelope using a radiative transfer code that we have modified for detached shells. Our best fit model reveals that two sequential winds created the circumstellar envelope of HD 56126: an AGB wind that lasted 6500 years with a mass-loss rate of M⊙ yr-1 and a more intense superwind that lasted 840 years with a mass-loss rate of M⊙ yr-1 and that ended the star’s life on the AGB 1240 years ago. The total mass of this envelope is 0.059 M⊙ which indicates a lower limit progenitor mass for the system of 0.66 M⊙, quite reasonable for this low-metallicity star which probably resides in the thick disk of the Galaxy. Comparison with images of the dust emission reveal a similar structure with the gas in the inner regions. Using 2-Dust , we model the dust emission of this source so that the model is consistent with the CO emission model and find a total dust mass of M⊙, a superwind dust mass-loss rate of M⊙ yr-1, and an AGB dust mass-loss rate of M⊙ yr-1. We derive an average gas-to-dust mass ratio of 75, which is consistent with ISM values, but low for what most consider for carbon stars. Our results indicate that TiC nanocrystals are probably not the carrier of the 21-m feature.
1 Introduction
The proto-planetary nebula (PPN) stage of intermediate mass (0.8–8.0 M⊙) stellar evolution is a very short lived (1000 years) phase occurring after the asymptotic giant branch (AGB) and before a planetary nebula (PN) is formed (Kwok, 1993; van Winckel, 2003). A sub-class of PPN are characterized by an unidentified infrared feature at 21 m and have been dubbed the 21-m PPNs (Kwok, Volk, & Hrivnak, 1989; Volk, Kwok, & Hrivnak, 1999). von Helden et al. (2000) have proposed nanocrystals of titanium carbide (TiC) to be the carrier of the 21-m feature. However, in order to create TiC high densities are required in the circumstellar environment and that means high mass loss rates, on the order of M⊙ yr-1. In fact, von Helden et al. (2000) suggest that the entire circumstellar envelope was created in a singular catastrophic mass loss event.
HD 56126 (a.k.a. IRAS 07134+1005) is one of the best studied 21-m PPN. The central star is variable with a period of 36.8 days indicating a mass of 0.6 M⊙ (Barthes et al., 2000). Abundance analysis by Van Winckel & Reyniers (2000) reveals a metal poor star with less than solar Fe abundance, but with solar or greater than solar abundances of C, N, O and s-process elements indicating the star experienced third dredge-up when it was on the AGB. Indeed, it is considered a carbon rich source and has evidence for near-IR bands attributed to polycyclic aromatic hydrocarbons (PAHs) in addition to its strong 21-m feature (Volk, Kwok, & Hrivnak, 1999). Optical HST images of HD 56126 reveal a bright central star surrounded by a low surface brightness elliptical nebula (Ueta, Meixner, & Bobrowsky, 2000). The many mid-IR images (Meixner et al., 1997; Dayal et al., 1998; Jura, Chen, & Werner, 2000; Kwok, Volk, & Hrivnak, 2002) of HD 56126 reveal a detached shell with two peaks aligned on an east-west axis that has been interpreted by some as limb brightened peaks of an equatorial density enhancement (Meixner et al., 1997; Dayal et al., 1998). Recent near-IR imaging polarimetry of HD 56126 reveal a thin (both geometrically and optically), limb-brightened, and well-structured shell with an equatorial density enhancement (Ueta, Murakawa, & Meixner, 2004). Despite these many beautiful images of the dust there are no published images of the circumstellar gas emission which has been detected in several CO transitions (Zuckerman, Dyck, & Claussen, 1986; Bujarrabal, Alcolea, & Planesas, 1992; Knapp et al., 1998, 2000) and in the CI 609 m line (Knapp et al., 2000). All current mass loss rate estimates are based on the dust emission with assumed gas-to-dust mass ratios.
In order to determine the structure of the molecular envelope and to constrain the gas mass-loss rate history of HD 56126, we have pursued imaging of the CO J=1-0 line. Here we present the results of this new imaging study (sections 2 and 3). A quantitative analysis of these images and previously published higher CO transitions using a radiative transfer code is presented in section 4. In section 5, we derive the dust mass and mass-loss rate history in a consistent fashion with the CO modeling. We discuss the implications of our observations and models in section 6. We summarize our conclusions in section 7.
2 BIMA Observations
Using the Berkeley-Illinois-Maryland Association (BIMA111Operated by the University of California, Berkeley, the University of Illinois, and the University of Maryland, with support from the National Science Foundation) millimeter array (Welch et al., 1996), we observed HD 56126 in the CO J=1-0 transition at 115.2712 GHz in the A, B, C and D array configurations. We used a 7-point hexagonal mosaic with overlapping fields with offsets of 30″ to ensure uniform sensitivity to structure within the central 110″ and to have a HPBW of 160″. The center of this mosaic was R.A.(J2000) = 07h 16m 10.3s and Dec. (2000) = +09°59′48″, which is 063 east of the position of the central star, R.A.(J2000) = 07h 16m 10.26s and Dec. (2000) = +09°59′48″, (Ueta, Meixner, & Bobrowsky, 2000). The correlator was configured to cover a bandwidth of 50 MHz, resulting in a velocity coverage of 128 km s-1 with a spectral resolution of 1 km s-1. The final images contain just B, C, and D array configuration data, because no signal was detected in A array and thus we do not discuss the A array further. The dates of observation included were: 31 Mar. 2001, 29 Apr. 2001, 7 May 2001 (C array); 16 Jun. 2001, 7 Jul. 2001 (D array); and 2 Mar. 2002 (B array). The phase calibrator for all arrays was quasar 0739+016, which was chosen from the BIMA phase/amplitude calibrator list. The flux calibrator was Saturn for D array and Jupiter for C and B array. The system temperature for the included observations ranged from 300 K to 1000 K. The uv coverage ranged from 2.3 to 85 k. Using the MIRIAD software package (Sault, Teuben, & Wright 1995), we followed standard data calibration, imaging and deconvolution procedures. Robust weighting with a robust parameter was used to weight the visibility data for images, resulting in a beam size of 3.5″ 2.9″. As a final step, we used an iterative self-calibration procedure on the data to remove some residual phase errors. We analyzed the data further using standard routines in MIRIAD.
3 BIMA Results
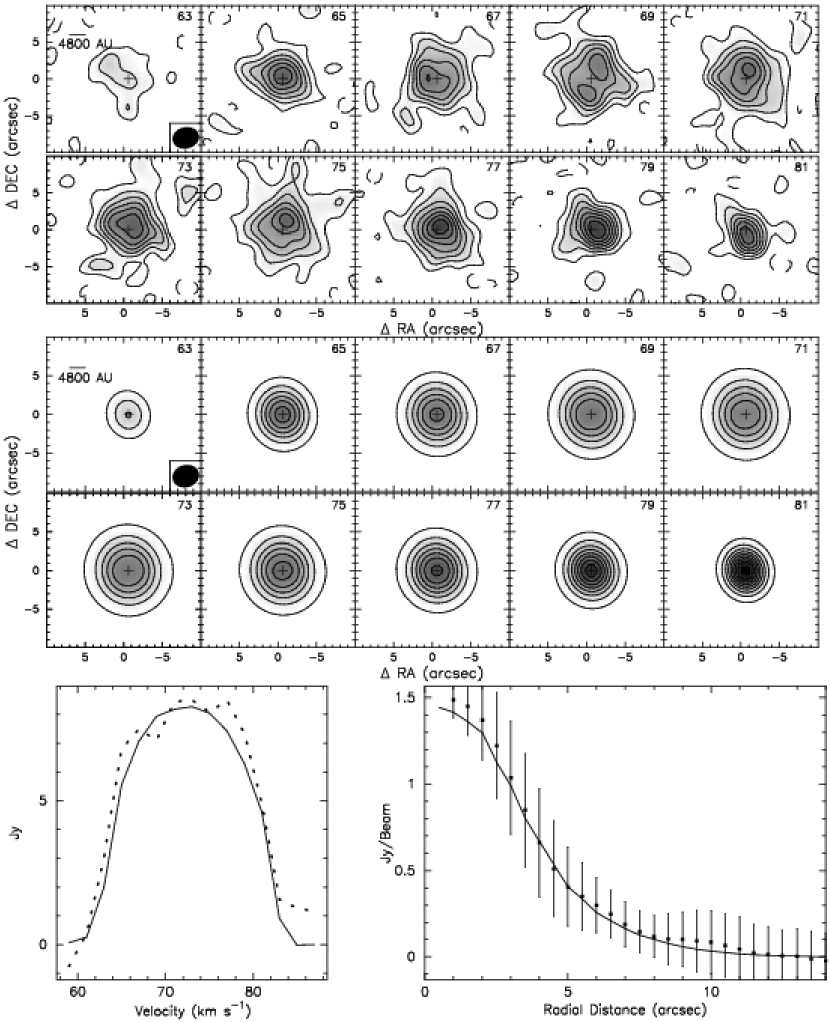
Our BIMA observations (Figure 1; Table 1) reveal the entire molecular envelope down to the sensitivity limit listed in Table 1. In particular, they are not missing flux due to the lack of compact spacings because our total flux of the CO J=1-0 line is consistent with the single dish telescope measurement (Bujarrabal, Alcolea, & Planesas, 1992) within a 30% absolute flux calibration error. We also made pure continuum maps using the lower sideband data; however, finding no emission, we only report an upper limit in Table 1.
The BIMA channel maps reveal a clumpy, molecular envelope expanding away from the star at V km s-1, which is measured as the half width at zero intensity level (Fig. 1). The most blue- and red- shifted channels show a compact CO emission structure which increases in size as one approaches the central channel maps as one expects from an expanding envelope. Our systemic velocity,V1 km s-1, is the central velocity of the CO J=1-0 line. The CO is distributed around the central star, marked by the cross, which is located 0.″63 in RA from the map center. A number of clumps in the envelope gives it the appearance of a non-spherical envelope with protrusions and clumps in all directions. The distribution in spatial and velocity directions suggests an almost random distribution of the protrusions and clumps and there appear to be no fast, collimated outflows to create these structures. The total flux line profile is parabolic with no line wings, as expected for simple expanding outflows (Fig. 1). An azimuthal average of the CO emission at the velocity 73 km s-1 reveals an outer radius of 7″ (Fig. 1).
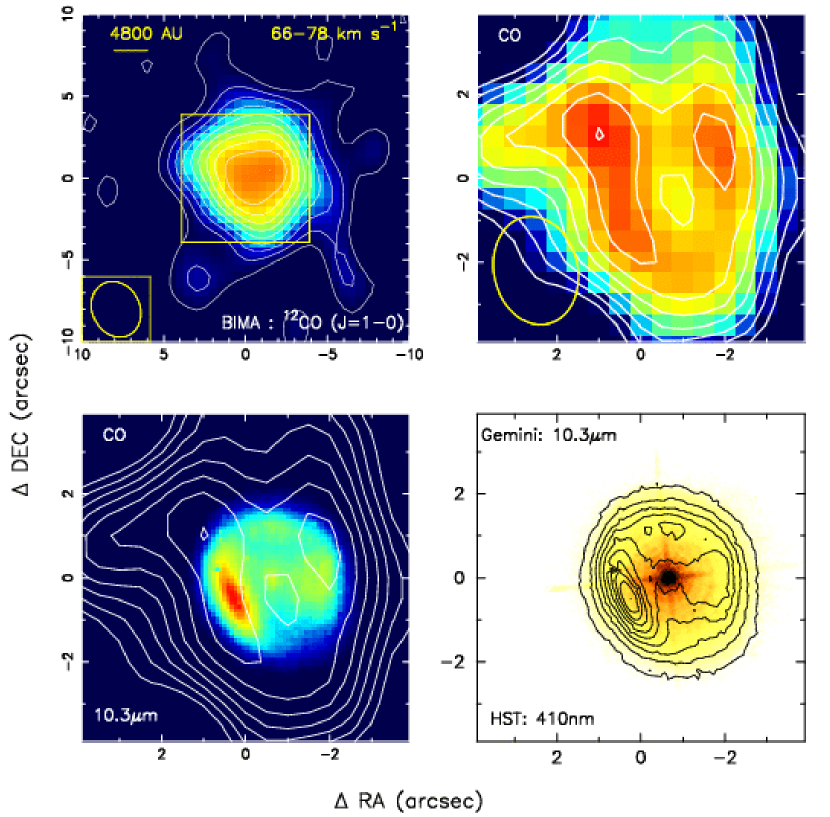
Figure 2 shows a comparison of CO emission averaged over the velocity range 66 to 78 km s-1 with the mid-infrared thermal dust emission (Kwok, Volk, & Hrivnak, 2002) and the dust-scattered light from the circumstellar shell (Ueta, Meixner, & Bobrowsky, 2000). We average over this velocity range because the dust emission is a projection of all the emission along the line of sight. The warm dust emission is completely contained within the larger CO emission. The combined B, C and D array data does not have sufficient angular resolution to resolve the inner cavity. Thus, we have made a higher angular resolution (2.6″ 2.0″) map using only B array data that covers the velocity channels 6678 km s-1 (Fig. 2). Direct comparison of this B-array image with the mid-infrared images of the dust shell thermal emission reveal a cavity quite similar in size and morphology in both the molecular gas and dust. Based on this comparison, we conclude that the inner edges of the dust and molecular gas envelopes are identical. In particular, the central star is located in a clear depression at the center of both gas and dust tracers with an angular inner radius of ″. We measure our inner radius as half of the distance between the two emission peaks to the east and west of the central star. This approach results in a slightly larger value than the 0.″8 adopted by Kwok, Volk, & Hrivnak (2002). Our model calculations, described below, support our value for the radius.
HD 56126 has been observed with single dish telescopes in the CO J=2-1 line (Knapp et al., 1998), the CO J=4-3 line (Knapp et al., 2000) and the [CI] 609 m line (Knapp et al., 2000). The detection of the [CI] 609 m line emission is particularly interesting because it indicates the photodissociation of molecules in the envelope. Knapp et al. (2000) suggest that the [CI] arises from the dissociation of CO due to shocks from a fast wind because the central star, F5 Iab, is too cool to photodissociate the CO. However, our results indicate that the CO is not dissociated because it has the same inner radius as the dust emission. Instead, we suggest that the [CI] is created by the photodissociation of C2H2 which is expected to be the next most abundant molecule to CO in carbon rich sources and which has been suggested as the source for [CI] emission in AFGL 2688 (Fong et al., 2001). The photodissociation potential of C2H2, 6.2 eV, is much lower than that of CO, 11 eV, and at a Teff = 7250 K approximately 1% of HD56126’s bolometric luminosity has sufficient energy to dissociate C2H2 making this avenue quite plausible (Fong et al., 2001). If photodissociation produces [CI] emission, then photodissociation most likely influences the energetics of the molecular gas and the CO emission in the circumstellar environment of HD 56126.
4 CO Modeling
In order to constrain the gas mass loss history of HD 56126, we have modeled the CO J=1-0 BIMA data cube, and the CO J=2-1 and J=4-3 line profiles of Knapp et al. (1998) and Knapp et al. (2000), respectively.
4.1 Model code
In order to model this proto-planetary nebula, we have adapted the radiative transfer code of Justtanont, Skinner, & Tielens (1994) that was originally constructed for AGB star circumstellar envelopes which have molecular gas extending from the photosphere to the outer circumstellar envelope. For proto-planetary nebulae, the mass loss ended some time ago creating a detached shell, such as we observe in HD 56126. We have modified the possible density profiles to include a gap at the center and multiple episodes of mass loss and have modified the code to properly handle the gap. The density, , as a function of radius, R, follows the relations
where Ṁ is the mass loss rate, is the expansion velocity, F is the factor by which mass loss was higher or lower in the past, is the inner radius, is the superwind radius, and is the outer radius of the envelope.
The gas temperature, , as a function of radius, R, was also modified to allow for an inner gap and different power laws over the different mass loss episodes with sudden drops at the boundaries.
The gas temperature, , at the inner radius, , drops with respect to radius as a power law with an exponent, , until the superwind radius, . At , the temperature can drop by a factor of and then continue to drop with respect to radius as a power law with a different exponent, . Figure 3 shows the temperature and density profiles that we adopted for HD 56126 and that we discuss below.
4.2 Model Parameters
Table The Molecular and Dust Envelope of HD 56126 lists the assumed and derived properties in the CO radiative transfer model. Some of the assumed properties, e.g. the distance, are taken directly from the literature. While others, e.g. the CO/H2 ratio, are derived from information in the literature. The stellar radius, R∗, is used as the unit of scaling for the size of the dust shell and we derive this radius from the luminosity, L∗, and effective temperature, Teff, in our dust modeling. The inner and outer radii are constrained by our BIMA CO J=1-0 line images. Using the CO J=1-0 line to constrain the model, and checking with the CO J=4-3 and J=2-1 lines , we refine the values for the expansion velocity, Vexp = 10.5 km s-1, and systemic velocity, VLSR = 73 km s-1.
HD 56126 is considered a carbon rich source with a C/O 1.0 (Van Winckel & Reyniers, 2000). In the molecular gas, we assume most of the carbon and oxygen is contained in CO. Van Winckel & Reyniers (2000) derived a photospheric carbon abundance of [C/H] = 0.1 which is defined with respect to solar abundances. Converting this value to a number density of carbon with respect to hydrogen by using the solar abundances of Grevesse (1989), we find a carbon number density, C/H, of . In the circumstellar molecular envelope, the H becomes H2 and the C becomes CO. Thus the CO/H2 because the molecular hydrogen number density is now half that of the C which has become CO. This value is on the high side but within the – range assumed for carbon rich sources by Knapp & Morris (1985). Changes in the CO/H2 will result in a linearly proportional change in the final mass and mass-loss rate values.
The output parameters are model results constrained by the CO observations. The CO emission depends upon the adopted temperature and density profiles (Fig. 3).The mass-loss rates are directly related to the density profile. We ran over 80 models adjusting primarily the parameters that describe the temperature and density profiles. We started with the simplest of models, single, constant mass loss rate and single power law temperature. However, finding it inadequate, we gradually increased the model’s complexity until the data were adequately fit.
While simple power laws for the temperature profiles are appropriate for AGB stars, we find something different for this PPN which has markedly different energetics than an AGB circumstellar envelope. The temperature profile could not be described by a single power law since this would overestimate the CO J=1-0 if we fit the CO J=4-3 line or underestimate the CO J=4-3 line if we fit the CO J=1-0 emission. The best fit temperature profile required distinct temperature laws for the superwind region and the AGB wind region (Fig. 3). In the superwind region, close to the central star, the gas has a temperature constrained to be 150 K, the inner temperature of the dust shell, because we assume the gas and dust are in thermal equilibrium. The gas temperature then drops steeply with a power law of 2.0. At the superwind radius, RSW, the gas temperature suddenly drops by a factor of 0.43 (FT). In the following AGB wind region, the gas temperature is low, 20 K, and rather flat, with a power law of 0.43. These two distinct temperature profiles crudely describe two different physical processes that dominate the energetics of the two regions.
In the superwind region, the gas temperature is governed by the photodissociation region (PDR) created by the central star. The presence of [CI] 609 m emission argues for photodissociation in the inner edge of the envelope. Fong et al. (2001) presented a PDR model for carbon rich proto-planetary nebulae and convincingly explained the atomic fine structure line emission of PPN as arising from a PDR. The shape of our temperature profile (Fig. 3) is a crude approximation to the shape of the temperature profile predicted by Fong et al.’s PDR model (their Fig. 7) which includes chemistry and balances the heating and cooling of the gas. At the inner edge, the temperature is the highest because the photo-electric heating is most effective nearest to the star. Collisional heating of the gas by warm dust grains is a secondary heating mechanism for the gas. The temperature decreases radially because the photo-electric heating and the dust temperature both decrease with radius.
In the AGB wind region, the sudden decrease in temperature in our model may be explained by the sudden decrease in density (see below) which would reduce the effectiveness of either heating process. The outer AGB wind region temperature is governed by a PDR created by the ISRF. The flatness of the temperature law in the AGB wind region crudely approximates the flatter or perhaps rising gas temperature expected by photoelectric heating by the interstellar radiation field (ISRF). Evidence for this effect has been found in the detailed models for the carbon star, IRC+10216 (e.g. by Huggins, Olofsson, & Johansson, 1988), and for PPN, AFGL 618 (Meixner, Campbell, Welch, & Likkel, 1998).
The density profile could not be defined by a single, constant mass-loss rate (Fig. 3). Instead we adopted the two mass-loss epochs approach, i.e. superwind and AGB wind, that have been required in our previous CO modeling efforts of evolved stars (Meixner, Campbell, Welch, & Likkel, 1998; Fong et al., 2002). In the case of HD 56126, the CO J=1-0 radial intensity profile (Fig. 1) required a sudden drop in intensity at a radius of 7.2 cm (2″), which we define as the superwind radius, RSW. The superwind mass-loss rate interior to this radius is substantially higher than the AGB mass-loss rate exterior to this radius. Both the superwind mass-loss rate and AGB mass-loss rate are constant for their duration. We note that other PPN and young-PN that have been modeled in CO have also required a superwind and AGB wind to fit the data (Meixner, Campbell, Welch, & Likkel, 1998).
We derive the time scales by dividing the size of the regions by the expansion velocity, Vexp. The dynamical age, tdyn, is the time since the star left the AGB and corresponds to the inner radius, Rin, of the gas and dust shell. The SW duration is the time scale during which the star lost mass at the superwind mass-loss rate and corresponds to RSW–Rin. Finally, the AGB duration is the time scale during which the star lost mass at the AGB mass-loss rate and corresponds to RAGB–RSW.
4.3 Model results
In order to compare the model results with the BIMA data cubes, we have made a data cube of the model CO J=1-0 line emission, read it into MIRIAD and convolved it with the same clean beam parameters as the BIMA data as previously done in Fong et al. (2002). For comparison with the CO J=2-1 and J=4-3 line transitions that were observed with single dish telescopes, we created a line profile with the line flux spatially weighted by a single dish beam profile comparable to the observed beam. We subtracted the systemic velocity from the observed CO J=2-1 and J=4-3 line profiles so we compare them on the velocity scale relative to a systemic velocity. The results of the best fit model are compared with the CO data in Figures 1 and 4.
The model fits, within the observed errors, the average properties of the CO J=1-0 line emission. In particular the model’s approximate size of the CO emission in the channel maps and the azimuthally averaged radial profile of the systemic velocity, 73 km s-1, are in good agreement. The total flux line profile, which sums all the flux in each channel map, also has good agreement between the data and model. However, the clumps in the molecular gas surrounding HD 56126 are responsible for most of the disagreement between the data and observations. Modeling these clumps is beyond the scope of this work.
The model CO J=4-3 line profile agrees reasonably with the data except that it is somewhat wider in velocity at the half maximum flux points. However, the model CO J=2-1 line profile is higher than the data by 50%. We tried many iterations on the modeling to improve the agreement; however, forcing the model to fit the CO J=2-1 observations causes the model to be discrepant with the J=1-0 line data or the J=4-3 line data or both. This discrepancy between our model CO J=2-1 line profile may suggest a more intricate temperature profile is needed, because our profile only mimics a photodissociation region profile, but it doesn’t result from an energy balance solution. Alternatively, the discrepancy could be due to an observational pointing error on the source. Mapped images of HD 56126 in the higher CO transitions, such as are now possible with submillimeter arrays, will be necessary to improve the modeling or to check the observations.
5 Dust Model
We use 2-Dust ,222The 2-Dust code is a general purpose 2-D dust radiative transfer code and is publicly available (See http://www003.upp.so-net.ne.jp/ueta/research/2dust/ or http://homepage.oma.be/ueta/research/2dust/ for details). which is described in detail by Ueta & Meixner (2003), to model the dust radiative transfer in this source and to derive dust mass-loss rate parameters. Our main goal is to derive a dust shell model that is consistent with the CO observations and reproduces the images of dust emission and scattering and the spectral energy distribution (SED) in an approximate manner. Because our CO model is restricted to spherical symmetry while 2-Dust allows an axial symmetry, we define consistency between the two models as having the same sizes for Rin, RSW and Rout and the same mass loss recipe (); however, we do not expect identical morphologies.
Table The Molecular and Dust Envelope of HD 56126 lists the input and output parameters. In addition, we adopt the dust optical constants for three kinds of amorphous carbon species as described by Zubko, Mennella, Colangeli, & Bussoletti (1996) and assumed the power-law plus an exponential fall-off size distribution (Kim, Martin, & Hendry, 1994). We correct the model SED for interstellar extinction as described by Mathis (1990). Input parameters are adopted whenever possible from independent measurements. The output parameters, which are results from the best-fit model as constrained by the observed SED and images, quantify the geometry of the mass loss, i.e. density function parameters A, B, C, D, E, and F, (cf. Ueta & Meixner, 2003); the equatorial opacity, ; temperature, Tin(dust); mass, Mdust; and mass-loss rates, ṀSW(dust) and ṀAGB(dust), of the dust.
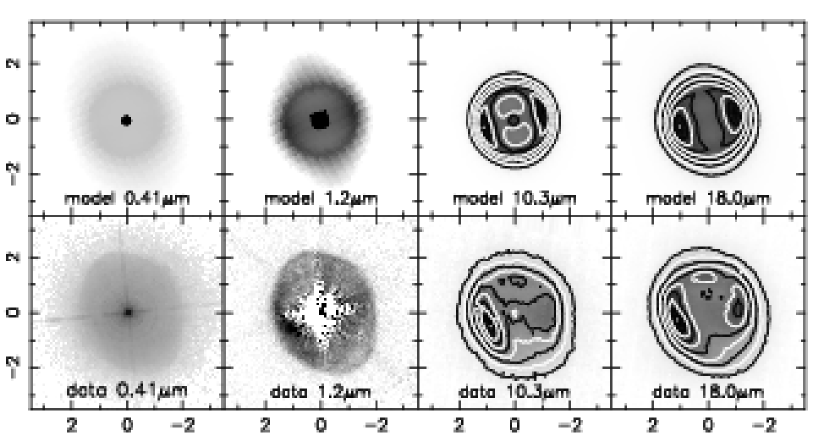
Figure 5 compares model images of dust scattered light (410 nm and 1.2 m) and thermal dust emission (10.3 and 18.0 m). The comparison between model and observed images over a wide spectral range from optical to mid-IR is quite reasonable and an improvement over our initial work in Meixner et al. (1997). The improvement is due to a more detailed density function, defined in (Ueta & Meixner, 2003), and a more realistic description of the optical properties of dust grains, which allows the distribution of grain size and the use of multiple grain species. Figure 6 shows that the model SED and the observed photometry and spectroscopy are in reasonably good agreement. The SED fit is comparable to that in Meixner et al. (1997) although much better constrained by the data. The SED fit in the IR part of the spectrum is not as good as that by Hony, Tielens, Waters, & de Koter (2003), who focused on the dust composition of the source and included MgS and TiC in addition to the amorphous carbon in order to fit the 30 m and 21-m features in the spectrum: we used only amorphous carbon. Despite our differences in dust composition, our final total dust mass, M⊙, is within 10% of Hony, Tielens, Waters, & de Koter (2003), because the amorphous carbon dominates their dust mass. Our dust opacity along the equatorial plane, , and dust temperature at the inner radius on the equatorial plane, Tdust, are comparable to values by Meixner et al. (1997). When corrected for the differences in distance and dust-to-gas mass ratio, our superwind dust mass-loss rate, ṀSW(dust) M⊙ yr-1, is slightly higher (110%) than that derived by Meixner et al. (1997) and our AGB dust mass-loss rate, ṀAGB(dust) M⊙ yr-1, is substantially higher (factor of 7). Nevertheless, our dust mass is significantally smaller (30%) than that of Meixner et al. (1997) because the size of our dust shell is constrained to be much smaller by the CO observations.
6 Discussion
6.1 Circumstellar Envelope
The mass-loss rates derived from the CO modeling, Ṁ M⊙ yr-1 and Ṁ M⊙ yr-1, are compatible with mass-loss rates measured for AGB stars, but two orders of magnitude lower than the highest mass-loss rate measured in superwinds of proto-planetary nebulae, e.g. the Egg nebula (Skinner et al., 1997). Our values are consistent with that of Jura, Chen, & Werner (2000) and of Meixner et al. (1997), when scaled for distance. However, it is lower by a factor of 10 from Hony, Tielens, Waters, & de Koter (2003) because they assumed a more compact shell than we measure in the CO and because they assume a gas-to-dust ratio (222) that is three times higher than we derive.
The total mass of the observed molecular envelope is 0.059 M⊙ which is a lower limit to the total mass lost by the star because the outer radius of the CO emission is limited by photodissociation from the interstellar radiation field. Adding this circumstellar mass to the central star mass of 0.6 M⊙ (Barthes et al., 2000) results in a lower limit to the progenitor mass of HD 56126 of 0.66 M⊙ which is consistent with the low-metallicity of the central star that is probably a member of the thick disk of our Galaxy. HD 56126 is clearly on the lower mass end of intermediate mass stars that may pass through the planetary nebula phase.
6.2 Gas-to-Dust Mass ratio
We can derive an average gas-to-dust mass ratio by dividing the total gas mass by the total dust mass as determined by our independent, but consistent models of the gas and dust shells. We find a gas-to-dust mass ratio of 75 which is close to values typically assumed for the interstellar medium but lower than what has been assumed for carbon stars, 222 (Jura, 1986). If we were to derive the gas-to-dust mass ratio separately for the superwind and AGB wind, we find a higher gas-to-dust mass ratio of 160 for the superwind compared to a value of 50 for the AGB wind. This difference may suggest that the AGB wind was more dust rich than the superwind. However, because the CO model assumes spherical symmetry and the dust model assumes a toroidal symmetry, the differences between AGB and super winds are tentative, at best.
6.3 TiC as the carrier of the 21-m feature
Two results from our study show a lack of support for TiC as the interpretation for the 21-m feature. Firstly, the size of the circumstellar shell is at least twice as large as claimed by Hony, Tielens, Waters, & de Koter (2003), thus the mass was not lost all at once in a catastrophic event. Secondly, the gas mass-loss rates, Ṁ M⊙ yr-1 and Ṁ M⊙ yr-1, are one to two orders of magnitude smaller than required by von Helden et al. (2000) to create a high enough density environment in which to produce TiC.
Our results support two other works which have cast doubt on TiC as the carrier of the 21-m feature. Li (2003) rules it out on the basis of the Kramers-Kronig physical principle. Chigai et al. (2003) claim that TiC is implausible as a carrier because it would require a Ti/Si abundance ratio 5 times that of solar to create the strength of the 21-m compared to the 11.3 m SiC feature and, the most likely case of TiC-core-carbonaceous-mantle grains exhibit only a weak 21-m feature.
However, despite these failings of TiC nanocrystals to explain the 21-m feature, the proposal by von Helden et al. (2000) has opened up a set of possible candidates: nanocrystals containing carbon. Recently two proposals with nanocrystals claim to produce a 21-m feature. Speck & Hofmeister (2004) show some laboratory spectra of SiC nanocrystals which show a 21-m feature. Jones (2004) have proposed nano-diamonds to explain the 21-m feature. Nano-crystals make some sense in that this feature is found primarily in proto-planetary nebulae where the rapid changes in the central star wreck havoc on its circumstellar environment which could cause the existence of very small grains. In any case, the 21-m feature carrier remains a mystery.
7 Conclusions
-
1.
The CO emission reveals a resolved, but clumpy molecular envelope that extends to 7″ in radius.
-
2.
Comparison of the CO images and mid-IR images of dust emission shows identical inner radii demonstrating that the CO is not photodissociated; however, C2H2 probably is dissociated and responsible for the [CI] 609 m line emission.
-
3.
The gas mass-loss rate was M⊙ yr-1 during the superwind phase and M⊙ yr-1 during the AGB phase. The dust mass-loss rate was M⊙ yr-1 during the superwind phase and M⊙ yr-1 during the AGB phase.
-
4.
The total gas mass of the circumstellar shell is 0.059 M⊙ and dust mass is M⊙, which is consistent with HD 56126 being a lower mass proto-planetary nebula.
-
5.
The average gas-to-dust mass ratio is 75, comparable to that typically assumed for the ISM.
-
6.
TiC nanocrystals are implausible carriers of the 21-m features. The 21-m feature’s carrier remains a mystery.
References
- Barthes et al. (2000) Barthes, D., Lebre, A., Gillet, D., & Mauron, N. 2000 A&A, 310, 893
- Bujarrabal, Alcolea, & Planesas (1992) Bujarrabal, V., Alcolea, J., & Planesas, P. 1992, A&A, 257, 701
- Chigai et al. (2003) Chigai, T., Yamamoto, T., Kaito, C., & Kimura, Y. 2003, ApJ, 587, 771
- Dayal et al. (1998) Dayal, A., Hoffmann, W. F., Bieging, J. H., Hora, J. L., Deutsch, L. K., & Fazio, G. G. 1998, ApJ, 492, 603
- Fong et al. (2001) Fong, D., Meixner, M., Castro-Carrizo, A., Bujarrabal, V., Latter, W. B., Tielens, A. G. G. M., Kelly, D. M., & Sutton, E. C. 2001, A&A, 367, 652
- Fong et al. (2002) Fong, D., Justtanont, K., Meixner, M., & Campbell, M. T. 2002, A&A, 396, 581
- Grevesse (1989) Grevesse, N. 1989, AIP Conf. Proc. 183: Cosmic Abundances of Matter, 183, 9
- Hony, Tielens, Waters, & de Koter (2003) Hony, S., Tielens, A. G. G. M., Waters, L. B. F. M., & de Koter, A. 2003, A&A, 402, 211
- Hrivnak, Kwok, & Volk (1989) Hrivnak, B. J., Kwok, S., & Volk, K. M. 1989, ApJ, 346, 265
- Huggins, Olofsson, & Johansson (1988) Huggins, P. J., Olofsson, H., & Johansson, L. E. B. 1988, ApJ, 332, 1009
- Jones (2004) Jones, A. 2004 Astrophysics of Dust, Estes Park, Colorado, May 26–30, 2003. Edited by Adolf N. Witt., B. Draine and G. Clayton, in press
- Jura (1986) Jura, M. 1986, ApJ, 303, 327
- Jura, Chen, & Werner (2000) Jura, M., Chen, C., & Werner, M. W. 2000, ApJ, 544, L141
- Justtanont, Skinner, & Tielens (1994) Justtanont, K., Skinner, C. J., & Tielens, A. G. G. M. 1994, ApJ, 435, 852
- Kim, Martin, & Hendry (1994) Kim, S.-H., Martin, P. G., & Hendry, P. D. 1994, ApJ, 422, 164
- Knapp & Morris (1985) Knapp, G. R. & Morris, M. 1985, ApJ, 292, 640
- Knapp et al. (1998) Knapp, G. R., Young, K., Lee, E., Jorissen, A. 1998, ApJS, 117, 209
- Knapp et al. (2000) Knapp, G. R., Crosas, M., Young, K., & Ivezić, Ž. 2000, ApJ, 534, 324
- Kwok (1993) Kwok, S. 1993, ARA&A, 31, 63
- Kwok, Volk, & Hrivnak (1989) Kwok, S., Volk, K. M., & Hrivnak, B. J. 1989, ApJ, 345, L51
- Kwok, Volk, & Hrivnak (2002) Kwok, S., Volk, K., & Hrivnak, B. J. 2002, ApJ, 573, 720
- Li (2003) Li, A. 2003, ApJ, 599, L45
- Mathis (1990) Mathis, J. S. 1990, ARA&A, 28, 37
- Meixner et al. (1997) Meixner, M., Skinner, C. J., Graham, J. R., Keto, E., Jernigan, J. G., & Arens, J. F. 1997, ApJ, 482, 897
- Meixner, Campbell, Welch, & Likkel (1998) Meixner, M., Campbell, M. T., Welch, W. J., & Likkel, L. 1998, ApJ, 509, 392
- Skinner et al. (1997) Skinner, C. J. et al. 1997, A&A, 328, 290
- Sault et al. (1995) Sault, R. J., Teuben, P. J., Wright, M. C. H. 1995, in ASP Conf. Ser. 77, Astronomical Data Analysis Software and Systems IV, ed. R. A. Shaw, H. E. Payne, & J. J. E. Hayes, (San Francisco: ASP), 433
- Speck & Hofmeister (2004) Speck, A. K. & Hofmeister, A. M. 2004,ApJ, 600, 986
- Ueta, Meixner, & Bobrowsky (2000) Ueta, T., Meixner, M., & Bobrowsky, M. 2000, ApJ, 528, 861
- Ueta & Meixner (2003) Ueta, T. & Meixner, M. 2003, ApJ, 586, 1338
- Ueta, Murakawa, & Meixner (2004) Ueta, T., Murakawa, K., & Meixner, M. 2004, in preparation.
- Van Winckel & Reyniers (2000) Van Winckel, H. & Reyniers, M. 2000, A&A, 354, 135
- van Winckel (2003) Van Winckel, H. 2003, ARA&A, 41, 391
- Volk, Kwok, & Hrivnak (1999) Volk, K., Kwok, S., & Hrivnak, B. J. 1999, ApJ, 516, L99
- von Helden et al. (2000) von Helden, G., Tielens, A. G. G. M., van Heijnsbergen, D., Duncan, M. A., Hony, S., Waters, L. B. F. M., & Meijer, G. 2000, Science, 288, 313
- Welch et al. (1996) Welch, W. J., et al. 1996, PASP, 108, 93
- Zubko, Mennella, Colangeli, & Bussoletti (1996) Zubko, V. G., Mennella, V., Colangeli, L., & Bussoletti, E. 1996, MNRAS, 282, 1321
- Zuckerman, Dyck, & Claussen (1986) Zuckerman, B., Dyck, H. M., & Claussen, M. J. 1986, ApJ, 304, 401
| Parameter | Value |
|---|---|
| RA (2000)11The star is located 063 west of the map center at RA (2000) = 07:16:10.26 and DEC (2000) = 09:59:48.0 | 07:16:10.3 |
| DEC (2000)11The star is located 063 west of the map center at RA (2000) = 07:16:10.26 and DEC (2000) = 09:59:48.0 | 09:59:48.0 |
| Beam size | 3.5″ 2.9″ |
| PA | 16.4° |
| Noise per chan | 0.15 Jy Beam-1 |
| BIMA CO Flux | 140 Jy km s-1 |
| Single Dish Flux22Bujarrabal, Alcolea, & Planesas (1992) | 110 Jy km s-1 |
| Chan width | 2 km s-1 |
| VLSR | 73 km s-1 |
| Vexp | 10 km s-1 |
| 1″ | |
| 7″ | |
| continuum (2.6 mm, 3) | mJy |
| Parameter | Value | Ref. |
|---|---|---|
| Input: | ||
| D | 2.4 kpc | 1 |
| R∗ | 3.45 cm | 1,2,3 |
| C/O | 1.0 | 2 |
| CO/H2 | 2,3 | |
| Rin | 4.3 cm | 3 |
| Rout | 3.0 cm | 3 |
| VLSR | 73 km s-1 | 3 |
| Vexp | 10.5 km s-1 | 3 |
| Output: | ||
| RSW | 7.2 cm | 3 |
| Tin | 150 K | 3 |
| FT | 0.43 | 3 |
| 2.0 | 3 | |
| 0.25 | 3 | |
| ṀSW | M⊙ yr-1 | 3 |
| ṀAGB | M⊙ yr-1 | 3 |
| ṀAGB/ṀSW | 0.17 | 3 |
| Mgas | 0.059 M⊙ | 3 |
| tdyn | 1240 yr | 3 |
| SW duration | 840 yr | 3 |
| AGB duration | 6570 yr | 3 |
| Parameter | Value | Ref. and Notes |
|---|---|---|
| Input: | ||
| D | 2.4 kpc | 1 |
| Spec Type | F1-2I | 2 |
| Teff | 7250 K | 2 |
| L∗ | 6090 L⊙ | 1 |
| R∗ | 3.45 cm | 3 |
| Rin | 4.3 cm | 3 |
| RSW | 7.2 cm | 3 |
| Rout | 3.0 cm | 3 |
| Vexp | 10.5 km s-1 | 3 |
| ISM AV | 0.5 | 4 |
| tdyn | 1240 yr | 3 |
| SW duration | 840 yr | 3 |
| AGB duration | 6570 yr | 3 |
| Output: | ||
| 0.025 | 3 | |
| Tin(dust) | 150 K | 3 |
| amin, amax | 0.001, 0.01 m | 3,5 |
| A,B,C,D,E,F | 3,2,2.5,3,3,1.5 | 3,6 |
| Ṁequator/Ṁpole | 4 | 3 |
| inclination angle | 80° | 3 |
| ṀSW(dust) | M⊙ yr-1 | 3 |
| ṀAGB(dust) | M⊙ yr-1 | 3 |
| ṀAGB/ṀSW(dust) | 0.5 | 3 |
| Mdust | M⊙ | 3 |
| Mgas/Mdust | 75 | 3 |
References. — (1) Hony, Tielens, Waters, & de Koter (2003) (2) Van Winckel & Reyniers (2000) (3) this work (4) Meixner et al. (1997) (5) We adopt the size distribution function of the form for (Kim, Martin, & Hendry, 1994). (6) A-F are parameters in the density function defined in equation 1 of Ueta & Meixner (2003).