Massive Star Populations in Wolf-Rayet Galaxies
Abstract
We analyze longslit spectral observations of fourteen Wolf-Rayet galaxies from the sample of Schaerer, Contini & Pindao (1999). All 14 galaxies show broad Wolf-Rayet emission in the blue region of the spectrum, consisting of a blend of NIII, CIII, CIV, and HeII emission lines, which is a spectral characteristic of WN stars. Broad CIV emission, termed the red bump, is detected in 9 galaxies and CIII is detected in 6 galaxies. These emission features are due to WC stars. We derive the numbers of late WN and early WC stars from the luminosity of the blue and red bumps, respectively. The number of O stars is estimated from the luminosity of the H emission line, after subtracting the contribution of WR stars. The Schaerer & Vacca 1998 (hereafter SV98) models predict that the number of WR stars relative to O stars, , increases with metallicity. For low metallicity galaxies, the results agree with predictions of evolutionary synthesis models for galaxies with a burst of star formation, and indicates an IMF slope -2 in the low metallicity regime. For high metallicity galaxies our observations suggest a Salpeter IMF () and an extended short burst. The main possible sources of error are the adopted luminosities for single WCE and WNL stars. We also report, for the first time, NGC 450 as a galaxy with WR characteristics. For NGC 450, we estimate the number of WN and WC stars. The number ratio , and the equivalent widths of the blue bump, , and of the red bump, in NGC 450 are also in good agreement with the instantaneous burst model prediction for WR galaxies.
keywords:
galaxies: Starburst — galaxies: abundances — galaxies: evolution.1 Introduction
Wolf-Rayet galaxies are extragalactic objects whose spectra show direct signatures similar to those observed in Wolf-Rayet (WR) stars. The most common characteristic is the presence of a broad HeII feature (the blue bump) originating in the stellar winds of WR stars (Schaerer Contini & Pindao 1999, hereafter SCP99). WR galaxies have long been known, with the first discovery of such spectral features in the blue compact galaxy He 2-10 (Allen, Wright & Goss 1976). The concept of WR galaxies was introduced by Osterbrock & Cohen (1982, hereafter OC82) and Conti (1991).
The blue WR bump is often blended with nearby nebular emission lines of He, Fe, or Ar, and can show several broad stellar emission components (NIII, CIII, HeII) which are difficult to deblend in most low- or medium-resolution spectra. These features originate in WR stars of WN and/or WC subtypes (OC82 and Conti 1991). The strongest emission line in WC stars is CIV, which is very weak in WN stars. This “red W-R bump” has only rarely been observed. Where the data is available, CIV is generally weaker than HeII.
In more distant galaxies, WR stars can only be indirectly detected, by observing the integrated spectra of the galaxies. Strong star formation activity indicates the presence of a large number of massive stars, most of which evolve through the WR phase. At a given stage of the starburst, many WR stars appear, but only for a brief duration. Thus, the presence of WR features in these galaxies indicates recent star formation (10 Myr) as well as the presence of massive stars () (Schaerer et al. 1999). This provides interesting constraints on recent star formation episodes in these objects (Maeder & Conti 1994). Furthermore, metallicity plays an important role in regulating the lower mass limit above which a star passes through the WR phase.
Despite their small number compared to other massive stars, especially in low-metallicity galaxies, WR stars are numerous enough for their integrated emission to be detected. In this paper, we shall follow OC82 and Conti (1991): A WR galaxy is classified as such if its integrated spectrum shows detectable WR broad features emitted by unresolved stellar clusters.
The compilation of Conti (1991) included only 37 objects. Since then, the number of cataloged WR galaxies has increased rapidly, with more than 130 known today (Guseva, Izotov & Thuan 2000, hereafter GIT00; SCP99). WR galaxies do not form a homogeneous class, exhibiting a variety of morphologies. Among the WR galaxies we find low-mass blue compact dwarf (BCDs), irregular galaxies, massive spirals and ultra-luminous merging IRAS galaxies. Recent studies show that WR features are also seen in LINERs and Seyfert 2 galaxies (OC82; Ho et al. 1995; Heckman et al. 1997; Schmitt et al. 1998 and Contini et al. 2001). The possibility of detecting WR stars in central cluster galaxies out to a redshift of is discussed in Allen (1995).
The number of WR stars relative to massive stars is highly dependent on metallicity. Theoretical evolutionary models predict that at fixed metallicity, the ratio between WR and other massive stars varies strongly with the age of the starburst (Mass-Hesse & Kunth 1991; Maeder 1991; Maeder & Meynet 1994; Meynet 1995; SV98). The maximum value of this ratio decreases from 1 to 0.02 when the metallicity decreases from to (GIT00). Similarly, the duration of the WR stage in the starburst also decreases with decreasing metallicity. Hence, the number of galaxies with extremely low metallicity containing WR stellar populations is expected to be small.
GIT00 derived the number of WCE and WNL stars from the luminosity of the red and blue bumps, respectively, and the number of O stars from the H luminosity, for 39 WR galaxies with heavy element mass fractions between 1/50 and twice solar. In their sample, the blue bump consists of an unresolved blend of WR and nebular lines. They proposed a new technique to derive the number of WNL stars using NIII and SiIII emission lines. They found that the relative number of Wolf-Rayet stars NWR/N(O+WR) and NWC/NWN derived from observations are in satisfactory agreement with theoretical predictions (SV98). The results obtained for the extremely metal-poor galaxies disagree with model predictions likely due to the low emission line luminosity for WCE stars in metal-poor models.
Schaerer et al. (2000, hereafter SGIT00), using five metal rich objects from GIT00 and new results on Mrk 309, attempted to constrain the properties of massive star populations and star formation histories by comparing their observations with evolutionary synthesis models. They found that extended burst durations of Myr or a superposition of several bursts were required to produce the observed WR population and red supergiant features. The burst durations are longer than those obtained for other objects in Schaerer et al. (1999) using the same models.
Pindao et al. (2002) analyzed the spectra of 85 high metallicity disk HII regions of nearby spiral galaxies. In contrast with previous studies of low metallicity galaxies, they found smaller values of I(WR)/I(H) than predicted from evolutionary models at corresponding metallicities. They suggested the use of two WR luminosity regimes to correct the model predictions.
The goal of our study of these 14 galaxies is to search for and confirm the presence of WN and WC stars in galaxies with different metallicities, and to compare the results obtained for this sample with predictions from evolutionary synthesis models (SV98) and starbust99 (Leitherer et al. 1999). We also report NGC 450 as a newly classified WR galaxy.
The paper is structured as follows: the observations and procedures used to reduce the data are described in §2. In this section we also discuss corrections for reddening and underlying absorption affecting the emission lines. Section 3 describes how contamination of a starburst spectrum by the presence of SN IIe and AGN is accounted for, while Section 4 explains how the physical parameters of the gas are calculated. The massive star population and constraints on the evolutionary tracks of the starburst regions (age, burst duration, and IMF) are derived in §5 from a comparison with evolutionary synthesis models. Finally, our main results are summarized and discussed in §6.
2 Spectroscopic Observations and Data Reduction
2.1 Observations
We observed 14 galaxies from the sample of Wolf-Rayet galaxies and extragalactic HII regions presented in SCP99. NGC 6764 was observed at two position angles, and , with the former along the major axis of the galaxy and the latter spanning a secondary emission region near the central region. We suspected that WR stars may be present in this region, but the spectra do not confirm this hypothesis.
Data were gathered at two different sites. We used the Palomar 200-inch telescope with the longslit Double Spectrograph (Oke & Gunn 1982) on UT 1999 October 10-11, with the 1200 l/mm grating, blazed at Å, yielding a pixel size of Å in the blue and Å in the red, and a total wavelength coverage of Å. The slit width was set to , resulting in a spectral resolution of Å in the blue and Å in the red. The slit length was 180′′. Additional data were taken at the ESO/NTT telescope using the ESO Multi-Mode Instrument (EMMI) with CCD36 on UT 1999 April 17. The total wavelength coverage was 4000-6600Å. The slit width was set to , resulting in a spectral resolution of Å. The length of the slit was .
The slit was aligned along the major axis of the galaxy when possible, and centered on the brightest region of the target. The journal of observations of all objects in the sample is provided in Table 1. Figures 1(a)-(o) show the images of each galaxy taken from the DSS with the slit position overlaid.
(a)![[Uncaptioned image]](/html/astro-ph/0409114/assets/x1.png) (b)
(b)![[Uncaptioned image]](/html/astro-ph/0409114/assets/x2.png) (c)
(c)![[Uncaptioned image]](/html/astro-ph/0409114/assets/x3.png) (d)
(d)![[Uncaptioned image]](/html/astro-ph/0409114/assets/x4.png)
(e)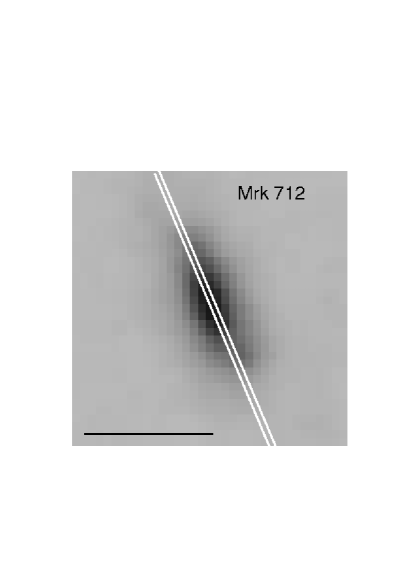 (f)
(f)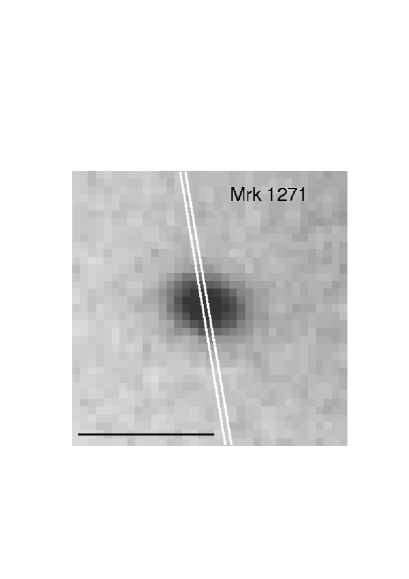 (g)
(g)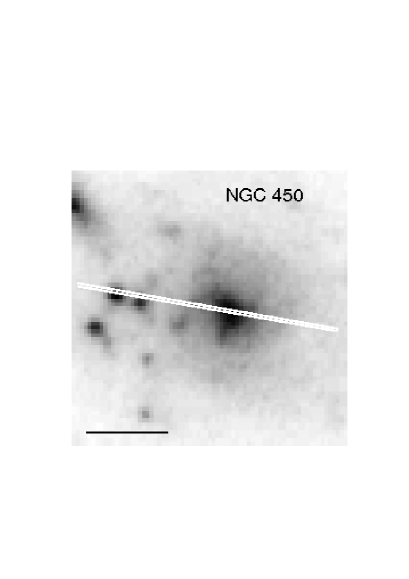 (h)
(h)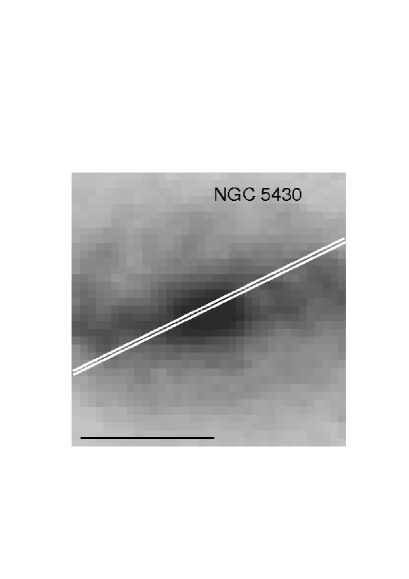
(i)![[Uncaptioned image]](/html/astro-ph/0409114/assets/x9.png) (j)
(j)![[Uncaptioned image]](/html/astro-ph/0409114/assets/x10.png) (k)
(k)![[Uncaptioned image]](/html/astro-ph/0409114/assets/x11.png) (l)
(l)![[Uncaptioned image]](/html/astro-ph/0409114/assets/x12.png)
(m)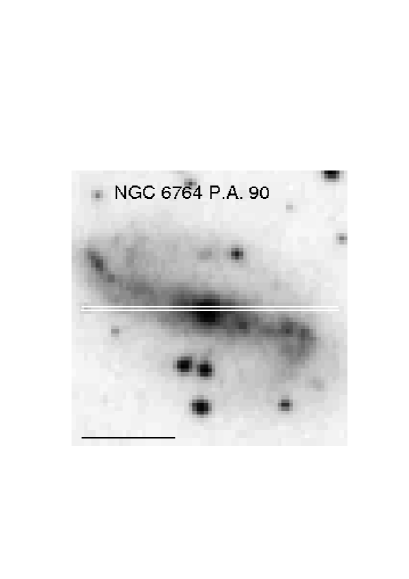 (n)
(n)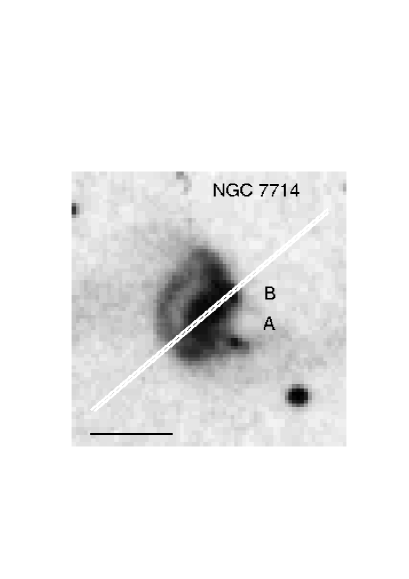 (o)
(o)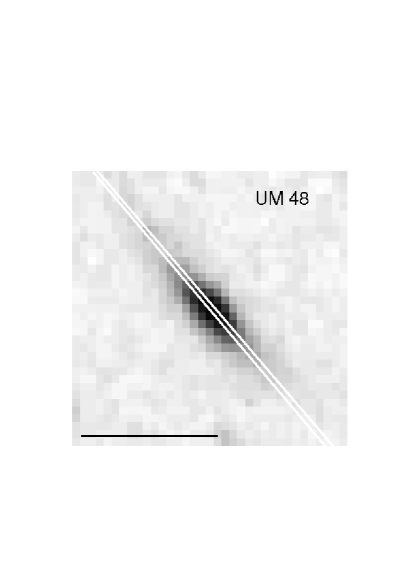
2.2 Data Reduction
Initial data reduction was carried out following standard procedures with the IRAF task . The package includes bias subtraction, flat-field correction, subtraction of the night sky background and bad column removal. The bias level was subtracted from each frame using the overscan region of the CCD chip.
Spectrum extraction was performed using the IRAF task . The task includes correction for atmospheric extinction, wavelength calibration and flux calibration. Cosmic rays were removed using the task with a threshold of .
Spectrophotometric standard stars were observed each night to perform flux calibration. Arc lamps were taken before and after each exposure in order to provide accurate wavelength calibration. An average rms of 0.1Å was obtained for the pixel to wavelength fit using a third order spline.
We use a standard extraction aperture for each object whose width is such that the peak intensity of the H line decreases by from the center, along the spatial direction. This width is set independently for each side of the peak. For objects with more than one emission region, different apertures were set for each knot. With this size we obtain the necessary spectral properties for this study while minimizing possible contamination from the adjacent stellar population.
The signal to noise ratio, S/N, was determined assuming Poisson statistics and using the readout noise and gain of the CCD, the number of combined spectra, and the sky value. For NTT data the readout noise is 5.43e-1 with a gain of 2.18 e-1 per ADU. For the Palomar observations, the readout noise is 8.6 e-1 with a gain of 2.13 e-1 per ADU in the blue channel and 7.5 e-1 and 2.00 e-1 per ADU in the red channel. The values of S/N are given in Table 1 for the NTT, as well as the blue and red parts of the Palomar spectra, where they are averages over a range of 100 Å around 4686Å and 5878Å, respectively.
| Galaxy | Exp. Time | S/N | P.A. | Observat. | Type | D | Scale | mag | ||
|---|---|---|---|---|---|---|---|---|---|---|
| (::) | (::) | () | (Å-1) | () | () | (pc/) | (Band) | |||
| UM 48 | 0:36:10 | 4:38:06 | 1200 | 96/73 | 43 | Palomar | S | 65.22 | 316 | 13.35(J) |
| NGC 450 | 1:15:31 | -0:51:38 | 1500 + 1200 | 90/77 | 80 | Palomar | SAB(s)cd | 22.46 | 109 | 11.40(J) |
| MRK 712 | 9:56:42 | 15:38:04 | 900 | 84 | 108 | NTT | SBbc | 55.87 | 271 | 14.47(B) |
| MRK 1271 | 10:56:08 | 6:10:15 | 900 | 80 | 98 | NTT | Compact | 8.79 | 43 | 14.80(mP) |
| NGC 4385 | 12:25:42 | 0:34:23 | 900 | 96 | 192 | NTT | SB(rs)0+ | 23.35 | 113 | 10.64(J) |
| NGC 4861 | 12:59:00 | 34:50:43 | 1800 + 600 | 160/97 | 19 | Palomar | SB(s)m | 10.93 | 53 | 12.44(J) |
| NGC 5430 | 14:00:46 | 59:19:35 | 1200 | 140/104 | 146 | Palomar | SB(s)b | 40.55 | 197 | 10.01(J) |
| NGC 5471 | 14:04:29 | 54:23:49 | 1200 | 91/75 | 127 | Palomar | HII | 3.86 | 19 | 14.76(J) |
| MRK 475 | 14:39:05 | 23:37:28 | 1800 | 84/70 | 80 | Palomar | BCD | 7.96 | 39 | 15.46(B) |
| Fairall 44 | 18:13:38 | -57:43:59 | 900 | 90 | 105 | NTT | S? pec | 63.62 | 308 | 12.34(J) |
| NGC 6764 | 19:08:15 | 50:55:57 | 1200 | 125/95 | 67/90 | Palomar | SB(s)bc | 31.26 | 152 | 10.56(J) |
| MRK 309 | 22:52:34 | 24:43:50 | 1500 + 1800 | 123/90 | 140 | Palomar | Sa | 167.09 | 810 | 13.05(J) |
| III ZW 107 | 23:30:09 | 25:32:02 | 1800 + 1200 | 125/95 | 175 | Palomar | Sb | 76.50 | 371 | 14.06(J) |
| NGC 7714 | 23:36:13 | 2:09:21 | 1200 | 99/71 | 122 | Palomar | SB(s)b:pec | 37.05 | 180 | 10.77(J) |
() and () coordinates (J2000) are for the slit center. The distance (D) is obtained from the redshift measured directly from the object spectrum using H0 =75 km s-1 Mpc-1. NTT and Palomar indicate the observatory where the object was observed. The object type is obtained from NED. The linear scale is obtained using the computed distance, D. For more details on the quoted magnitudes we refer the reader to the NED-IPAC database.
2.2.1 Reddening Correction and Underlying Balmer Absorption
The reddening correction is obtained from the Balmer line ratios, using the extinction law of Cardelli, Clayton Mathis (1989) (hereafter CCM89), and the theoretical Balmer emission line ratios for case B recombination: = 2.88 and = 0.47 (Brocklehurst 1971). We obtain the color excess, , using the theoretical ratio of Balmer to measurements, according to
| (1) |
In three cases (Mrk 309, Mrk 1271, and Fairall 44) for which is not available, we use solely the measured ratio to obtain the reddening correction using
| (2) |
The resulting color excess is used to correct each spectrum with the IRAF task . E(B-V) is easily converted to using the relation (Vogel et al. 1993).
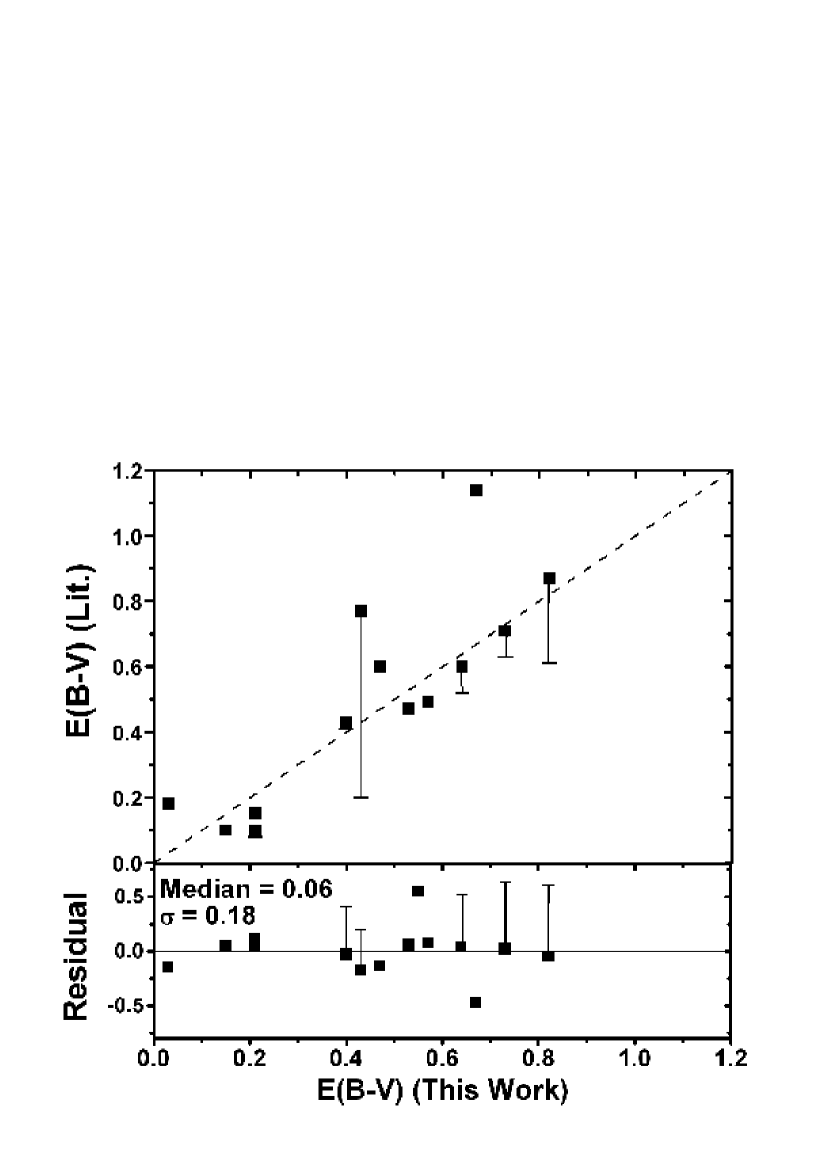
In Table 2 we compare the reddening E(B-V) measured in this work with that obtained by other authors. Furthermore, we have compared our derived color excesses with other measurements taken from the literature in Figure 2. The top panel shows this comparison, while the bottom panel shows the deviations as a function of E(B-V). The median difference is 0.06 with a standard deviation of 0.18.
We note some differences between the values obtained for some of the objects. The spectroscopic results taken from the literature are inhomogeneous in their instrumental accuracy, observational techniques, and the S/N ratios of individual observations. However, it is unlikely that instrumental differences dominate over variations in measured lines intensities due to observing emission from different locations within each galaxy or star formation region, different sized apertures, or slightly different position angles used by the authors.
| Observed | Literature | Reference | |
|---|---|---|---|
| Fairall44 | 0.47 | 0.60 | 5 |
| III Zw 107 | 0.53 | 0.47 | 9 |
| Mrk309 | 0.73 | 0.71, 0.63, 0.70 | 9, 2, 12 |
| Mrk475 | 0.21 | 0.10 | 7 |
| Mrk712 | 0.03 | 0.18 | 3 |
| Mrk1271 | 0.15 | 0.10 | 8 |
| NGC450 | 0.55 | - | - |
| NGC4385 | 0.64 | 0.60, 0.52 | 2, 14 |
| NGC4861 | 0.43 | 0.20, (0.49, 0.62, 0.77) | 2,(1) |
| NGC5430 | 0.67 | 1.14 | 4 |
| NGC5471 | 0.21 | 0.15 | 13 |
| NGC6764 | 0.82,0.80 | 0.61,(0.87) | 10, (6) |
| NGC7714 | 0.40 | (0.39,041), 0.43 | (2), 11 |
| UM48 | 0.57 | 0.49 | 15 |
(1) Barth et al. 1994, (2) Calzetti 1997, (3) Contini et al. 1995, (4) Contini et al. 1997, (5) Durret 1990, (6) Eckart et al. 1996, (7) Izotov et al. 1994, (8) Izotov & Thuan 1998, (9) Gil de Paz et al. 2000, (10) Keel 1982, (11) Mattila & Meikle 2001, (12) Osterbrock & Cohen 1982, (13) Rosa & Bevenuti 1994, (14) Salzer et al. 1989 ,(15) Vogel et al. 1993
After correcting the spectra for the total interstellar extinction using the Balmer line ratios, some objects show ratios lower than the theoretically predicted values. This effect is more significant for objects where the H equivalent width is less than Å (McCall, Rybski & Shields 1985, hereafter MRS85). The consequence of such underlying absorption is an overestimate of the reddening correction, which is then reflected in all the observed emission lines. To correct for this effect, we use the method proposed by MRS85 to compute the equivalent width in absorption, , given by the expression,
| (3) |
The parameter is defined by
| (4) |
and represents the extinction reddening law (CCM89 and MRS85).
In the limit , reaches the theoretical ratio (). In the opposite limit, as approaches unity, the ratio is significantly altered from the theoretical expectation. The corrected equivalent widths of the Balmer lines are obtained by adding to the observed equivalent widths.
The correction in the extinction due to underlying absorption lines, E(B-V)abs, is given by the expression
| (5) |
The value of for each object is listed in Table 3, along with the equivalent widths of the emission lines , and . Reddening and underlying absorption corrected intensities are also given in the same Table.
| Fairall44 | IIIZW107 | MRK309 | MRK475 | Mrk712 | Mrk1271 | |
| [OII]3727 | - | 221312 | 70398 | 10934 | - | - |
| [NeIII]3869 | - | 2595 | - | 362.92.7 | - | - |
| H | 4752 | 4705 | 46646 | 4703 | 4703 | 4708 |
| [OIII]4363 | 269 | 134 | - | 853 | 142 | 6112 |
| HeI4471 | 539 | 495 | 5938 | 422 | 672 | 6115 |
| [FeIII]4656 | 295 | 137 | 13129 | 53 | 143 | 267 |
| HeII4686 | 195 | 39 | - | 174 | - | 3511 |
| [ArIV]4711 | - | 1410 | - | 83 | 82 | - |
| [ArIV]4740 | - | - | - | 73 | - | - |
| HeI4922 | - | 128 | - | 113 | 192 | - |
| [OIII]4959 | 7105 | 12157 | 10425 | 17815 | 16134 | 111512 |
| [OIII]5007 | 20619 | 363218 | 38133 | 532615 | 488111 | 309629 |
| [NI]5199 | - | 317 | - | 43 | 123 | - |
| [FeIII]5271 | - | - | - | 73 | 103 | - |
| [ClIII]5518 | - | 102 | - | 82 | 85 | - |
| [ClIII]5538 | - | 31 | - | 42 | 65 | - |
| [NII]5754 | - | 92 | 3825 | 53 | 73 | - |
| HeI5876 | 1264 | 1292 | 2417 | 991 | 2283 | 1199 |
| [OI]6300 | 486 | 532 | 2622 | 241 | 363 | 6511 |
| [SIII]6313 | 84 | 112 | - | 241 | 243 | 1510 |
| [OI]6364 | 184 | 183 | - | 91 | 123 | 7211 |
| [NII]6548 | - | 982 | - | 332 | 2682 | 8411 |
| H | - | 285514 | - | 28708 | - | 289925 |
| [NII]6584 | - | 2802 | - | 661 | - | 2219 |
| EW(H)(Å) | 32.170.23 | 26.650.35 | 3.000.18 | 73.083.35 | 45.980.21 | 15.420.20 |
| EW(H | 67.640.26 | 65.480.46 | 10.180.79 | 140.500.37 | 139.100.29 | 33.110.28 |
| EW(H | - | 329.60 3.70 | - | 936.2010.98 | - | 109.201.16 |
| EW | - | -0.98 | - | -1.18 | - | -0.69 |
| F(H)(10-14 erg s-1 cm-2) | 3.580.01 | 12.770.06 | 12.81.04 | 7.520.03 | 2.450.02 | 0.720.01 |
| E(B-V) | 0.47 | 0.53 | 0.73 | 0.21 | 0.03 | 0.15 |
| E(B-V)abs | - | -0.012 | - | -0.007 | - | -0.015 |
| Broad Emission Lines | ||||||
| NIII4640 | - | 75 | 16733 | - | 8210 | - |
| HeII4886 | 599 | 6126 | 11520 | 6916 | 987 | 10341 |
| CIII5696 | - | - | 154 | - | - | - |
| CIV5808 | - | - | - | 367 | - | - |
| EW4640(Å) | - | 0.370.38 | 1.360.21 | - | 7.230.98 | - |
| EW4686(Å) | 3.470.56 | 3.602.86 | 0.970.20 | 9.512.35 | 8.670.74 | 3.061.21 |
| EW5696(Å) | - | - | 0.260.05 | - | - | - |
| EW5808(Å) | - | - | - | 8.021.46 | - | - |
| NGC450 | NGC4385 | NGC4861 | NGC5430 | NGC5471 | NGC6764 | |
| [OII]3727 | 16153 | - | 6262 | 149128 | 9192 | 193329 |
| [NeIII]3869 | 2402 | - | 4082 | - | 3992 | 6818 |
| H | 4812 | 4713 | 4702 | 47023 | 4702 | 47012 |
| [OIII]4363 | 272 | 133 | 892 | - | 662 | 218 |
| HeI4471 | 482 | 306 | 372 | 469 | 392 | 4713 |
| [FeIII]4656 | 93 | 356 | 83 | 4923 | 264 | 6922 |
| HeII4686 | - | 144 | 82 | 3210 | 251 | 5415 |
| [ArIV]4711 | 52 | - | 112 | - | 141 | - |
| [ArIV]4740 | - | - | 72 | - | - | - |
| HeI4922 | 132 | - | 52 | - | 91 | - |
| [OIII]4959 | 13683 | 2313 | 18174 | 12910 | 185030 | 1686 |
| [OIII]5007 | 38647 | 6784 | 552111 | 37512 | 558390 | 4848 |
| [NI]5199 | 92 | 193 | 33 | 1212 | - | 8814 |
| [FeIII]5271 | 63 | - | - | - | 22 | - |
| [ClIII]5518 | 61 | - | 42 | 11 | 51 | 75 |
| [ClIII]5538 | 51 | - | 32 | 22 | 62 | - |
| [NII]5754 | 21 | 103 | - | 124 | 32 | 297 |
| HeI5876 | 1311 | 1273 | 921 | 1195 | 1111 | 1236 |
| [OI]6300 | 251 | 254 | 162 | - | 221 | 1597 |
| [SIII]6313 | 151 | 104 | 172 | 6.73.3 | 18.60.7 | - |
| [OI]6364 | 91 | 65 | 51 | 43 | 81 | 678 |
| [NII]6548 | 711 | 5034 | 232 | 44111 | 461 | 72612 |
| H | 28725 | 28848 | 285522 | 283749 | 28665 | 280635 |
| [NII]6584 | 1671 | 14895 | 472 | 120722 | 931 | 191424 |
| EW(H | 93.610.31 | 13.850.09 | 48.250.32 | 13.210.45 | 51.680.18 | 6.580.14 |
| EW(H)(Å) | 320.800.59 | 42.780.11 | 156.800.29 | 40.850.41 | 181.200.29 | 22.460.27 |
| EW(H | 2928.0010.59 | 199.101.66 | 938.005.61 | 264.601.25 | 1028.006.35 | 136.400.90 |
| EW | -0.27 | -2.18 | 0.00 | -0.05 | -0.40 | -0.72 |
| F(H)(10-14 erg s-1 cm-2) | 30.780.06 | 48.630.15 | 103.600.20 | 37.170.63 | 7.730.01 | 59.810.83 |
| E(B-V) | 0.55 | 0.64 | 0.43 | 0.67 | 0.21 | 0.82 |
| E(B-V)abs | -0.001 | -0.039 | 0.000 | -0.001 | -0.002 | -0.027 |
| Broad Emission Lines | ||||||
| NIII4640 | 2116 | 9511 | - | 12726 | - | 16133 |
| HeII4886 | 3114 | 1038 | 5513 | 10518 | 224 | 6321 |
| CIII5696 | - | 3131 | 32 | - | - | 105 |
| CIV5808 | 233 | 6234 | 116 | 4110 | - | 7427 |
| EW4640(Å) | 5.143.80 | 3.530.39 | - | 5.500.94 | - | 2.940.61 |
| EW4686(Å) | 7.613.80 | 3.910.26 | 7.081.75 | 3.610.78 | 3.140.69 | 1.150.57 |
| EW5696(Å) | - | 2.162.12 | 0.810.47 | - | - | 0.300.18 |
| EW5808(Å) | 10.581.60 | 4.552.41 | 3.001.49 | 3.161.77 | - | 3.900.76 |
| NGC6764P.A.90 | NGC7714A | NGC7714B | UM48 | |
| [OII]3727 | 170331 | 19708 | 210710 | 215229 |
| [Ne III]3869 | 13023 | 953 | 2804 | 11115 |
| H | 47115 | 472.43.7 | 469.94.4 | 47216 |
| [O III]4363 | 198 | 13.64.2 | 39.34 | 126 |
| HeI4471 | 59.716.5 | 39.63.5 | 464 | 5418 |
| [FeIII]4656 | 8526 | 305 | 289 | 3523 |
| HeII4686 | 5823 | 61 | 44 | 1216 |
| [ArIV]4711 | - | - | 227 | - |
| [ArIV]4740 | - | - | - | - |
| HeI4922 | - | - | 124 | - |
| [OIII]4959 | 1718 | 49640 | 11806 | 51814 |
| [OIII]5007 | 48411 | 1550140 | 352914 | 156320 |
| [NI]5199 | 7715 | 184 | - | - |
| [FeIII]5271 | - | 274 | 234 | - |
| [ClIII]5518 | 10.79 | 74 | - | - |
| [ClIII]5538 | 4.26 | 74 | - | - |
| [NII]5754 | 207 | 113 | 1110 | - |
| HeI5876 | 997 | 1253 | 1173 | 1255 |
| [OI]6300 | 1568 | 444 | 464 | 3410 |
| [SIII]6313 | - | 84 | 154 | 1511 |
| [OI]6364 | 588 | 146 | 164 | 137 |
| [NII]6548 | 70813 | 3624 | 1314 | 1975 |
| H | 281140 | 2823123 | 2872.212 | 286931 |
| [NII]6584 | 191228 | 9235 | 3344 | 5738 |
| EW(H)(Å) | 6.390.17 | 12.130.08 | 68.880.57 | 9.950.31 |
| EW(H)(Å) | 22.040.30 | 32.990.10 | 191.300.72 | 29.250.31 |
| EW(H)(Å) | 137.700.97 | 98.480.63 | 12.000.01 | 156.301.09 |
| EWabs(Å) | -0.94 | -1.44 | -0.18 | -1.29 |
| F(H)(10-14 erg s-1 cm-2) | 48.980.80 | 86.150.32 | 7.790.03 | 9.320.12 |
| E(B-V) | 0.80 | 0.52 | 0.40 | 0.57 |
| E(B-V)abs | -0.036 | -0.029 | -0.014 | -0.035 |
| Broad Emission Lines | ||||
| NIII4640 | 16139 | 419 | - | - |
| HeII4886 | 6423 | 2210 | 5414 | 5633 |
| CIII5696 | 10.7 | 5.00.6 | - | - |
| CIV5808 | 8129 | 3414 | - | 2212 |
| EW4640(Å) | 2.940.71 | 1.410.25 | - | - |
| EW4686(Å) | 1.200.54 | 0.600.27 | 10.342.92 | 1.500.84 |
| EW5696(Å) | 0.230.17 | 0.220.03 | - | - |
| EW5808(Å) | 3.650.69 | 1.770.08 | - | 1.520.71 |
3 Hard Ionization Sources
The contamination of a starburst by nearby objects such as SN IIe remnants and AGN could occur, producing Wolf-Rayet-like features in the spectrum (Masegosa et al. 1991). Embedded or superimposed supernova remnants (SNRs) can strongly affect the emission-line properties in a predominantly photoionized HII region (, Peimbert, Sarmiento, & Fierro 1991). It is crucial to distinguish between hot stars and other ionizing photon sources. From an observational viewpoint, the presence of shocks in an ionized nebula can be detected by the enhancement of low excitation lines, in particular [OI], [SII] and [NII] (Masegosa et al. 1991).
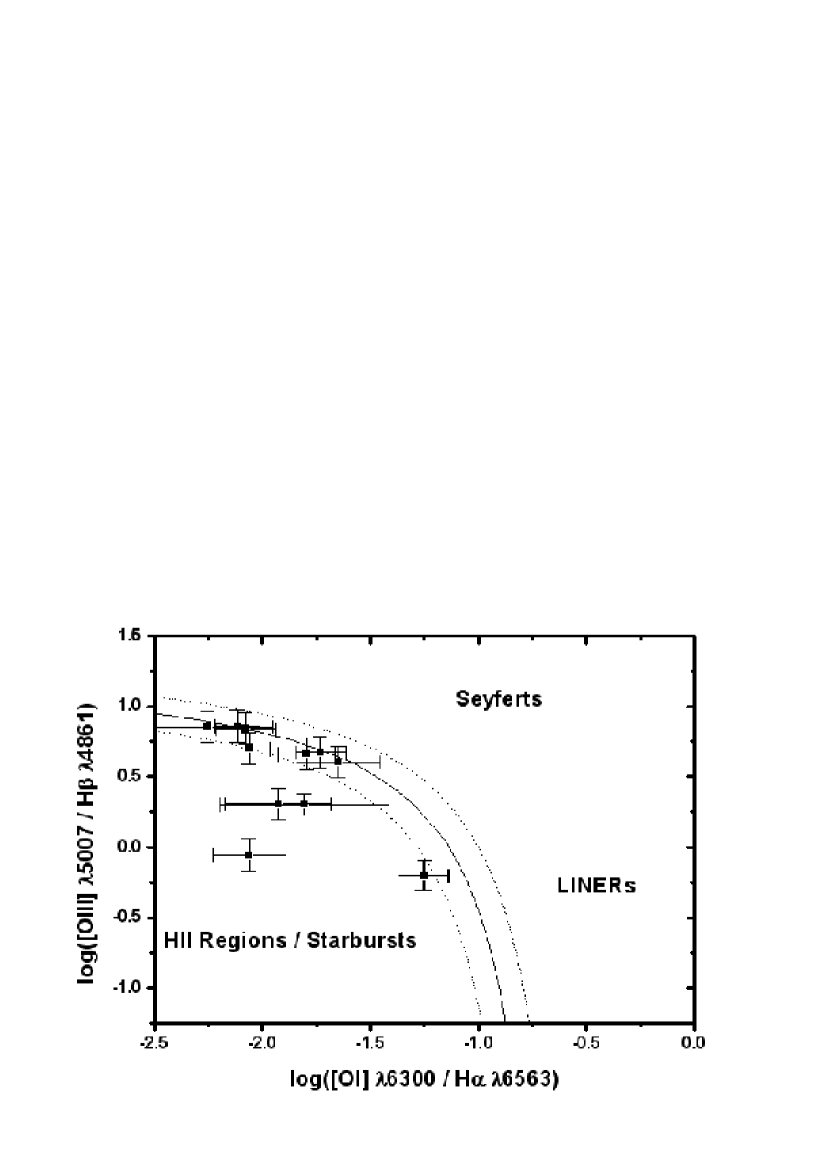
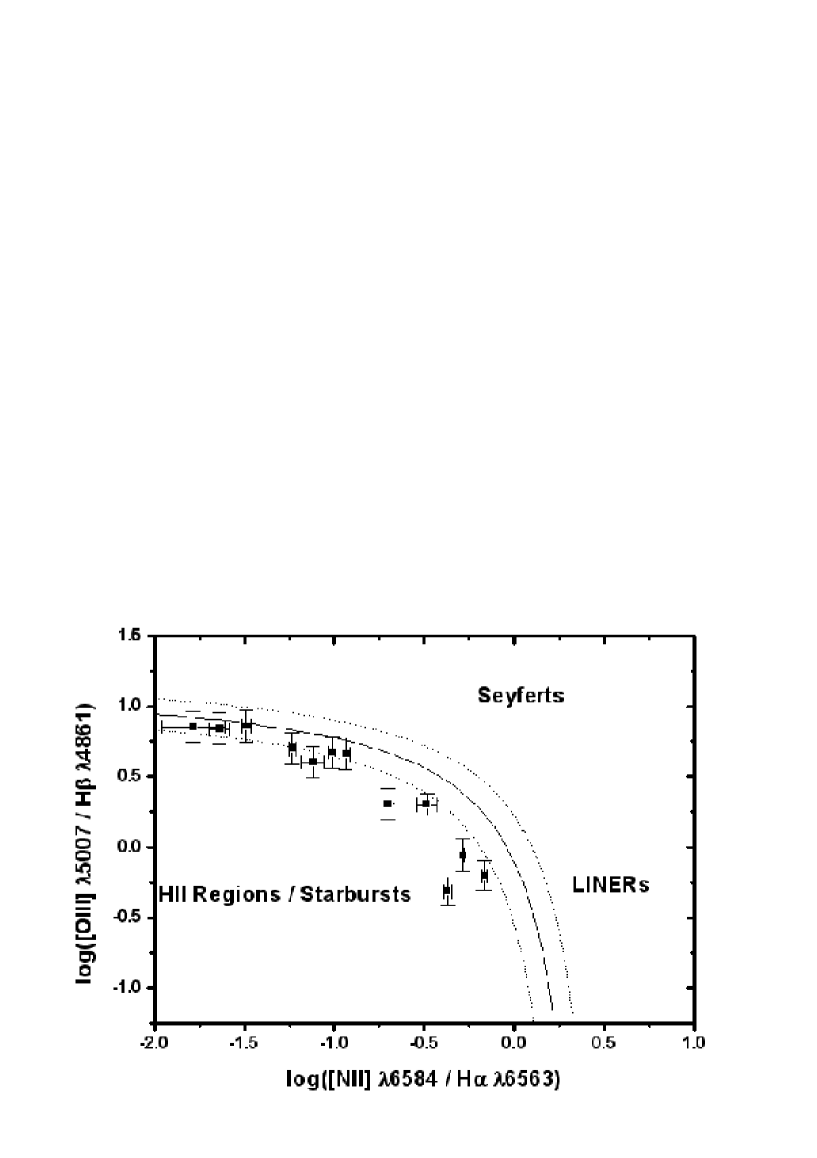
We used Veilleux & Osterbrock (1987) diagnostic diagrams to verify the ionization sources in our galaxy sample. Since [SII] are not available in our spectra, we use diagnostic diagrams plotting [OI]H and [NII]H line ratios against the [OIII]H ratios (Figure 3 and 4).
The theoretical starburst limits shown in Figure 3 and 4 can be parameterized as:
| (6) |
| (7) |
given by Kewley et al. (2001). The error range of their modeling in both planes is 0.1 dex.
All objects in our sample are located in the starburst and HII region loci in the plane of [OI]H and [NII]H versus [OIII]H (Veilleux & Osterbrock 1987), suggesting that the main sources of ionizing photons are stellar, and not AGN.
4 Gas Chemical Abundances
The oxygen abundance O/H is a crucial parameter for our study since one of the main purposes of this paper is to study the massive star populations in galaxies with different metallicities. In order to obtain the chemical abundances of the galaxies in our sample, three subclasses were defined depending on whether or not the [OIII], [OII] and [OIII] features are present (see Kobulnicky et al. 1999):
Class 1. [OIII], [OII] and [OIII] are detected. When [OIII] is detected, the temperature is obtained from the [OIII] line ratio, while the density is measured from the [SII]/[SII] line ratio (McCall 1984). Since our spectra do not include the [SII] lines, we are unable to measure the electron density, and we assume a fiducial value of 150 cm-3 for .
The accuracy of this empirical method depends strongly on an accurate estimate of the electron temperature of the gas (Steigman, Viegas & Gruenwald 1997). The uncertainty in the electron temperature of the gas is directly related to the measurement of the [OIII] line intensity. The oxygen abundance can be obtained by the empirical method first proposed by Peimbert & Costero (1969), which requires knowledge of the gas temperature and density.
Class 2. [OIII] is not detected, while [OII] and [OIII] are detected. For those galaxies where the [OIII] auroral line is not detected, the oxygen abundance is obtained from the empirical calibration suggested by McGaugh (1991) using the known R23 ratio, ([OII]+[OIII].
The relation between oxygen abundance and R23 is double valued, but this degeneracy can be broken. We use the relation between [NII]/[OII] and [NII]/H ratios to break the O/H vs. R23 degeneracy (Contini et al. 2002).
Kobulnicky et al. (1999) provide a polynomial fit to both metal-poor (lower branch),
| (8) |
and metal-rich (upper branch) regimes,
| (9) |
where
| (10) |
and
| (11) |
The calibration has an estimated uncertainty of in log(O/H) (Kobulnicky et al. 1999).
Class 3. [OII] is not detected, but [OIII] and [OIII] are detected (NTT data). It is not possible to break the degeneracy using the [NII]/[OII] and [NII]/H ratios.
In this case, we can derive the electron temperature but not the O/H abundance. We use the temperature obtained from standard nebular analysis to select the appropriate metallicity calibration with which we derive the oxygen abundance. After determining the metallicity regime for each galaxy, we compute the O/H ratio using the upper branch given by Edmunds & Pagel (1984),
| (12) |
for galaxies in the high metallicity regime, and the lower branch
| (13) |
for low metallicity objects. The calibration has an estimated uncertainty of in (Edmunds & Pagel 1984).
Two additional empirical tools were used to obtain the oxygen abundance: the P-R23 calibration, with an estimated uncertainty of 0.10 dex (Pilyugin 2000, 2001a and 2001b), and the [OIII]/[NII] calibration given by Pettini and Pagel (2004), with an uncertainty of 0.25 dex. In particular, for NTT data we use the calibration extrapolated to [OII], where the uncertainty increases to 0.30 dex (Pilyugin 2001a).
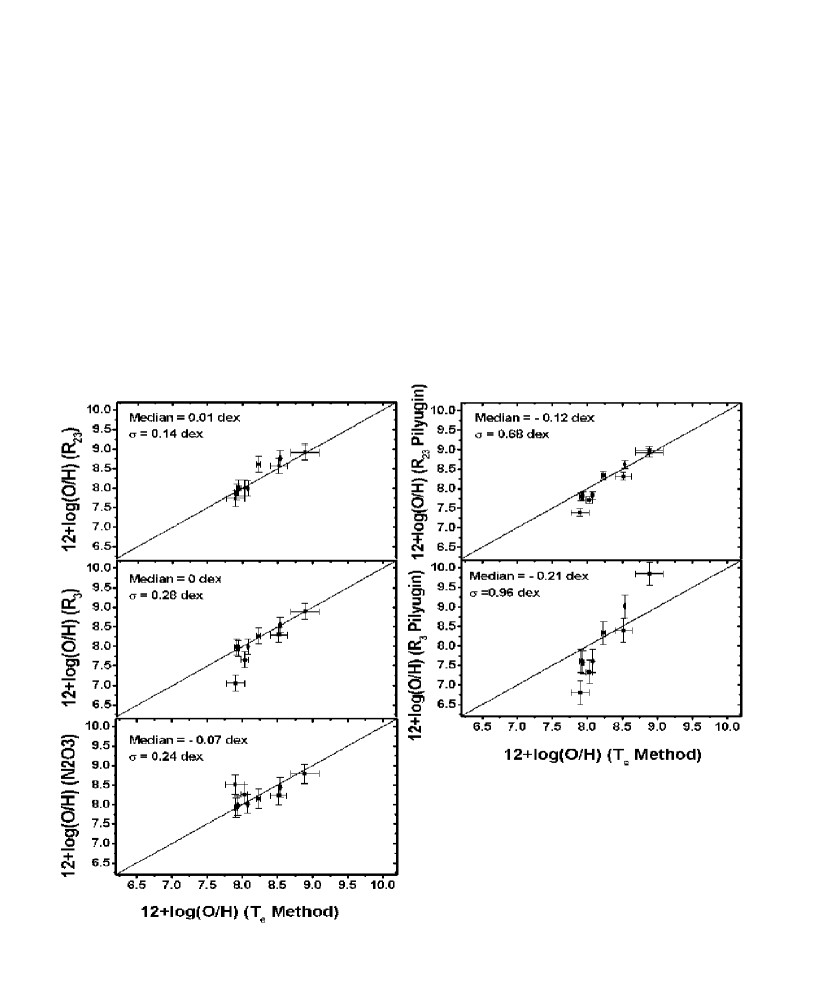
To compare the derived oxygen abundances, we use as many of the methods described above as possible (based on available spectral features) to derive O/H values for all of the galaxies in our sample. Figure 5 shows the comparison between results obtained applying the Te-Method and the other methods used in this work. We see that in the absence of [OIII]4363, use of the electron temperature Te, the R23 method (for Class 2 objects), and the [OIII]/[NII] calibration all provide good determinations of gas abundance. The R3 technique was used only for MRK 712. We find that the R23 and R3 calibrations of Pilyugin do not perform correctly for either high or very low gas abundances, and are therefore not used in this work.
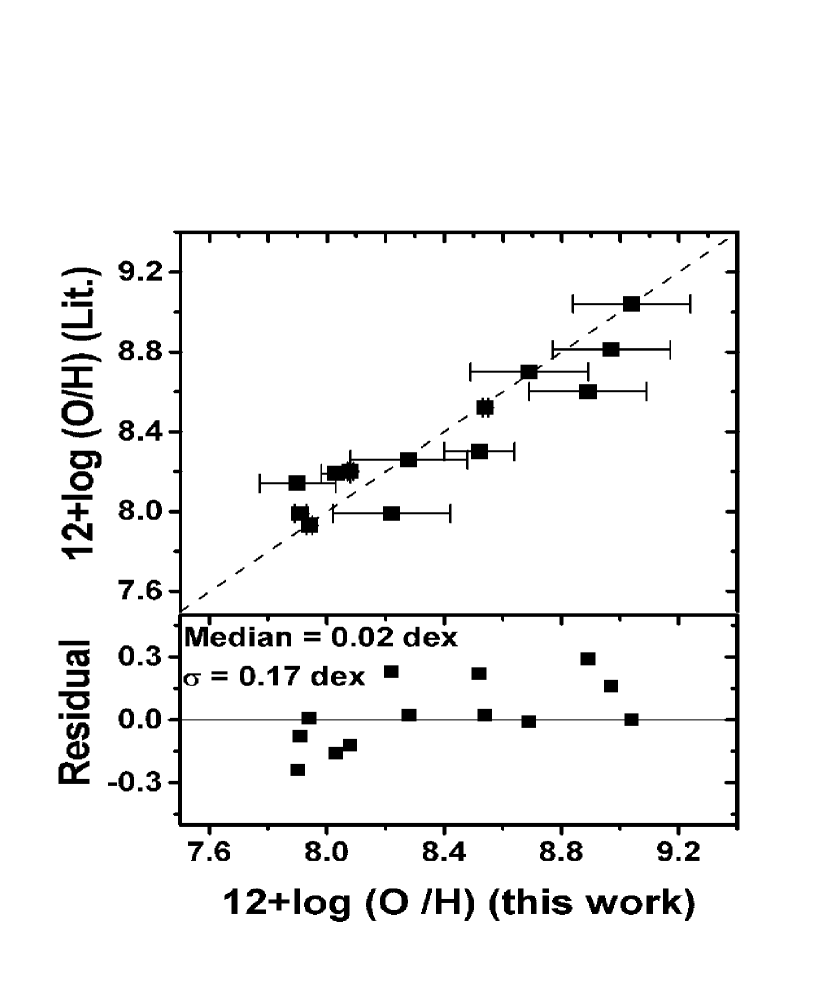
Furthermore, we have compared our derived gas abundances with those in the literature in Figure 6. The top panel shows this comparison, while the bottom panel shows the deviations as a function of 12+log(O/H).The median difference is 0.02 dex with a standard deviation of 0.17 dex.
The above comparisons, both internal and external, demonstrate that our gas abundance determinations are reliable and robust. The gas abundances must be measured correctly to accurately constrain the massive stellar population and its relation to gas metallicity. The abundances obtained using the different methods and the final adopted value for the oxygen abundance of each galaxy are listed in Table 4.
| Method | ||||||||||
|---|---|---|---|---|---|---|---|---|---|---|
| R Branch | Te | R23 | N2O3 | R3 | R23 Pilyugin | R3 Pilyugin | Adopted | Max | Literature | |
| Fairall44 | upper | - | - | - | 8.45 | - | 8.26 | 8.450.20 | 0.19 | - |
| III Zw107 | upper | 8.520.12 | 8.57 | 8.23 | 8.29 | 8.31 | 8.39 | 8.520.12 | 0.34 | 8.30(d) |
| Mrk309 | upper | - | 9.04 | - | 8.98 | 9.40 | 10.07 | 9.040.20 | 1.09 | 9.03(h) |
| Mrk475 | lower | 7.940.01 | 8.00 | 7.97 | 7.95 | 7.81 | 7.58 | 7.940.01 | 0.39 | 7.93(e) |
| Mrk712 | upper | - | - | - | 8.28 | - | 8.37 | 8.280.20 | 0.09 | 8.26(a) |
| Mrk1271 | lower | - | - | 8.22 | 7.57 | - | 8.49 | 8.220.20 | 0.92 | 7.99(e) |
| NGC450 | upper | 8.230.03 | 8.61 | 8.15 | 8.26 | 8.33 | 8.33 | 8.230.03 | 0.18 | - |
| NGC4385 | upper | - | - | 8.69 | 8.79 | - | 9.61 | 8.690.20 | 0.92 | 8.70(i) |
| NGC4861 | lower | 7.910.02 | 7.89 | 7.92 | 7.98 | 7.79 | 7.61 | 7.910.02 | 0.37 | 7.99(e) |
| NGC5430 | upper | - | 8.97 | 8.75 | 8.97 | 9.08 | 10.04 | 8.970.20 | 1.29 | 8.81(b) |
| NGC5471 | lower | 8.080.01 | 7.99 | 8.01 | 7.99 | 7.82 | 7.61 | 8.080.01 | 0.38 | 8.20(c) |
| NGC6764 | upper | 8.890.20 | 8.90 | 8.78 | 8.89 | 8.92 | 9.85 | 8.890.20 | 1.07 | 8.60(b) |
| NGC6764 | upper | 8.890.20 | 8.93 | 8.78 | 8.89 | 8.98 | 9.85 | 8.890.20 | 1.07 | - |
| NGC7714A | lower | 7.900.13 | 7.73 | 8.51 | 7.05 | 7.38 | 6.80 | 7.900.13 | 1.71 | 8.14(f) |
| NGC7714B | lower | 8.030.05 | 8.00 | 8.26 | 7.65 | 7.70 | 7.33 | 8.030.05 | 0.93 | 8.19(f) |
| UM48 | upper | 8.540.01 | 8.76 | 8.44 | 8.54 | 8.62 | 9.01 | 8.540.01 | 0.57 | 8.52(g) |
(a) Contini et al. (1995), (b) Contini et al. (1997), (c) Evans (1986), (d) Gil de Paz et al. (2000), (e) GIT2000, (f) Gonzalez-Delgado et al. (1995), (g) Masegosa et al. (1991), (h) SGTI 2000, (i) Sugai et al. (1992).
5 Massive Star Populations: WR and O Star Numbers
The number of massive stars present in a region of a Wolf-Rayet galaxy can be derived using the standard method developed by Conti (1991). A representative number of O and WR subtype stars can be obtained directly from the optical spectra (Vacca & Conti 1992, hereafter VC92).
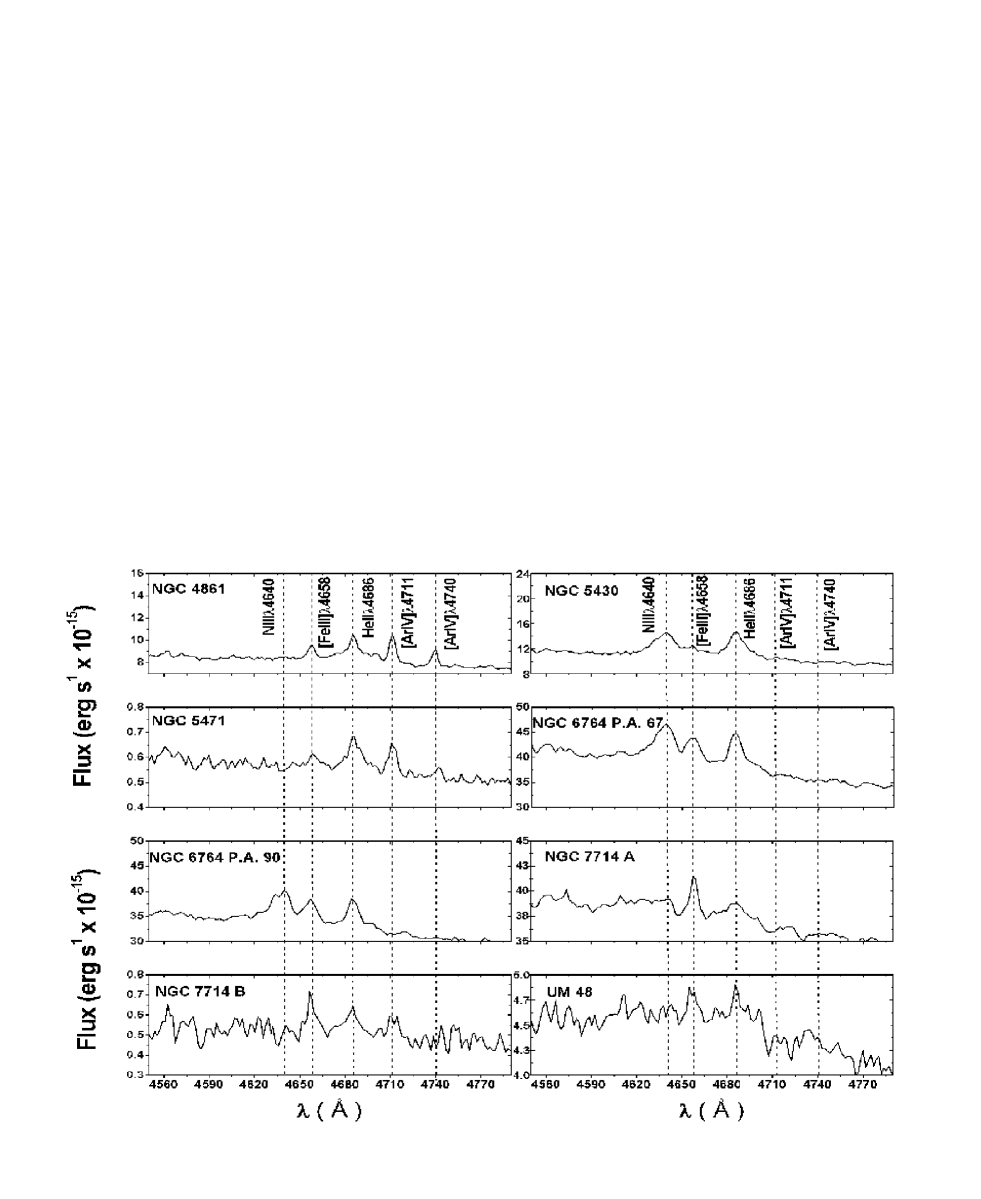
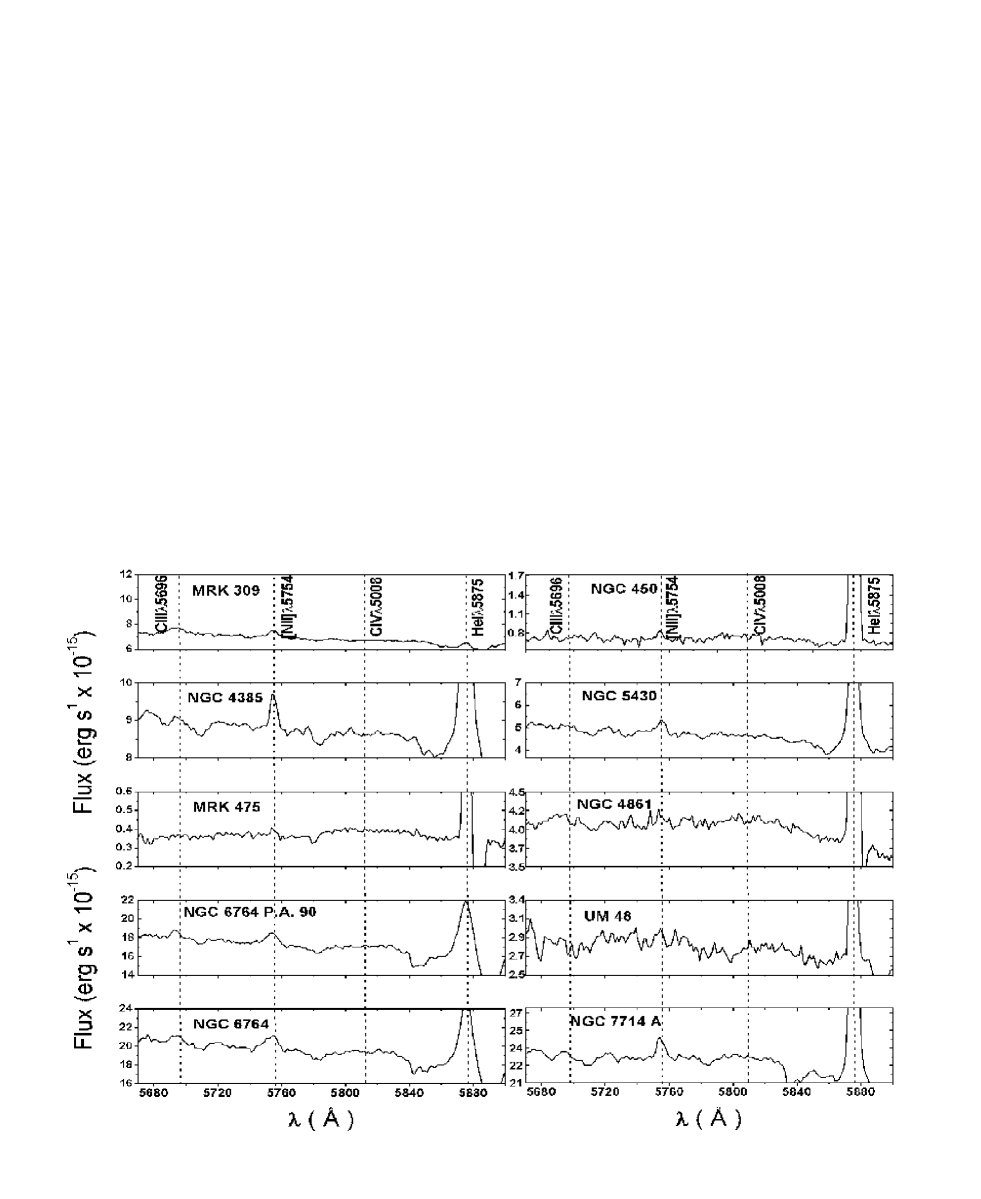
The absolute number of WR stars in the sampled galaxies was estimated using the blue bump (4686) and red bump (5808) luminosities. The blue bump is a blend of NV, NIII, CIII, CIV and HeII broad WR lines (GIT00). Superposed on the blue bump may be [FeIII], HeII, and [ArIV], which are narrow nebular lines. The dominant contribution to the blue bump is from the broad HeII4686 line arising in WNL stars, while the red bump is mainly due to broad CIV 5808 from WC stars (Schaerer et al. 1999, GIT00). However, some contribution from early WN stars (WNE) might be present in the blue bump (SV98). The detectability of the red bump is low compared to the blue bump. Figure 7 shows the spectral region of those galaxies in our sample containing either the blue or red bump.
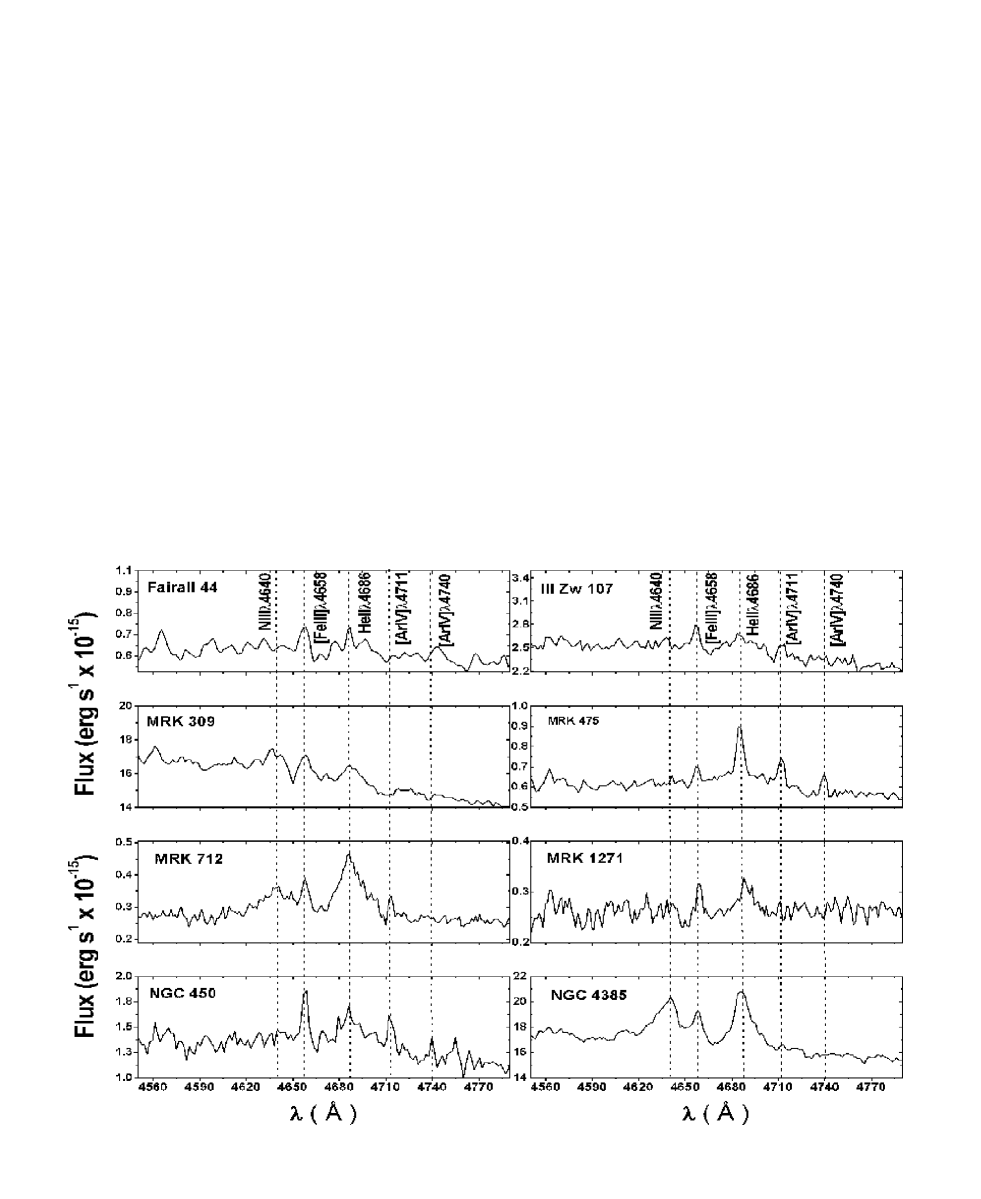
The dominant subtype of WR stars can be constrained by analyzing the presence of particular lines. NIII4640 and/or CIII4650 are observed in 9 galaxies, while NV4604 is absent. The former are due only to WN stars, thus indicating the predominance of WNL stars (Schaerer et al. 2000).
To derive the number of WNL stars from the blue bump, we measured the flux of the entire bump, and then subtracted the nebular lines and the contributions of NIII4640 and CIII/CIV4650/4658 when these lines were present. This procedure then retains only the broad emission component of HeII4686.
The CIII5696 emission line is a signature of late type WC stars (WCL, GIT00), and their presence is expected in high metallicity regions (Maeder, 1991). When CIII5696 is absent, but CIV5808 is present, the emission is likely due to early-type WC stars (WCE). WN stars cannot be responsible for the CIV5808 emission, since the ratio HeII4686/CIV5808 observed in our spectra ranges from 0.64 to 5, much lower than the value of predicted by SV98 (Schaerer et al. 2000).
The absolute population of WR subtype stars can be derived if the line luminosity of a single subtype star is known. We use the integrated broad emission line luminosity of HeII in each of our galaxies to derive the number of WNL stars, the CIV luminosity to derive the number of WCE stars, and CIII for WCL stars (GIT00).
In practice,
| (14) |
| (15) |
and
| (16) |
where , and are the total luminosities observed around the corresponding spectral features. For the average luminosity of a single WNL star in the He II 4686 line we use erg s-1, while for a single WCE star in the CIV line we use erg s-1, and for a single WCL star in the CIII line we use erg s-1(SV98).
Then, the total number of WR stars is defined by
| (17) |
We note that these line luminosities are based on WR stars observed in the Milky Way, assuming solar metallicity . The line luminosities show significant scatter depending on the dominant WR subtype and the metallicity in the observed object.
To obtain the number of O stars in each galaxy, we assume that all ionizing photons, , are produced by O and WR stars (Conti 1991). Hence,
| (18) |
where is the number of O7V stars and and are the number of ionizing photons per second produced by WR stars (all subtypes summed up) and O7V stars, respectively. Thus, the total number of ionizing photons can be obtained from the H luminosity, , through the relation
| (19) |
The number of O stars present is derived from the number of O7V stars after applying a correction for the presence of other O star subtypes. In this sense, VC92 and Vacca (1994) defined the conversion parameter as the proportion of O7V stars relative to all OV stars,
| (20) |
The parameter depends on the IMF for massive stars and is a function of the time elapsed since the beginning of the burst.
Using the models of SV98, which give the evolution of EW(H) as a function of the time elapsed from the beginning of an instantaneous burst for different metallicities, we derive the starburst age for each of our galaxies. These ages are in good agreement with the predicted age and duration of the WR phase estimated from instantaneous burst models. We use the models of SV98 to evaluate the parameter , adopting the oxygen abundance obtained for objects as the metallicity, the canonical slope for a Salpeter initial mass function , and a stellar mass upper limit of . The number of ionizing photons, the age of the starburst and derived for each galaxy of our sample are given in Table 5.
| Q0() | Age (Myr) | ||
|---|---|---|---|
| Fairall44 | 3.960.59 | 3.0 | 0.50 |
| III Zw 107 | 18.612.79 | 4.0 | 0.53 |
| Mrk309 | 89.7613.46 | 6.1 | 0.80 |
| Mrk475 | 0.120.02 | 4.1 | 0.48 |
| Mrk712 | 2.270.34 | 3.5 | 0.86 |
| Mrk1271 | 0.040.01 | 4.7 | 0.36 |
| NGC450 | 3.520.53 | 2.6 | 1.50 |
| NGC4385 | 9.851.48 | 4.9 | 0.18 |
| NGC4861 | 3.180.48 | 4.0 | 0.53 |
| NGC5430 | 15.282.29 | 5.1 | 0.14 |
| NGC5471 | 0.030.00 | 3.8 | 0.65 |
| NGC6764 | 14.942.24 | 5.5 | 0.12 |
| NGC6764 | 12.401.86 | 5.5 | 0.12 |
| NGC7714A | 29.684.45 | 5.4 | 0.52 |
| NGC7714B | 2.790.42 | 3.7 | 0.72 |
| UM48 | 9.941.49 | 4.8 | 0.20 |
Then, using equations (18),(19) and (20), the absolute number of O stars can be derived as
| (21) |
We adopt = (Schaerer et al. 1999).
The absolute number of O stars, Wolf-Rayet stars, NWNL and NWCE, and the ratio NWR/NO are given in Table 6.
| NWNL | NWCL | NWCE | NWR | NO | NWR/NO* | NWC/N | |
|---|---|---|---|---|---|---|---|
| Fairall44 | 692363 | - | - | 692363 | 5660623 | 0.120.04 | - |
| III Zw 107 | 33892211 | - | - | 33892211 | 287264172 | 0.130.04 | - |
| Mrk309 | 3084116314 | 7945229 | - | 3878616315 | 5849816883 | 0.660.24 | 0.260.09 |
| Mrk475 | 2514 | - | 73 | 3214 | 18629 | 0.170.16 | 0.280.10 |
| Mrk712 | 661334 | - | - | 661334 | 1876390 | 0.350.13 | - |
| Mrk1271 | 117 | - | - | 117 | 7722 | 0.140.05 | - |
| NGC450 | 322215 | - | 12951 | 451221 | 2044147 | 0.220.08 | 0.400.14 |
| NGC4385 | 30371534 | 1208960 | 972634 | 52172288 | 257407610 | 0.200.07 | 0.720.25 |
| NGC4861 | 522288 | 653 | 5835 | 586290 | 4375489 | 0.150.05 | 0.240.08 |
| NGC5430 | 47612520 | - | 999435 | 57612558 | 6614917776 | 0.090.03 | 0.210.08 |
| NGC5471 | 21 | - | - | 21 | 442 | 0.050.02 | - |
| NGC6764 | 28121687 | 85942 | 1750906 | 54212231 | 7932514771 | 0.070.02 | 0.930.33 |
| NGC6764 | 23801457 | 73549 | 1606817 | 47211943 | 5618011250 | 0.080.03 | 0.980.35 |
| NGC7714A | 19201288 | 86918 | 1596883 | 52952277 | 442822655 | 0.120.04 | 0.870.31 |
| NGC7714B | 451255 | - | - | 451255 | 3276357 | 0.140.04 | - |
| UM48 | 16541279 | - | 353234 | 20071300 | 389676385 | 0.050.02 | 0.210.08 |
5.1 Comparison with Evolutionary Models
The relationship between the NWR/NO ratio and oxygen abundance obtained for the galaxies in our sample is shown in Figure 8. We adopt a solar oxygen abundance of 12+ log(O/H) = 8.70 (Grevesse & Anders 1989, Grevesse & Sauval 1998). The predictions of Schaerer Vacca (1998) models for instantaneous bursts (solid line) with IMF slopes of -1, -2 and -2.35 (Salpeter), and of Starburst 99 (Leitherer et al. 1999) for extended bursts (duration of 2-4 Myrs) with IMF slope = -2.35 and mass limit of 100 M⊙ (dashed line) are plotted.
Evolutionary models predict that for a given metallicity, the ratio between WR and O stars varies strongly with the age of the burst, and the duration of the WR stage in the starburst also increases with increasing metallicity. (Maeder & Meynet 1994; Meynet 1995; SV98). Maeder (1991) interpreted this behavior as the result of increased stellar mass loss at higher metallicities. The increased stellar mass loss reduces the mass limit for forming WR stars in metal rich galaxies (Maeder 1991).
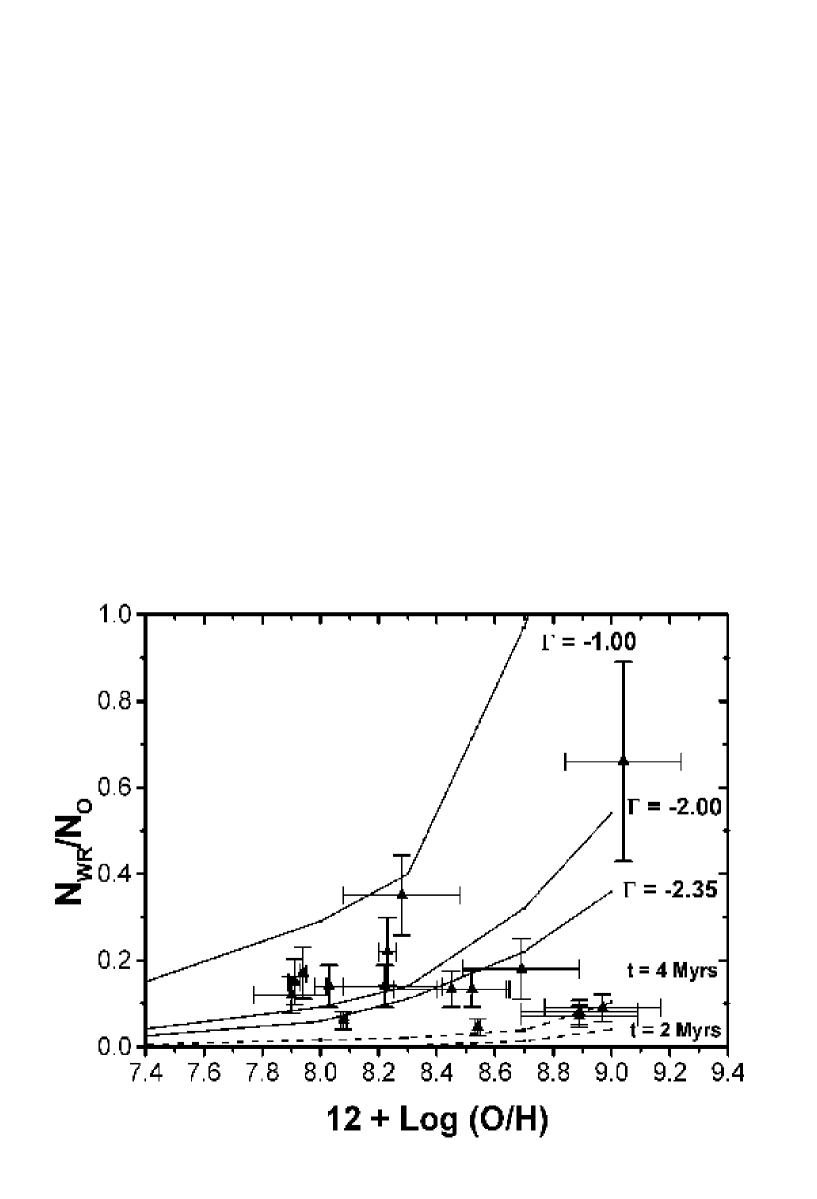
In the low metallicity case, the results can be explained by an instantaneous burst with a Salpeter IMF slope ( = -2 to -2.35). In the high metallicity regime, the results deviate from the expected behavior based on models with an instantaneous burst for starburst galaxies (SV98). A steeper IMF slope is required than in the low metallicity case, or we must invoke an extended burst to explain the results. SGIT00 interpret this behavior for their sample of high metallicity galaxies as implying an extended burst duration of 4-10 Myrs. Support for this conclusion comes from the observed WR population relation (WC/WN) with metallicity and the red supergiant star features observed in their objects (GIT00,SGIT00). NGC4385, NGC 5430, NGC 6764 and UM 48, with , are candidates for this type of object.
In Figure 9 we plot the ratio NWC/NWN (where WC = WCL + WCE) versus oxygen abundance compared to the predictions of SV98 models for an instantaneous burst, as well as extended bursts of 2 and 4 Myrs (Pindao et al. 2002). The dot-dashed line (bottom right) shows the observed trend of WC/WN with metallicity in Local Group galaxies derived empirically from observations by Massey & Johnson (1998). The NWC/NWN ratio is lower than the instantaneous burst model predictions and, for galaxies with metallicity higher than , the ratio is closest to the values reported for galaxies in the Local Group corresponding to a constant star formation regime (Massey & Johnson 1998).
These low NWC/NWN ratios might be partially explained by the assumption that the predominant contribution to the CIV5808 line luminosity at high metallicities is from WCE stars. If instead we assume that the main contribution to this line luminosity comes from WCL stars, the lower luminosity of WCL stars can increase the ratio of WC to WN stars by a factor of (GIT00). Schaerer & Vacca 1998 predict a luminosity ratio CIII5696/CIV5808 for a WCL (WC7) star of , but galaxies in our sample where WC emission lines are measured show lower CIII5696/CIV5808 ratios.
We contend that the low NWC/NWN ratios observed in high metallicity galaxies are due to the nature of the star formation bursts, with different durations for the WN and WC stages (GIT00). These galaxies have low H equivalent widths leading to ages greater than 5.3 Myr (except UM48 with age Myr). They are therefore in the late stages of their WR episodes (GIT00). At these later times, WN stars are still present, while the number of WC star drops to zero (SV98). This supports an extended burst to explain the NWN/NO ratio seen in these galaxies.
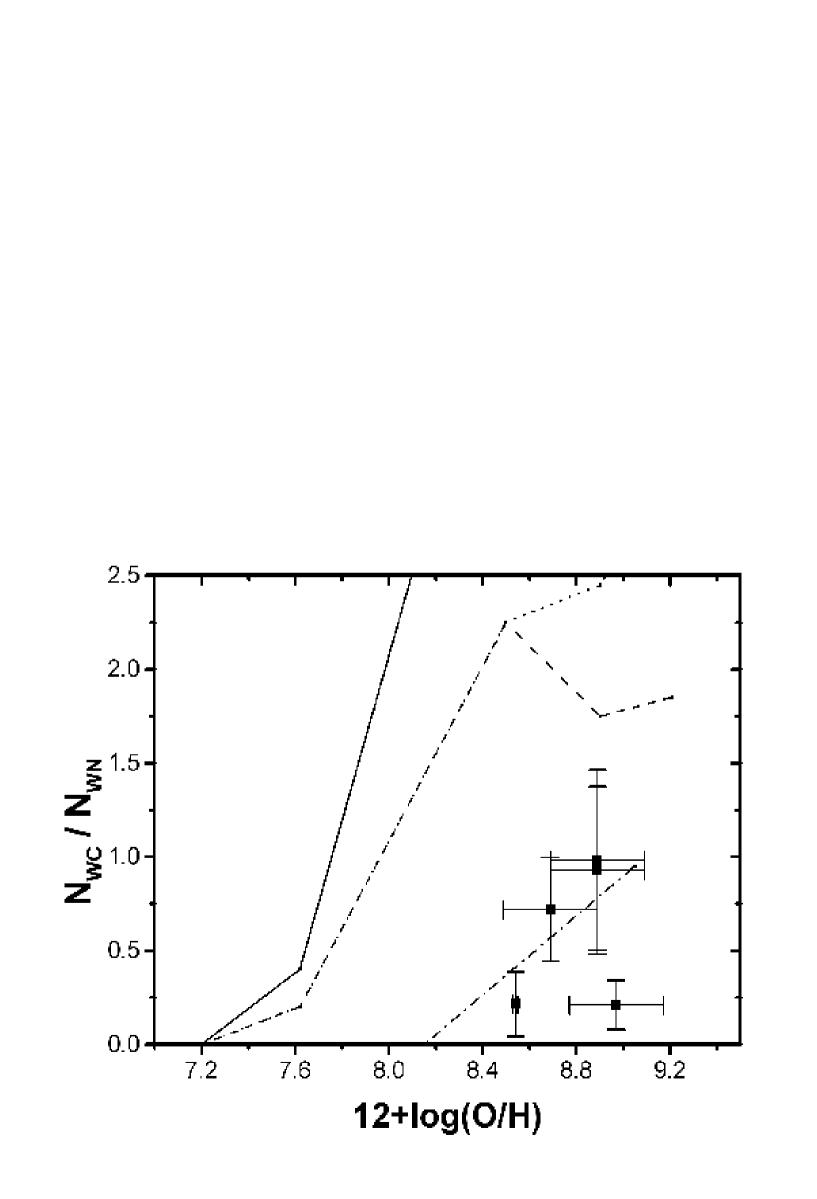
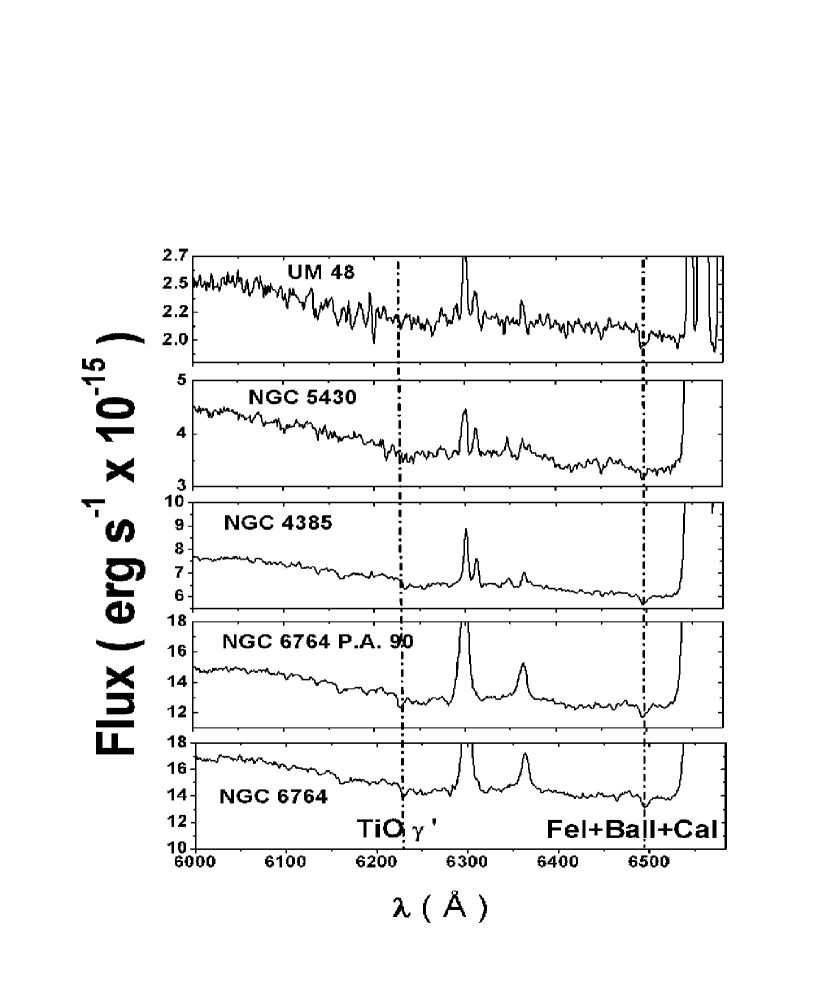
The presence of late type stellar features provides additional evidence supporting an extended burst. These absorption features are commonly observed in integrated spectra of stellar clusters, indicating the presence of red giants and supergiants (Bica & Alloin 1986). The presence of late-type stars further supports the idea of an extended burst with an age 7 Myr. In Figure 10 we present the spectra of these four high-metallicity galaxies which show apparent TiO bands () and and a blend of FeI+BaII+CaI6495, which are spectral features of characteristic of late-type stars.
Alternatively, Pindao et al. (2002) suggest that corrections to the evolutionary models can reproduce the low observed NWR/NO ratios using an instantaneous burst. They invoke the uncertainties in synthesis models of WR bumps to explain their results, since the WR line luminosities show a large scatter in the WNL calibration sample of SV98 with Galactic and LMC objects. A dependence between the WR luminosity and the bolometric stellar luminosity may cause this discrepancy. The WR line luminosity L4686 is observed to increase with increasing bolometric stellar luminosity. They suggest a more precise analysis, splitting the bolometric stellar luminosity in two domains ( and ). The different average line luminosities for each domain are L erg s-1 for and L erg s-1 for . Using these values in synthesis models leads to a reduction in the predicted number of WNL stars. Note that the line luminosity for a WNL star with is almost twice as large as that adopted by SV98 for their Galactic calibration sample. Using these values in the synthesis models, their observed WR features can be reproduced with an instantaneous burst and a standard Salpeter IMF (Pindao et al. 2002).The recalibrated (lower) luminosity of WN stars used in models leads to a significant reduction in the WR bump intensity in the bursts with ages 4-5 Myrs.
Only the youngest bursts with very high are dominated by very luminous WNL stars. For objects with low ratios, if we apply the suggested correction to the L4686 luminosities in the actual observations (instead of the models), and recalculate the number of WN stars at the highest metallicities (dominated by low luminosity WNL stars), the lower luminosity of WNL stars can increase the fraction of WN stars by a factor of (GIT00). With this change in assumed luminosity, we are unable to reproduce the standard instantaneous burst model predictions for the ratio in the highest metallicity galaxies. This analysis confirms that the low values of NWR/NO for objects with , obtained for NGC4385, NGC 5430, NGC 6764 and UM 48, require an extended burst with a Salpeter IMF slope.
6 Conclusion
In this work, we present a spectroscopic study of 14 Wolf-Rayet galaxies from the sample of SCP98, as well as NGC450 for which the WR features are newly detected. Our goals were to search for and confirm the presence of WN and WC stars, and to compare the results with predictions from evolutionary synthesis models (SV98). We tested the agreement of these models with observations for a large range of metallicities, spanning 12 + log(O/H) .
Our main results can be summarized as follows:
1. The broad WR emission in the blue region of the spectrum, the blend of NIII, CIII, CIV, and HeII emission lines, is present in all fourteen galaxies. The WR population in these galaxies is dominated by late WN stars. However, the red bump produced by the emission of broad C IV from early WC stars is detected in only nine galaxies.
2. The weak, broad WR emission line CIII is detected in six galaxies, which suggests the presence of late WCL stars in these objects. This line is expected in high-metallicity environments (GIT2000). A good example of this is Mrk 309, with a metallicity of 12+log(O/H) = 9.04, where this line is strong.
3. We found good agreement when comparing the relative numbers of WR and O stars () obtained from observations and those predicted by the evolutionary synthesis models of SV98 for low metallicity galaxies. The ratio in these galaxies can be explained by a burst of star formation. The value and the observed equivalent widths of the blue and red bumps also compare favorably with SV98 predictions. We found that it is necessary to invoke an IMF slope between and an instantaneous star formation event to explain the observed ratios in low metallicity regimes.
4. For NGC4385, NGC 5430, NGC 6764 and UM 48, the ratios are lower than the predictions of models with an instantaneous burst for metallicities of . The existence of an extended burst is supported by the presence of TiO bands (6250) in these objects spectra. The presence of this older stellar population is indicative of the necessary time elapsed since the burst for stars to evolve through this phase. The ratios combined with their high metallicity suggest these objects are in the late stages of their WR episodes (), when WN stars are present while the number of WC stars drops to zero (SV98). The observations can be better represented using extended starbursts with durations of 2-4 Myr and Salpeter IMF slope.
5. Massive stellar evolution models predict that the relative number of WR stars increases when metallicity increases (Maeder & Meynet 1994, SV98). Our results do not confirm this trend. The partial disagreement between our results and the models may arise from large uncertainties in the luminosity of a single WR star and the uncertainties associated with the best choice of the dominant contribution of WR star subtype in the high metallicity regime.
The massive stellar populations in Wolf-Rayet galaxies can be better understood if studies like this one are combined with other stellar population investigations. A detailed spectral study in the infrared of molecular bands and low ionization absorption lines can provide information about older stellar populations in a starburst (Origlia et al. 1999, GIT00). Spectroscopy in the UV () can provide information about the young star population in galaxies. This UV spectral range contains resonant spectral lines of OVI, SiV and/or CIV that are spectral signatures of young massive stars (Leitherer et al. 2002). The combination of the IR and UV yields information on the current stellar populations, and constrains the upper and lower limits of time elapsed since the burst (Leitherer et al. 2002, Olivia et al. 1999). Additionally, analysis of the -element abundances can provide additional constraints on the age of the burst and consequently the number of massive stars (Lanfranchi, G. A. & Friaça 2003).
It is a pleasure to thank Sueli M. M. Viegas for discussions and contributions with helpful comments. I.F.Fernandes is thankful to the Laboratoire d’Astrophysique, Observatoire Midi-Pyrénées staff for their kind hospitality. This international collaboration was possible thanks to the financial support of IAG-USP, FAPESP grant No 99/12721-5 and of . L.A.O.M.P. URA 285.
Appendix A: Remarks on Individual Objects
In this section we present a brief description of some specific properties of each galaxy in our sample. By doing so we can address specific issues related to these objects and compare with results from other authors, and obtain important information for the analysis of the population as a whole.
Fairall 44: Kovo & Contini (1999) reported the blue bump in their systematic search for Wolf-Rayet stars in young starburst galaxies. We report the presence of WN stars in this galaxy. We find that the WR/O ratio is 0.24.
III Zw 107: Kunth & Jobert (1985) reported a moderately strong emission band at Å due to WR stars in III Zw 107 S. We report the presence of NIII and HeII broad emission lines in this galaxy. The WR/O ratio is 0.12.
Mrk 309: This bright UV continuum galaxy has broad emission features at NIII and HeII from WR stars noted by OC82. They found that the number of WR stars is comparable to the number of O stars in this galaxy and the nuclear region of NGC6764. We note the presence of NIII and HeII in the blue bump and CIII in the red bump in our spectrum of this galaxy. We find that the number of WR stars is similar to that of O type stars in the nuclear region of Mrk 309. Our results are in good agreement with SGIT00.
Mrk 475: Broad HeII and NIII emission lines were first noted by Conti (1991). Strong blue and red bumps were detected by ITL94. GIT00 identified features of SiIII, HeII, HeI,NII, and CIV, where the blue bump is strongly contaminated by nebular emission. We confirm the results of GIT00, and find a WR/O ratio of 0.17.
Mrk 712: Contini et al. (1995) reported the discovery of emission from WR stars in the giant HII region south of the nucleus. They estimated a WN/O ratio of 0.2 from the HeII luminosity. The [ArV] emission line in their spectrum showed that the HII region is strongly ionized by hot WR stars. The WN/WO ratio indicated a very young starburst episode and a flat initial mass function with slope between -1 and -2. We use the SV98 evolution models to compare with our observational results (§6.2).
Mrk 1271: Izotov & Thuan 1998 detected a broad blue bump. GIT00 identified the NIII, SiIII, NII and HeII emission lines, and possibly CIV in their high quality spectrum. They reported the blue bump as being strongly contaminated by nebular emission. We confirm only the presence of the HeII broad line in the nuclear region of this galaxy. The CIV broad line is not detected in our spectrum of Mrk 1271. The WR/O ratio is 0.14.
NGC 450: There is no mention of WR detection in this galaxy in the literature. We report a ratio of WR/O=0.22. The models of SV98 for an instantaneous star formation episode predict a flat IMF slope ( to ) to explain the presence of WR stars in this low metallicity galaxy.
NGC 4385: HeII and NIII Wolf-Rayet features are present in this starburst galaxy, according to Durret & Tarrab (1988). An optical spectrum by Salzer (1990) shows essentially the same features. Conti (1991) identified a narrow emission feature near 4660Å as [FeIII], while Salzer et al. (1989) identifies it as CIV. We detect NIII and HeII in the blue bump and CIII and CIV in the red bump. We find a high number of WR stars compared to O stars. The WR/O ratio is 0.13 for the nuclear region of NGC 4385.
NGC 4861: Dinerstein & Shields (1986) and Izotov, Thuan & Lipovetsky (1997) detected the blue and red bumps. GIT00 identified NIII, SiIII, , HeII and CIV broad emission lines, and a blue bump strongly contaminated by nebular emission. Even with their high-quality spectrum, the NIII and CIV lines appear blended. In our spectrum of the central region of this galaxy, we can resolve the lines of the blue bump. We report the presence of CIII and CIV broad emission lines due to WC stars.
NGC 5430: A strong emission feature near 4650Å due to WR stars in the spectrum of a bright region SE of the galactic center was noted by Kell (1982). He identified NIII and HeII emission lines as coming from WN stars (Kell 1987). No strong emission features are seen in the IUE spectrum of this source. A relatively older stellar population appears in the center of NGC 5430. According to Kell (1987), the knot 20′′ southeast of the nucleus might be a separate galaxy interacting with NGC 5430. For this knot we measure the NIII and HeII blue bump broad components, as well as the CIII and CIV broad emission lines. A high WR/O ratio of 0.09 is found for NGC 5430.
NGC 5471: This is a massive giant HII region located in M101. Mass-Hesse & Kunth (1991) found WR-HeIIH and a 3.5 Myr burst. NGC 5471 seems to be dominated by a well-defined burst of star formation. A broad HeII emission line (FWHM2000 km s-1) was detected in this region by Castañeda et al. (1990) and was confirmed by Mass-Hesse et al. (1991). We find a low ratio WR/O=0.04 for this galaxy.
NGC 6764: OC82 noted the presence of broad NIII and HeII emission line features from WR stars. They attributed the 4660Å emission line to CIII and not to [FeIII] forbidden emission. The similarity of the overall emission line spectrum of NGC 6764 to that of dwarf galaxies and to certain giant HII regions attracted the attention of these authors. We observed this object at two position angles, and . We find WN and WC stars in the nuclear region of this galaxy. For both position angles the number of Wolf Rayet stars is comparable to that of O type stars.
NGC 7714: Weedman et al. (1981) called this object a “prototype starburst” galaxy. van Breugel et al. (1985) noted the spectral similarity of NGC7714 to Minkowski’s object and extragalactic HII regions. They reported this galaxy as having weak WR emission features near HeII. Conti (1991) called attention to the importance of NGC 7714 for understanding the relation between starbursts and the presence of WR stars in this kind of galaxy. We found WR stars in two regions of NGC 7714. In the nuclear region we find WR/O = 0.08, while in the secondary HII region, WR/O=0.14. In the nuclear regions we were able to measure the CIII and CIV broad emission lines due to WC stars.
UM48: A systematic search for Wolf-Rayet features in this galaxy was done by Masegosa et al. (1991). The authors reported the presence of a WR blue bump. They assumed that the global WR detection rate depends on the metallicity and they analyzed the SN IIe contribution to the blue bump. They concluded that a large blue bump luminosity should be expected in regions with SN contamination. We did not detect the NIII broad emission line in this galaxy. We measure the WC broad emission line CIV.
References
- [1995] Allen, S. W. 1995 MNRAS 276, 947
- [1976] Aller, D. A., Wright, A. E. & Goss, W. M. 1976 MNRAS 177, 91
- [1994] Barth, C. S., Cepa, J., Vilchez, J. M., & Dottori, H. A.1994, AJ108, 2069
- [1976] Bica, E. & Alloin, D. 1986,A&A 162, 21
- [1971] Brocklehurst, M. 1971, MNRAS, 153, 471
- [1997] Calzetti, D. 1997 AJ 113, 162
- [1989] Cardelli, J. A., Clayton, G. C. & Mathis, J. S. 1989 ApJ 345, 245
- [1990] Castañeda, H. O., Vilchez, J. M. & Copetti, M. V. F. 1990 ApJ, 365, 164
- [1995] Contini, T., Davoust, E. & Considere, S. 1995 A&A 303,440
- [1997] Contini, T., Wozniak, H., Considere, S. & Davoust, E. 1997, A&A 324 41
- [2001] Contini, T., Kunth, D., Mas-Hesse, M. & Arribas, A., 2001 EAS Publications Series, Vol. 1 ”Active Galactic Nuclei in Their Cosmic Environment”, B. Rocca-Volmerang, H. Sol (eds), EDP Sciences, 1, 163
- [2002] Contini, T., Treyer, M. A., Sullivan, M. & Ellis, R. S., 2002, MNRAS, 330, 75
- [1991] Conti, P. S. 1991, ApJ, 377, 115
- [1986] Dinerstein, H. L. & Shields, G. A. 1986, ApJ, 311, 45
- [1988] Durret, F. & Tarrab, I. 1988, A&A, 205, 9
- [1990] Durret, F. 1990, A&A 229, 351
- [1996] Eckart, A., Cameron, M., Boller, T., Krabbe, A., Blietz, M. & Nakai, N. 1996, ApJ 472, 588
- [1984] Edmunds, M. G. & Pagel, B. E. J. 1984, MNRAS, 211, 507
- [1986] Evans, I. N. 1986, ApJ 309, 544
- [2000] Gil de Paz, A., Aragon-Salamanca, A., Gallego, J. & Alonso-Herrero, A. 2000, MNRAS 316, 357
- [1995] Gonzalez-Delgado, R. M., Perez, E.; Diaz, A. I.; Garcia-Vargas, M. L., Terlevich, E. & Vilchez, J. M. 1995, ApJ 439, 604
- [1989] Grevesse, N. & Anders, E. 1989, AIPC,183, 1
- [1998] revesse, N. & Sauval, A. J. 1998, SSRv 85, 161
- [2000] Guseva, N. G., Izotov, Y. I. & Thuan, T. X. 2000, ApJ, 531, 776
- [1997] Heckman, T. M., González, R. M. & Leitherer, C., et al., 1997, ApJ, 482, 114
- [1995] Ho, L. C., Filippenko, A. V. b& Sargent, W. L. 1995, ApJS, 98, 477
- [1994] Izotov, Y. I., Thuan, T. X. & Lipovetsky, V. A., 1994, ApJ, 435, 647
- [1997] Izotov, Y. I., Thuan, T. X. & Lipovetsky, V. A., 1997, ApJS, 108, 1
- [1998] Izotov, Y. I. & Thuan, T. X., 1998, ApJ, 500, 188
- [1982] Kell, W. C. 1982 PASP, 94, 765
- [1987] Kell, W. C. 1987 A&A, 172, 43
- [1983] Kennicutt, R. C. 1983 ApJ, 271, 54
- [2001] Kewley, L. J., Heisler, C. A., Dopita, M. A. & Lumsden, S. 2001 ApJS 132, 37
- [1995] Kim, D.-C., Sanders, D. B., Veilleux, S., Mazzarella, J. M. & Soifer, B. T. 1995 ApJS 98, 129
- [1998] Kim, D.-C., Veilleux, S. & Sanders, D. B. 1998 ApJ 508, 627
- [1999] Kobulnicky, H. A., Kennicutt Jr., R. C. & Pizagno, J. L. 1999 ApJ 514, 544
- [1999] Kovo, O. & Contini, T. 1999 IAUS 193, 604
- [1985] Kunth, D. & Joubert, M. 1985 A&A 142, 411
- [1999] Leitherer, C., Schaerer, D., Goldader, J. D., Delgado, R. M. G., Robert, C., Kune, D. F., de Mello, D. F., Devost, D. & Heckman, T. M. 1999 ApJS 123, 3
- [2002] Leitherer, C., Li, I.-H., Calzetti, D.& Heckman, T. M. 2002 ApJS 140, 303
- [2003] Lanfranchi, G. A. & Fria a, A. C. S. 2003 MNRAS 343, 481
- [1991] Maeder, A. 1991, A&A 242,93
- [1994] Maeder, A. & Conti, P. S., 1994, ARA&A 295, 171
- [1994] Maeder, A. & Meynet, G., 1994, A&A 287, 816
- [1991] Masegosa, J., Moles, M., & del Olmo, A. 1991, A&A, 244, 273
- [1991] Mas-Hesse, J. M. & Kunth, D., 1991, A&A 88, 399
- [2001] Mattila, S. & Meikle, W. P. S. 2001, MNRAS 324, 325
- [1985] McCall, L. M., Rybski, P. M., & Shields, G. A. 1985, ApJS, 57,1
- [1984] McCall, L. M. 1984 MNRAS, 208, 253
- [1991] McGaugh, S. S. 1991 ApJ, 380, 140
- [1995] Meynet, G., 1995, A&A 298, 767
- [1982] Oke, J. B. & Gunn, J. E. 1982, PASP, 94, 586
- [1999] Oliva, E., Origlia, L., Maiolino, R. & Moorwood, A. F. M. 1999, A&A 350, 9
- [1999] Origlia, L., Goldader, J. D., Leitherer, C.; Schaerer, D. & Oliva, E. 1999, ApJ 514, 96
- [1982] Osterbrock, D. E. & Cohen, R. D., 1982, ApJ 261, 64
- [1989] Osterbrock, D. E. 1989, Astrophysics of Gaseous Nebulae and Active Galactic Nuclei
- [1979] Pagel, B. E. J., Edmunds, M. G., Blackwell D. E., Chun, M. S. & Smith, G. 1979, MNRAS 189,95
- [1969] Peimbert, M. & Costero, R. 1969 BOTT 5, 3
- [1991] Peimbert, M., Sarmiento, A.& Fierro, J. 1991 PASP 103, 815
- [2004] Pettini, M. & Pagel, B. E. J. 2004 MNRAS 348,59
- [2002] Pidao, M., Schaerer, D., Gonzales-Delgado, R. M. & Stasińska, G. 2002 A&A 394, 443
- [2000] Pilyugin, L. S. 2000 A&A 362, 325
- [2001] Pilyugin, L. S. 2001 A&A 369, 594
- [2001] Pilyugin, L. S. 2001 A&A 374, 412
- [1994] Rosa, M. R. & Benvenuti, P. 1994, A&A 291 1
- [1989] Salzer, J. J., MacAlpine, G. M., & Boroson, T. A. 1989, AJ, 70, 477
- [1999] Shaerer, D.; Contini, T. & Kunth, D. 1999, A&A, 341, 399
- [1999] Shaerer, D.; Contini, T. & Pindao, M. 1999, A&A, 136, 35
- [2000] Shaerer, D. Guseva, N. G., Izotov, Y. I. & Thuan, T. X. 2000, A&A, 362, 53
- [1998] Shaerer, D. & Vacca, W. D. 1998, ApJ, 497, 618
- [1997] Steigman G.; Viegas, S. M. & Greenwald, R. 1997 ApJ 490,187
- [1998] Schmitt, H.; Storchi-Bergmann, T. & Cid Fernandes, R. 1998 AAS 193 608
- [1992] Sugai, H. & Taniguchi, Y. 1992, AJ 103 1470
- [1992] Vacca, W. D. & Conti, P. S. 1992, ApJ 401, 543
- [1994] Vacca, W. D. 1994, ApJ, 421, 140
- [1985] van Breugel, W., Filippenko, A. V., Heckman, T. & Miley, G. 1985 ApJ 293, 83
- [1987] Veilleux, S. & Osterbrock D. E. 1987 ApJS 63, 295
- [1993] Vogel, S., Engels, D., Hagen, H.-J., Groote, D., Wisotzki, L. & Cordis, L. 1993, A&AS 98, 193
- [1981] Weedman, D. W., Feldman, F. R., Balzano, V. A., Ramsey, L. W., Sramek, R. A. & Wuu, C.-C. 1981 ApJ 248, 105