A Near-Infrared (JHK) Survey of the Vicinity of the HII region NGC 7538: Evidence for a Young Embedded Cluster11affiliation: Observations reported here were obtained at the MMT Observatory, a joint facility of the Smithsonian Institution and the University of Arizona.
Abstract
We describe the results of two near infrared (-band) imaging surveys and a three color (JHK) survey of the vicinity of NGC 7538. The limiting magnitudes are and mag for the -band surveys and mag for the JHK survey. We identify more than 2000 and 9000 near-infrared (NIR) sources on the images of the two -band surveys and 786 NIR sources in the JHK survey. From color-color diagrams, we derive a reddening law for background stars and identify 238 stars with NIR excesses. Contour maps indicate a high density peak coincident with a concentration of stars with NIR excesses. We identify this peak as a young, embedded cluster and confirm this result with the -band luminosity function, color histograms, and color-magnitude diagrams. The center of the cluster is at = 23:13:39.34, = 61:29:18.9. The cluster radius is 3’ 2.5 pc for an adopted distance, 2.8 kpc. For 2.8 kpc, and reddening, = 0.55 mag, the slope of the logarithmic -band luminosity function (KLF) of the cluster, 0.32 , agrees well with previous results for L1630 (; Lada et al., 1991b) and M17 (; Lada et al., 1991a).
1 Introduction
In the last decade, large format infrared arrays have enabled direct probes of the interiors of molecular clouds invisible at optical wavelengths. The discovery of embedded clusters containing many newly formed stars demonstrates the effectiveness of NIR imaging surveys (e.g. Lada et al., 1991b, 1993b; Zinnecker et al., 1993). These studies show that young clusters contribute significantly to star formation in our galaxy (Lada & Lada, 2003).
Young embedded clusters offer unique opportunities to study the stellar initial mass function (IMF) and its variation in space and time. Dense young clusters with ages of 10 million years or less probably have nearly all of their original stellar population. Older clusters lose members due to evolution and dynamical interactions (e.g. Friel, 1995; Meibom et al., 2002; Boily & Kroupa, 2003a, b; Bonnell et al., 2003). The low mass members of young clusters are brighter than at any other time of their evolution and are easier to identify and to count than at later stages (Lada & Lada, 2003; Muench et al., 2002, 2003).
NGC 7538 ( = 111.5, = 0.8) is a visible HII region in the Perseus spiral arm and is probably part of the Cas OB 2 complex. Lying at a distance of 2.8 kpc (Blitz et al., 1982; Campbell & Persson, 1988), NGC 7538 is a site of active star formation with several luminous near-IR and far-IR sources ( = 3000 - 30000 ; = 10 - 20 ). Bloomer et al. (1998), Werner et al. (1979), and Wynn-Williams et al. (1974) catalogued 11 NIR sources and describe other properties of the region.
Although NGC 7538 is relatively well mapped in different wavelength regimes from the optical to the sub-millimeter (e.g. Momose et al., 2001; Ungerechts et al., 2000; Yao et al., 2000; Campbell & Persson, 1988), there have been no large-scale NIR surveys of the region since a short conference summary in McCaughrean et al (1991). Here, we describe the first detailed analysis of a JHK imaging survey in the vicinity of NGC 7538. The limiting magnitude of this survey, 15 mag, corresponds to stars with 2.0 for = 1.1 mag and kpc (adopted values from the literature). This survey yields a robust detection of an embedded cluster containing many stars with NIR excesses. Our results complement the deeper, but less extensive NIR survey of Ojha et al. (2004).
We describe the observations and data reduction in §2, analyze the photometric data in §3, and derive a -band luminosity function (KLF) in §4. We conclude in §5 with a brief summary.
2 Observation and Data Reduction
During 4-10 June 1993, we acquired JHK images with SQIID (Ellis et al., 1993) on the KPNO111Kitt Peak National Observatory, National Optical Astronomy Observatory, which is operated by the Association of Universities for Research in Astronomy, Inc. (AURA) under cooperative agreement with the National Science Foundation. 1.3m telescope. The 12 pairs of dithered frames have a scale of 1.37”/pixel and covered about 230 arcmin2 centered at RA = 23:13:48 and DEC = 61:27:36 (J2000). Small maps of two control fields are centered at RA = 23:13:48; DEC = 61:43:30 (J2000) and RA = 23:15:54; DEC = 61:27:36 (J2000). During 24-26 June 2002, we supplemented these data with additional -band observations with STELIRCAM222http://linmax.sao.arizona.edu/help /FLWO/48/stelircam/index.html mounted on the 48” telescope at Fred Lawrence Whipple Observatory on Mt. Hopkins. The STELIRCAM data have a scale of 1.2”/pixel and covered 270 arcmin2 centered at RA = 23:13:41 and DEC = 61:31:39. Standard stars of Elias et al. (1982) were observed each night of both observing runs. These data yield transformations into the CIT photometric system (Barsony et al., 1997). Finally, we acquired deeper K-band data on an engineering run of FLAMINGOS333http://www.astro.ufl.edu/ elston/flamingos/flamingos.html mounted on the 6.5m MMT in June 2001. The fields cover 836 arcmin2 in a 5x5 mosaic centered on RA = 23:13:44 and DEC = +61:27:49 with 0.2”/pixel spatial resolution. Each element of the mosaic consists of 5 dithered images.
To reduce the SQIID images, we used standard IRAF444IRAF is distributed by the National Optical Astronomy Observatory, which is operated by the Association of Universities for Research in Astronomy, Inc. under contract to the National Science Foundation. routines for flat-fielding and sky-subtraction (see Barsony et al., 1997, for a detailed description of the reduction of SQIID frames). For the STELIRCAM data, we used the STELIRCAM pipeline555http://cfa-www.harvard.edu/ircam/ of Bill Wyatt provided by the SAO Telescope Data Center. This software uses procedures similar to those described in Barsony et al. (1997). To combine the dithered images of each FLAMINGOS field, we used the dither package in addition to the standard routines for flat-fielding and sky subtraction. Fig. 1 shows a JHK composite image of the region based on SQIID data.
We used SExtractor (Bertin & Arnouts, 1996) to select sources in both surveys. After confirming each detection by careful visual examination of the frames, we considered an IR source as a detection if it could be identified on more than one STELIRCAM or FLAMINGOS image. For SQIID data, we included sources for the final sample if detected in all three bands.
In the following analysis, we consider the 786 stars detected in the SQIID survey as the main sample. For the analysis of the density maps we also use the 1047 STELIRCAM sources with 15 as a second complete sample, the 2223 STELIRCAM sources with 16.5 as a third sample, and the 9000 FLAMINGOS sources with 17.5 as a fourth sample.
We used SExtractor to perform aperture photometry on all confirmed sources. We used a small circular aperture (3 pixels for SQIID and 6 pixels for STELIRCAM) for fainter cluster stars to reduce the background noise. Large circular apertures for the standard stars (5 pixels and 12 pixels respectively for SQIID and STELIRCAM data) yield a more accurate standard transformation. To bring the measurements onto a common scale, we applied an aperture correction derived from observations of relatively bright stars on each frame. Due to changes in the point spread function and seeing, the aperture correction changed slightly from frame to frame. The typical value was 0.1 mag with rms = 0.02 mag.
For the FLAMINGOS frames we performed psf photometry using the IRAF/DAOPHOT packages. We carefully selected the psf stars for each image and used a 2nd order gaussian psf profile to account for different psf distortions. We derive errors of 0.1 mag for stars with 17.5. Because these fields were acquired through light cirrus, we used 2MASS observations to transform FLAMINGOS data to a standard photometric system.
We derived separate transformations to place the SQIID and STELIRCAM data on a standard photometric system. For the 431 sources common to both surveys, the average difference in the -band magnitude is = 0.08 mag 0.16 mag. The offset is small, occurs in all fields, and is independent of . Because all of the SQIID frames were acquired at much larger elevation than the STELIRCAM frames, telluric extinction is the likely cause of the offset. The large dispersion is also independent of and is probably due to source variability. More than 60% of the stars with large -band differences also have large NIR excess emission. NIR excesses and variability are characteristic of pre-main sequence (PMS) stars (see e.g., Eiroa et al., 2002, and references therein).
Comparisons between SQIID and FLAMINGOS -band magnitudes confirm the measured offsets. We identified nearly all SQIID sources as single objects on the FLAMINGOS images. After eliminating variable stars, the average offset is = 0.02 0.18 for 15.
We compared our results with previous IR photometry from the literature (Bloomer et al., 1998; Werner et al., 1979; Wynn-Williams et al., 1974). The average magnitude difference between our photometry and published data is zero. All of the sources with published NIR data are PMS stars. Thus, variability probably causes the significant, 0.5 mag, dispersion in the average.
Comparisons with 2MASS also suggest a small magnitude offset. We identified more than 95% of the stars detected with SQIID in the 2MASS database. After eliminating 9% of the sample with large magnitude offsets ( 0.40 mag), the mean offset between SQIID and 2MASS data is 0.02 mag 0.13 mag. We conclude that our magnitude scale is robust and that 9% or more of the NIR sources are variable stars.
3 Analysis of the photometric data
H II regions often contain one or more concentrations of young stars. Because the extinction in these regions is usually large, the stellar ionization sources are usually completely invisible at optical wavelengths. NIR images often reveal embedded clusters containing at least several O-B stars and many other lower mass stars. These embedded clusters are among the youngest known stellar systems. From systematic studies of individual star forming regions and surveys of molecular cloud complexes, Lada & Lada (2003) summarized properties of more than 100 known embedded clusters. Systematic examinations of the 2MASS catalogue suggest that there are at least 300 embedded clusters within 10 kpc (Bica et al., 2003; Dutra et al., 2003).
The properties of embedded clusters vary considerably from region to region. Most clusters are identified from a measurement of an overdensity of stars relative to the local background. The typical star density is between 10 and 100 stars , compared to projected background levels of 2–10 stars . The sizes and total masses of the clusters are 0.5–1.0 pc and 30–1000 M⊙ respectively. The clusters usually suffer high and variable reddening due to the presence of the dusty parent molecular cloud. Many of the members often show near-IR excesses, which indicate the presence of a circumstellar disk (see Lada & Lada, 2003, for references).
The study of these concentrations provides data on the early stages of star formation. The fraction of stars with IR excesses constrains the disk destruction timescale and thus the timescale for planet formation (Lada et al., 2002). The large number of young stars with identical ages and distances in a cluster allows statistical estimates for the luminosity and mass functions using off-cluster control fields. This information yields tests for the nature and the universality of the IMF (Lada & Lada, 2003; Muench et al., 2003).
3.1 Stellar density distribution
To test for the presence of a cluster in NGC 7538, we analyzed the stellar density distribution. We used the kernel method (Silverman, 1986) described in Gomez et al. (1993), which allows the fairly sparse stellar surface density to be smoothed. Briefly, the technique derives the surface density at a point on the sky from a weighted average of the observed stellar density smoothed over a length, . The kernel function provides the weighting:
| (1) |
and depends on the separation, , of each star. Gomez et al. (1993) derived satisfactory results using a gaussian kernel, which we adopted for simplicity
| (2) |
We adopted a smoothing length = 1.8” for the sparser SQIID data, = 1.3” for the denser STELIRCAM data and = 0.9” for the high spatial resolution FLAMINGOS data.
To analyze the stellar distribution in NGC 7538, we restricted the data to the common area covered by the SQIID, STELIRCAM, and FLAMINGOS surveys. We also divided the STELIRCAM data into two samples, a sample with the same limiting magnitude as the SQIID data and another sample using all of the STELIRCAM data. Fig. 2 shows the stellar density contours overlaid on maps of stellar positions. For comparison, Fig. 3 shows the density contours overlaid on a single SQIID frame and a 2MASS image of approximately the same area.
All of the stellar density maps indicate several high density peaks in NGC 7538. The SQIID and the STELIRCAM samples show a concentration of stars centered at = 23:13:39.34, = 61:29:18.9 (J2000) (SQIID; Fig 2, upper left panel) and = 23:13:38.93, = 61:28:51.6 (J2000) (STELIRCAM; Fig 2, upper right and lower left panels). In the deeper FLAMINGOS data (Fig. 2 lower right panel), the center of the concentration is roughly 1 arcmin to the NW, at = 23:13:36.35 = 61:30:08.8 (J2000). These centroids agree reasonably well with the peak derived from sources in the 2MASS point source catalog, = 23:13:38.84 = 61:29:01.05 (J2000), and with the southeastern part of the optical nebula centered at = 23:13:30.21 = 61:30:10.5 (J2000) (Wynn-Williams et al., 1974; Campbell & Persson, 1988). These peak positions suggest a cluster radius of 3’, 2.5pc for = 2.8 kpc.
The positions of the peaks in stellar density follow a clear trend. The peak in the shallow SQIID data is roughly 1 arcmin SE of the main peak in the deep FLAMINGOS data. A second concentration in the FLAMINGOS data coincides with the STELIRCAM peak around (1, -1) coordinates in the lower right panel of Fig 2 and lies between the SQIID peak and the main FLAMINGOS peak. These changes in the peak stellar density follow a trend first noted by McCaughrean et al (1991), who identified three concentrations along a SE-NW sequence. McCaughrean et al (1991) suggested that the three condensations form an age sequence, with the oldest set of stars in the NW and the youngest in the SE (see also Ojha et al., 2004). However the trend of McCaughrean et al (1991) refers to a larger scale. We consider this hypothesis below.
Despite the good agreement between the derived peaks in stellar density, the morphology of the contours changes with limiting magnitude and spatial resolution. The STELIRCAM data in the top right panel show an extra concentration of stars south of the main concentration which is missing in the SQIID data. This concentration is more pronounced in the deeper STELIRCAM data (bottom left). The deeper data also show a third concentration of stars to the east of the main concentration. With similar magnitude cuts, the 2MASS data show the same features.
The density contours derived from the deeper FLAMINGOS data suggest two main concentrations of comparable stellar density. The increasing density of the NW concentration suggests that it may be the densest part of the region.
Based on our shallow imaging data, the NGC7538 cluster at = 23:13:39.34, = 61:29:18.9 (J2000) is relatively sparse compared to other clusters. The measured central surface number density is 10.3 for the SQIID data, 14.7 for STELIRCAM data with , 16.9 for all STELIRCAM sources, and 97 for FLAMINGOS sources. These correspond to projected stellar surface densities of 15.5 (d / 2.8 kpc)-2 pc-2 (SQIID), 22.3 (d / 2.8 kpc)-2 pc-2 (STELIRCAM, K 15), 25.6 (d / 2.8 kpc)-2 pc-2 (complete STELIRCAM sample), and 146.5 (d / 2.8 kpc)-2 pc-2 (FLAMINGOS sample). The uncertain distance leads to a factor of 2–4 uncertainty in the projected surface density (Blitz et al., 1982; Campbell & Persson, 1988).
Scaled to the same limiting absolute magnitude, the stellar density in NGC 7538 is about an order of magnitude smaller than the density of the core of the Trapezium cluster (325 stars pc-2 for SQIID and STELIRCAM data and 694 stars pc-2 for FLAMINGOS data) (Muench et al., 2002). Compared to other young embedded clusters with densities of 10 and 100 stars pc-2 (see Lada & Lada, 2003, for references), the concentration in NGC 7538 is sparser than average from the SQIID and STELIRCAM surveys but still above the lower limits of 10–15 stars pc-2 for Gem1 and Gem4 (Lada & Lada, 2003). However, the FLAMINGOS data reveal many faint stars and resolved multiple sources invisible in shallower, lower resolution observations. Because the ratio of stellar densities between NGC 7538 and the Trapezium increases from 0.06 at 15 to 0.20 at 17.5, deeper images may demonstrate that the stellar density in NGC 7538 rivals that of the richest embedded clusters.
3.2 Reddening Law
Fig 2. shows several small concentrations of stars whose shape and visibility depend on the magnitude limit and the wavelength of observation. This structure could be caused by patchy extinction across a single embedded cluster, several clusters observed at different depths in the nebula, or the superposition of several clusters at different distances. To see which of these or other possibilities is correct, we need to consider the reddening law and the amount of reddening as a function of position across the cluster.
PMS stars often show a characteristic near-IR excess compared with reddened main-sequence stars (Kenyon & Hartmann, 1987; Bertout et al., 1988; Lada & Adams, 1992). Because IR excess objects generally fall outside the reddening band on the two-color () diagram, knowledge of the IR reddening law is necessary to distinguish PMS stars from main sequence stars.
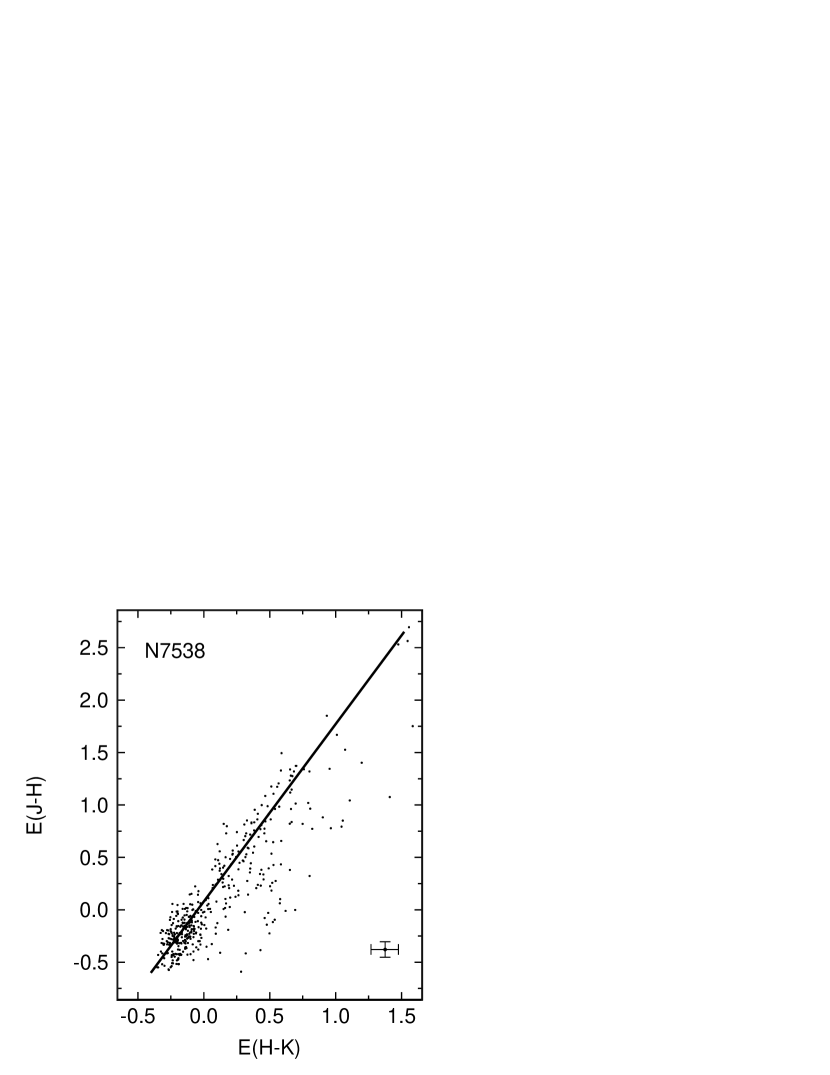
Using the technique described in Kenyon et al. (1998), we used background stars to derive the reddening law for the cloud. The method derives and color excesses for each star projected onto the cloud relative to sources in a relatively unreddened control field far from the cloud and assumes the reddening for a particular star is the average (or median) color excess. The slope of the reddening law is then defined as the slope of the best-fitting line to the color excess measurements.
Kenyon et al. (1998) also define the reddening probability function, which is the chance of measuring a pair of color excesses, to quantify errors in the estimate for the slope of the reddening law. This density function depends on the distribution of colors in the off-field and on-field stars. To measure the color distribution, Kenyon et al. (1998) used a kernel density estimator with a simple kernel and smoothing length (see Silverman, 1986).
Fig. 4 shows the extinction measurements for stars with mag in the direction of NGC 7538. Stars without NIR excess emission yield . This slope is in the range, = 1.57–2.08, derived for other clouds using the same technique. Previous results suggest that the slope of the NIR reddening law correlates with the star formation activity, with shallower slopes in more active star formation regions (Kenyon et al., 1998; Gómez & Kenyon, 2001; Racca et al., 2002). The slope derived for NGC 7538 places it between Oph ( = 1.57) and Cha I ( = 1.80).
3.3 Color-magnitude and color-color diagrams
Together with the reddening law, the NIR color-color diagram provides one way to identify PMS stars in an embedded cluster. PMS stars often show NIR excesses due to the presence of a circumstellar disk (Kenyon et al., 1996, and references therein) which places them to right of the reddening band in the diagram. Fitting the zero-age main sequence (ZAMS) and isochrones for PMS stellar evolution tracks on the color-magnitude ( and () diagram yield estimates for the cluster parameters like reddening and distance.
The left panel of Fig. 5 shows the color-color diagram for NGC 7538. The reddening law from the previous section allows us to divide the diagram into several parts. The reddening band contains about 60% of the NIR sources. Most of the remaining stars have varying amounts of NIR excess emission, with NIR colors similar to colors predicted by disk models (Adams et al., 1987; Kenyon & Hartmann, 1987; Kenyon et al., 1996; Meyer et al., 1997; Chiang & Goldreich, 1997). However, there is a small group of 15 stars with NIR colors that are inconsistent with disk models, 1–1.5 and 0. These stars could be planetary nebulae (Whitelock, 1985) or B[e] stars (Zickgraf, 2000). Mid-infrared photometry or NIR spectroscopy is needed to classify these sources. Finally, roughly 5% of the sample lies above the reddening band. Unless these sources are dominated by scattered light from the cloud (see Whitney et al., 1997), the colors of these sources are unphysical. Because most of the sources are relatively faint (), we suspect that photometric error or nebular contamination is responsible for the colors of these sources (see below).
The stars in the reddening band show that the reddening in the field of NGC 7538 is variable. The observed color excesses range from to . For a normal reddening law, these excesses yield a range in visual extinction from mag to mag (Bessell & Brett, 1988). Stars with modest excesses are scattered randomly across the field and have colors similar to stars in the control field. Most of these sources are probably nearby, with distances of 1–2 kpc or less (e.g., Neckel et al., 1980; Hakkila et al., 1997). The highly reddened stars are concentrated near the optical nebula, in the main SQIID concentration of NIR sources described above. Most stars with colors above the reddening band or with colors similar to planetary nebulae or B[e] stars are in the brightest parts of the nebula, suggesting that direct or scattered light from the H II region might contaminate the measured colors.
Fig. 2 shows that peaks in the stellar density distributions in the SQIID and STELIRCAM datasets lie within a dense concentration of stars in the deeper FLAMINGOS image. This concentration is roughly 1’ SE of the main FLAMINGOS peak. More than half (56%) of the stars in this concentration have an IR excess, compared to 37 for the total sample. Roughly 34 of all IR excess stars lie in this concentration, which covers about 8 of the observed field. This result provides further evidence for a young cluster in NGC 7538.
To test whether the NIR excess sources are clustered, we performed a two dimensional KS-test (Press et al., 1993). For simplicity, we defined a circular area with radius of 0.05 deg centered on the density maximum (§3.1) and compared the distribution of colors for stars within the circle to the colors of stars outside the circle. We also checked whether sources with and without IR excess are randomly distributed in the concentration (within the circle with 0.05 deg radius). The probability that the two groups of sources are selected randomly from the same parent distribution is smaller than for both cases. We conclude that the NIR excess sources preferentially lie in the cluster and that they are not from the same population of stars as the stars without IR excess.
To test the conclusions of McCaughrean et al (1991), the right panel of Fig. 5 shows colors for three spatial regions in NGC 7538. We identified 30 stars in region 1 of McCaughrean et al (1991). All of these are heavily reddened. In our data, regions 2 (131 stars including IRS 1-3) and 3 (138 stars) have comparable numbers of stars. The stars in region 2 are more heavily reddened than those in region 3 but less heavily reddened than stars in region 1. On average, the stars in all three regions are more heavily reddened than stars in the control field. Thus the sequence in stellar density forms a sequence in reddening, with the most heavily reddened stars in the SE portion of the nebula and the least reddened stars in the NW portion (see also Ojha et al., 2004).
The IR color-magnitude diagram (CMD) also provides information on the stellar population of the cluster. Comparisons between observations and model isochrones yield approximate ages for stars in the cluster, another measure of the reddening, and confirmation of the relative numbers of stars with and without NIR excess. The observations can also provide tests of model isochrones, especially for the youngest stars where the physics of stellar formation and evolution remains uncertain (Siess et al., 2000; Baraffe et al., 1998, 2003; Burrows et al., 1997; D’Antona & Mazzitelli, 1994).
Fig. 6 and 7 show the color magnitude diagrams (Fig. 6: , Fig. 7. ) of NGC 7538. The left panels of each figure show all stars in the sample; the right panels show only stars in the concentration (see Fig. 5 for the meaning of the symbols). Stars with low reddening are close to the ZAMS in each figure. For 0.55 and 0.19, the model ZAMS indicates a distance of 2.1 kpc for these stars. This result strengthens the conclusion that these stars are foreground to the cluster.
Stars with NIR excess occupy different regions of the CMDs. Although some stars lie close to the ZAMS or the 1 Myr isochrone with small reddening, 0.50 and 0.19, most stars require additional reddening. For a modest IR excess, 0.2–0.5 mag at K, most NIR excess stars require 0.4–0.7 and 1.2–1.8 to fall near the 1 Myr isochrone of Siess et al. (2000). For these isochrones, the most heavily reddened stars are the youngest. Stars with the largest NIR excesses are also younger than stars with smaller NIR excess. However, the age differences are small and require accurate spectral types for confirmation.
Tests with isochrones derived by other groups yield similar results. For the D’Antona & Mazzitelli (1997, and references therein) and the Palla & Stahler (1999) tracks, most of the heavily reddened stars lie between the ZAMS and 1–2 Myr isochrones (see also Ojha et al., 2004). Stars with NIR excess require 0.3–0.8 and 1–2, in agreement with results for the Siess et al. (2000) tracks. For these young, relatively massive stars, the tracks are uncertain. Thus, our age estimates should be taken as an indication that the most heavily reddened stars and stars with NIR excesses are young stars that have not yet arrived on the ZAMS.
The PN or B[e] star candidates cluster around the same areas in each CMD. These stars do not obviously fit the ZAMS or a pre-main sequence isochrone. The stars above the reddening band in Fig. 5. are roughly randomly distributed on both CMDs. In both cases, flux from the nebula or photometric errors probably displace these stars from the ZAMS or the 1 Myr isochrone.
To estimate a lower limit to the distance and the amount of extinction to the concentration, we fit the ZAMS of Siess et al. (2000) to the blue edge of distribution of stars in the diagram. This exercise yields = 0.55 0.05 and a distance modulus of 11.6 0.2 mag, which corresponds to a distance of about 2.1 kpc. This distance agrees with the distance derived for the foreground stars and is somewhat lower than the commonly accepted = 2.8 0.9 (Blitz et al., 1982; Campbell & Persson, 1988) for NGC 7538. NIR spectra of sources in the concentration would provide better estimates for the distance and reddening.
4 Luminosity and color functions
The cluster CMDs indicate that most of the young stars with NIR excess fall close to a 1 Myr isochrone, with extinction and distance appropriate for an embedded cluster within the NGC 7538 nebula. Although we confirm the McCaughrean et al (1991) identification of three distinct concentrations of stars within the nebula, we do not confirm the proposed range in stellar ages. In our data, the large dispersion in the reddening for stars in these groups precludes assigning accurate ages. Because the shape of the luminosity function depends on the age of a cluster (Muench et al., 2003), we now consider whether we can distinguish the ages of stars in the concentrations through analysis of the luminosity function.
There are several ways to estimate the IMF from infrared observations. Because stars in most clusters have measured colors but not spectra, luminosity functions (LFs) or CMDs allow better statistical comparison between data and models than H-R diagrams (HRDs). However, the evolutionary tracks used in model LFs are uncertain, which leads to less precision compared to model HRDs. Color magnitude diagrams enhance the precision by replacing effective temperature with NIR colors, but extinction, NIR excess emission, and starspots complicate assigning appropriate dereddened colors for pre-main sequence stars (Kenyon & Hartmann, 1995).
Among others, Lada et al. (1991b, 1993a) used cumulative logarithmic KLFs to estimate the slope of the IMF for several embedded clusters, including NGC 2023, NGC 2024, NGC 2068 and NGC 2071 in the L1630 molecular cloud and NGC 2264. More recently Muench et al. (2002, 2003) carried out a similar analysis for IC 348 and the Trapezium. To put NGC 7538 in context with these studies, we analyze the KLF and then compare our results with results for other regions.
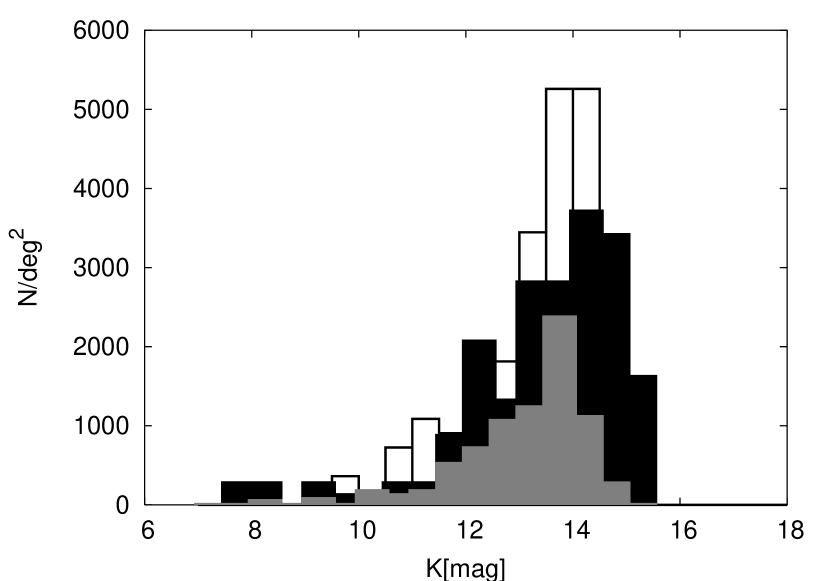
Fig. 8 shows the -band luminosity function of NGC 7538. In the left panel the hollow histogram is the KLF of the concentration (within a 0.05 deg circle around the peak stellar density). The filled histogram is the KLF for the remaining sources. The right panel shows the histogram of the two larger subgroups (McCaughrean et al (1991)’s regions 2 and 3) together with the histogram of sources outside the concentration. Due to the small number of sources, the bins are relatively wide, 0.5 mag. We also exclude sources from region 1 of McCaughrean et al (1991). The small number of stars detected in this region precludes reliable statistics for the KLF.
The KLF has several main features which are observable in both panels. The concentration has a larger density of sources than the surroundings (§3.1). The peak of the KLF for the concentration is roughly 0.5 mag fainter than the KLF for the surroundings. The shapes of the two histograms are also different. Outside the concentration, there is a rapid rise before the peak. Inside the concentration, there is an excess of bright stars and the rise in the histogram is more gradual. In the right panel, the peak of the population in region 3 is shifted to fainter magnitudes and has an excess of fainter stars relative to the rest of the condensation. Muench (2002) showed that the KLFs of older clusters peak at fainter magnitudes. Because region 3 has smaller extinction than the rest of the condensation, the shift of the peak of the histogram thus strengthens the hypothesis of McCaughrean et al (1991) that region 3 contains older stars than region 2.
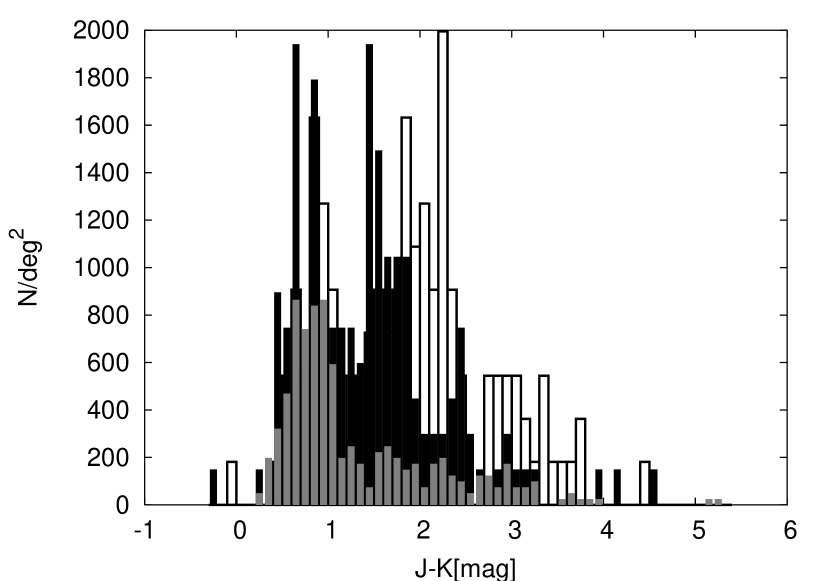
To test whether extinction is the most likely cause for the shift in the KLF between the concentration and the remaining part of the area, we examined the color distributions (Fig. 9 left panel). The stars outside the concentration show a nearly Gaussian distribution around one peak (). The full-width at half maximum of the gaussian is . The number of sources decreases sharply towards larger J-K. In contrast, the concentration has a double-peaked histogram. One group of stars has a distribution nearly identical to the off-cluster histogram; the other group contains stars roughly 0.7-0.8 mag redder. The dispersion in the red peak is roughly twice as large as the dispersion in the blue peak.
In both histograms, foreground stars produce the blue peak. The density of stars in front of the concentration and off the concentration is roughly equal. The peaks fall in the range occupied by MS stars with masses exceeding 1 ( -0.18 to 0.51 (Siess et al., 2000)) and reddening, = 0.55, smaller than the reddening in the cluster (§3.3). The dispersion in the color distribution is close to the range in NIR reddening expected from the optical extinction maps (Neckel et al., 1980; Hakkila et al., 1997).
Extra reddening and near-IR emission emission produce the second peak in the histogram for the concentration. From the values of §3.3 and our reddening law, from reddening is 0.1–2.4. The contribution of the intrinsic IR excess from a circumstellar disk is 0.35–0.75 (Kenyon et al., 1996). The combination of reddening and near-IR excess yields a total color excess of 0.45–3.15 in J-K, consistent with the extent of the second peak in Fig. 9.
In summary, we can unambiguously confirm a sequence in reddening for the three condensations of McCaughrean et al (1991) but the CMD does not yield a clear conclusion regarding an age sequence. The 1 Myr isochrone and ZAMS are too close together to draw a meaningful conclusion. Deeper images, which detect 0.1-0.5 Msun stars, might be able to distinguish the ages of the regions. The KLF suggests an age sequence, but we cannot be certain.
The right panel of Fig. 9 provides a consistency check on our claim that region 2 is more heavily reddened than region 3. The peak of the color histogram for region 2 is 0.8 mag redder than the peak of region 3, confirming that this region is more heavily reddened.
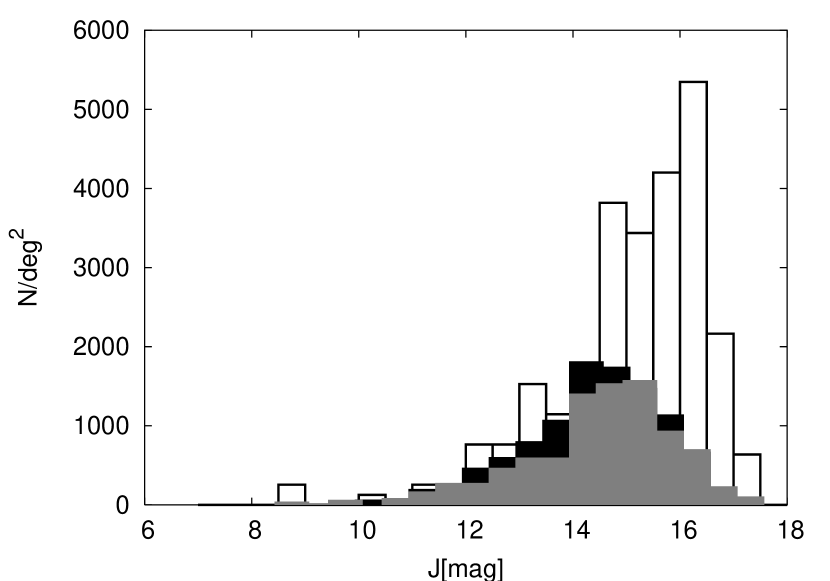
The embedded cluster accounts for the breadth of the reddened histogram in Fig. 9. Off the cluster, we see a modest range in galactic reddening. On the cluster, we see galactic reddening plus a range in reddening through the molecular cloud to the cluster. The separation of the two peaks in the histogram implies an extra extinction of mag (Bessell & Brett, 1988). The broad red tail of the red histogram represents reddening in and beyond the cluster. To demonstrate this conclusion, Fig. 10 plots the J-band LF for (i) off the cluster, (ii) on the cluster but outside the main concentration, and (iii) on the main concentration. The reddening clearly increases along this sequence.
To analyze the cumulative KLF, we consider a complete sample of the NIR survey. In the top panels of Fig. 11, the KLF contains stars with 15.5, which corresponds to stars of 1.15 M⊙ at the adopted cluster distance of 2.8 kpc. From the 2MASS, SQIID, and STELIRCAM data, we estimate a completeness limit of K 14.5, corresponding to stars with masses of at least 1.55 M⊙. This limit is shallower than KLFs for most nearby clusters, which often reach below 1 M⊙ (see Lada & Lada, 2003).
To derive the slope of the KLF for our complete sample, we separated the stars into three main groups, (i) the concentration, (ii) the off-cluster field, and (iii) the on-cluster field around the concentration. We further divided the concentration into three groups according to McCaughrean et al (1991). We counted the stars in each region and normalized this result. Subtracting the normalized KLF of the off-cluster fields from the concentration yields the difference, log10 (), as a function of K magnitude. A straight line fit to this function results in a slope, = 0.29 0.02. Fitting the logarithmic difference between the concentration and the on-cluster field yields = 0.34 0.02. To limit errors in the slope of the KLF from small number statistics, we limited this analysis to stars with = 11–14.5 mag.
To check whether the cumulative KLFs of different regions yield different results we repeated the analysis for regions 2 and 3. Despite the fact that the KLFs for the two regions peak at different magnitudes, the derived slopes for the two regions are indistinguishable from those for the complete condensation (see Fig. 11). Both results agree with estimates of Lada et al. (1991b, a). The similarity in the slopes supports the hypothesis of Muench (2002) for young clusters that the KLFs for regions with large age spreads ( 5 Myr) are hard to distinguish from KLFs of regions where all the stars are the same age.
As a final check on the slope of the KLF, we repeated this analysis for the deep FLAMINGOS data. Here, we limited the analysis to stars with = 11–16 mag. For all stars in the concentration, we derive = 0.35 0.01. Dividing the area into the three regions of McCaughrean et al (1991) and all other stars, we derive = 0.25 0.02 (region 1), = 0.35 0.02 (region 2), and = 0.37 0.02 (region 3). The change in from region 1 to regions 2 and 3 is real and an indication that region 1 contains the youngest stars in NGC 7538. Ojha et al. (2004) derive similar results from their deeper survey of a smaller area centered on the cluster.
If we assume a power law IMF and coeval star formation, we can derive a crude estimate for the slope of the IMF from the slope of the cumulative KLF. We define the IMF and the mass-luminosity relation as power laws.
| (3) |
| (4) |
where and are spectral indices of the IMF and the mass luminosity relation, respectively (Lada et al., 1993a). For O-F type stars = 2.0 (Lada et al., 1993a). The slope of the logarithmic KLF is then (Bloomer, 2002)
| (5) |
Bloomer (2002) also shows that the slope of the logarithmic KLF is equal to the slope of the cumulative KLF.
The average slope of the KLF ( = 0.32) implies . This value is much steeper than the Salpeter value. Smaller would result in a significantly shallower slope of the IMF.
With known, the total mass in the concentration follows from an integral over the IMF. To compare our result with estimates for other young clusters we chose the mass range of 1–120 for the integration. For this mass range the concentration contains 790 . This mass is comparable to the mass in the Orion Nebula cluster and the Pleiades ( 450 ; (Slesnick et al., 2002)) and 4–5 times smaller than the mass in h (3700 ) or (2800 ) Persei (Slesnick et al., 2002).
5 Conclusions
We conducted two independent NIR surveys of the vicinity of the galactic H II region NGC 7538. A shallow map of 230 arcmin2 in JHK contains 600 NIR sources with 14; deeper K band imaging has 2000 NIR sources with 15.5 and 9000 sources with 17.5. Our analysis of these surveys yields the following results.
-
•
In all surveys, the stellar density distribution is sharply peaked at = 23:13:39.37, = 61:29:13.01. The peak stellar density is within the range observed in other young clusters. The deeper imaging data suggests the cluster has two or three main concentrations. 2MASS data confirm this point.
-
•
We use the , two-color diagram to derive the slope of the reddening law, = 1.69. The slope of the reddening law agrees with results for other star forming regions. Stars within the main peak in the stellar density are much more heavily reddened than stars in a control field well off the peak.
-
•
The two-color diagram and the stellar density map indicate that the cluster contains many young stars with NIR excesses. The fraction of cluster stars with NIR excess is 30%. Cluster stars are more heavily reddened than stars in the surrounding area. The NIR excess source fraction is somewhat lower than the expected value of 80%-50% for a 1-3 Myr old cluster. A fraction of 30% is more typical of 4 Myr old clusters (Lada et al., 2002) and indicates an age closer to 4 Myr for stars in the SQIID sample. However, we note that fainter stars in the region appear younger, suggesting that deeper JHK surveys will detect stars with ages closer to 1 Myr (Ojha et al., 2004).
-
•
Fits of the Siess et al. (2000) isochrones to the blue edge of the color magnitude diagram yield lower limits for the cluster reddening , and the distance, kpc. These values agree with the previous estimates (eg. Blitz et al., 1982; Campbell & Persson, 1988). On the NIR CMD, most stars in the concentrations fall between a 1 Myr old isochrone and the ZAMS. However, the large spread in reddening among these stars prevents a robust estimate of their age.
-
•
The slope of the cumulative logarithmic KLF of the cluster is = 0.32 0.03. This slope agrees with results for other star forming regions (Lada et al., 1991b, a). The slope of the KLF for region 1 of McCaughrean et al (1991) suggests that stars in this region are much younger than stars in the rest of the cluster. The KLF does not yield an obvious difference in age between regions 2 and 3 of McCaughrean et al (1991).
Finally, deeper multicolor imaging data and spectroscopic observations with a large aperture telescope would allow improved constraints on our derived parameters. Deeper multicolor imaging would place better limits on the stellar density in regions 1–3 and provide better estimates for the variation in extinction from region to region. NIR spectroscopy would yield spectral types and allow the construction of a robust HRD. Comparison with modern isochrones would provide more accurate ages and a test of the apparent change in mean stellar ages from region 1 to regions 2–3.
References
- Adams et al. (1987) Adams, F. C., Shu, F. H., & Lada, C. J. 1987, BAAS, 19, 1096
- Baraffe et al. (2003) Baraffe, I., Chabrier, G., Allard, F., & Hauschildt, P. 2003, in Brown Dwarfs, Proceedings of IAU Symposium #211, held 20-24 May 2002 at University of Hawaii, Honolulu, Hawaii. Edited by Eduardo Mart n. San Francisco: Astronomical Society of the Pacific, 41
- Baraffe et al. (1998) Baraffe, I., Chabrier, G., Allard, F., & Hauschildt, P. H. 1998, A&A, 337, 403
- Barsony et al. (1997) Barsony, M., Kenyon, S. J., Lada, E. A., & Teuben, P. J. 1997, ApJS, 112, 109
- Bertin & Arnouts (1996) Bertin, E. & Arnouts, S. 1996, A&AS, 117, 393
- Bertout et al. (1988) Bertout, C., Basri, G., & Bouvier, J. 1988, ApJ, 330, 350
- Bessell & Brett (1988) Bessell, M. S. & Brett, J. M. 1988, PASP, 100, 1134
- Bica et al. (2003) Bica, E., Dutra, C. M., Soares, J., & Barbuy, B. 2003, A&A, 404, 223
- Blitz et al. (1982) Blitz, L., Fich, M., & Stark, A. A. 1982, ApJS, 49, 183
- Bloomer et al. (1998) Bloomer, J. D., Watson, D. M., Pipher, J. L., Forrest, W. J., Ali, B., Greenhouse, M. A., Satyapal, S., Smith, H. A., Fischer, J., & Woodward, C. E. 1998, ApJ, 506, 727
- Bloomer (2002) Bloomer, J. D. 1998 PhD thesis
- Boily & Kroupa (2003a) Boily, C. M. & Kroupa, P. 2003a, MNRAS, 338, 665
- Boily & Kroupa (2003b) —. 2003b, MNRAS, 338, 673
- Bonnell et al. (2003) Bonnell, I. A., Bate, M. R., & Vine, S. G. 2003, MNRAS, 343, 413
- Burrows et al. (1997) Burrows, A., Marley, M., Hubbard, W. B., Lunine, J. I., Guillot, T., Saumon, D., Freedman, R., Sudarsky, D., & Sharp, C. 1997, ApJ, 491, 856
- Campbell & Persson (1988) Campbell, B., & Persson, S. E. 1988, AJ, 95, 1185
- Chiang & Goldreich (1997) Chiang, E. I. & Goldreich, P. 1997, ApJ, 490, 368
- D’Antona & Mazzitelli (1994) D’Antona, F. & Mazzitelli, I. 1994, ApJS, 90, 467
- D’Antona & Mazzitelli (1997) D’Antona, F., & Mazzitelli, I., 1997, In: Pallavicini R., Micela G. (eds.) Cool Stars in Clusters and Associations. Mem. Soc. Astron. Ital. 68, 807
- Dutra et al. (2003) Dutra, C. M., Bica, E., Soares, J., & Barbuy, B. 2003, A&A, 400, 533
- Eiroa et al. (2002) Eiroa, C., Oudmaijer, R. D., Davies, J. K., de Winter, D., Garzón, F., Palacios, J., Alberdi, A., Ferlet, R., Grady, C. A., Cameron, A., Deeg, H. J., Harris, A. W., Horne, K., Merín, B., Miranda, L. F., Montesinos, B., Mora, A., Penny, A., Quirrenbach, A., Rauer, H., Schneider, J., Solano, E., Tsapras, Y., & Wesselius, P. R. 2002, A&A, 384, 1038
- Elias et al. (1982) Elias, J. H., Frogel, J. A., Matthews, K., & Neugebauer, G. 1982, AJ, 87, 1029
- Ellis et al. (1993) Ellis, T. A., Drake, R., Fowler, A. M., Gatley, I., Heim, G. B., Luce, R. W., Merrill, M., Probst, R. G., & Buchholz, N. C. 1993, in SPIE Vol.1765: Cryogenic Optical Systems and Instruments V, 94
- Friel (1995) Friel, E. D. 1995, ARA&A, 33, 381
- Gómez & Kenyon (2001) Gómez, M. & Kenyon, S. J. 2001, AJ, 121, 974
- Gomez et al. (1993) Gomez, M., Hartmann, L., Kenyon, S. J., & Hewett, R. 1993, AJ, 105, 1927
- Hakkila et al. (1997) Hakkila, J., Myers, J. M., Stidham, B. J., & Hartmann, D. H. 1997, AJ, 114, 2043+
- Kenyon & Hartmann (1987) Kenyon, S. J. & Hartmann, L. 1987, ApJ, 323, 714
- Kenyon & Hartmann (1995) —. 1995, ApJS, 101, 117+
- Kenyon et al. (1998) Kenyon, S. J., Lada, E. A., & Barsony, M. 1998, AJ, 115, 252
- Kenyon et al. (1996) Kenyon, S. J., Yi, I., & Hartmann, L. 1996, ApJ, 462, 439
- Lada & Adams (1992) Lada, C. J. & Adams, F. C. 1992, ApJ, 393, 278
- Lada et al. (1991a) Lada, C. J., Depoy, D. L., Merrill, K. M., & Gatley, I. 1991a, ApJ, 374, 533
- Lada & Lada (2003) Lada, C. J. & Lada, E. A. 2003, ARA&A, 41, 57
- Lada et al. (2002) Lada, C. J., Lada, E. A., Muench, A. A., Haisch, K. E., & Alves, J. 2002, in The Origins of Stars and Planets: The VLT View. Proceedings of the ESO Workshop held in Garching, Germany, 24-27 April 2001, p. 155., 155–+
- Lada et al. (1993a) Lada, C. J., Young, E. T., & Greene, T. P. 1993a, ApJ, 408, 471
- Lada et al. (1991b) Lada, E. A., Evans, N. J., Depoy, D. L., & Gatley, I. 1991b, ApJ, 371, 171
- Lada et al. (1993b) Lada, E. A., Strom, K. M., & Myers, P. C. 1993b, in Protostars and Planets III, 245–277
- McCaughrean et al (1991) McCaughrean, M., Rayner, S., & Zinnecker, H. 1991 Mem. S.A.It. 62, 715
- Meibom et al. (2002) Meibom, S., Andersen, J., & Nordström, B. 2002, A&A, 386, 187
- Meyer et al. (1997) Meyer, M. R., Calvet, N., & Hillenbrand, L. A. 1997, AJ, 114, 288
- Momose et al. (2001) Momose, M., Tamura, M., Kameya, O., Greaves, J. S., Chrysostomou, A., Hough, J. H., & Morino, J.-I. 2001, ApJ, 555, 855
- Muench et al. (2002) Muench, A. A., Lada, E. A., Lada, C. J., & Alves, J. 2002, ApJ, 573, 366
- Muench (2002) Muench, A. A. 2002 PhD thesis
- Muench et al. (2003) Muench, A. A., Lada, E. A., Lada, C. J., Elston, R. J., Alves, J. F., Horrobin, M., Huard, T. H., Levine, J. L., Raines, S. N., & Román-Zúñiga, C. 2003, AJ, 125, 2029
- Neckel et al. (1980) Neckel, T., Klare, G., & Sarcander, M. 1980, A&AS, 42, 251
- Ojha et al. (2004) Ojha, D. K., et al. 2004, ApJ, in press (astro-ph/0408219)
- Palla & Stahler (1999) Palla, F., & Stahler, S. W. 1999, ApJ, 525, 772
- Press et al. (1993) Press, W. H., Flannery, B. P., Teukolsky, S. A., & Vetterling, W. T. 1993, Numerical Recipes in C:The Art of Scientific Computing (Cambridge University Press)
- Racca et al. (2002) Racca, G., Gómez, M., & Kenyon, S. J. 2002, AJ, 124, 2178
- Siess et al. (2000) Siess, L., Dufour, E., & Forestini, M. 2000, A&A, 358, 593
- Silverman (1986) Silverman, B. W. 1986, Density estimation for statistics and data analysis (Monographs on Statistics and Applied Probability, London: Chapman and Hall, 1986)
- Slesnick et al. (2002) Slesnick, C. L., Hillenbrand, L. A., & Massey, P. 2002, ApJ, 576, 880
- Ungerechts et al. (2000) Ungerechts, H., Umbanhowar, P., & Thaddeus, P. 2000, ApJ, 537, 221
- Werner et al. (1979) Werner, M. W., Becklin, E. E., Gatley, I., Matthews, K., Neugebauer, G., & Wynn-Williams, C. G. 1979, MNRAS, 188, 463
- Whitelock (1985) Whitelock, P. A. 1985, MNRAS, 213, 59
- Whitney et al. (1997) Whitney, B. A., Kenyon, S. J., & Gomez, M. 1997, ApJ, 485, 703
- Wynn-Williams et al. (1974) Wynn-Williams, C. G., Becklin, E. E., & Neugebauer, G. 1974, ApJ, 187, 473
- Yao et al. (2000) Yao, Y.-Q., Chen, Y.-F., Yang, J., Takanori, H., Nagata, T., & Sato, S. 2000, Acta Astronomica Sinica, 41, 2
- Zickgraf (2000) Zickgraf, F. 2000, in ASP Conf. Ser. 214: IAU Colloq. 175: The Be Phenomenon in Early-Type Stars, 26–+
- Zinnecker et al. (1993) Zinnecker, H., McCaughrean, M. J., & Wilking, B. A. 1993, in Protostars and Planets III, 429–495