Studying circumnuclear matter in AGN with X-ray spectroscopy
Abstract
I discuss the advances in our understanding of the physics and morphology of the innermost regions of AGNs which will be possible thanks to the XMM unprecedented sensitivity and its moderate to high energy resolution.
1 Introduction
Before entering into details, it may be useful to recall the basic picture of the nuclear X–ray emission of Seyfert galaxies after the pre-XMM satellites (e.g. Mushotzky, Done & Pounds 1993; Fabian 1996; Matt 1998). The main component is a power law, possibly cut–offing at energies of order of a few hundred keV, and very likely due to Inverse Compton by relativistic electrons of UV/soft X–ray photons, the latter possibly emitted by the accretion disc (see e.g. Svensson 1996 for a review). A significant fraction of this radiation is intercepted and reprocessed by the accretion disc. The spectrum emerging from the cold matter is composed by a broad hump peaking at around 30 keV (the Compton reflection continuum) and a strong iron 6.4 keV fluorescent line. Kinematic and gravitational effects in the inner accretion disc are apparent in the line profile.
In this paper I will assume the unification model for Seyfert galaxies (Antonucci 1993): type 1 and 2 objects are intrinsically identical (at least as far as the nuclear properties are concerned), and surrounded by a pc-scale molecular torus. If the line–of–sight does not intercept the torus, the nucleus can be directly observed and the source is classified as type 1; if the line–of–sight is blocked by the torus, the source is classified as type 2. I will come back to unification models in Sec. 2. It is worth noticing here that the torus may also reprocess part of the primary radiation, giving rise to a component similar to that from the accretion disc. More on this point in Sec. 2.2
The paper is organized as follows: Sec. 2 is devoted to Seyfert 1 galaxies; both warm absorbers and the reprocessing from the torus are discussed. In Sec. 3 I will discuss Seyfert 2 galaxies, and in particular Compton–thick ones. Sec. 4 will ve devoted to the study of faint AGNs.
2 Seyfert 1 Galaxies
Reprocessing from the accretion disc, and in particular the relativistic effects on the iron line profile, have been discussed by Fabian in this conference. I will therefore concentrate on more distant matter, and in particular on the “warm absorber” and on the torus.
2.1 Warm absorbers
2.1.1 Generalities
“Warm absorbers”, i.e. (photo)ionized matter on the line–of–sight, were introduced by Halpern (1984) to account for the spectral variability observed in the quasar MR 2251–178. A spectacular and more direct confirmation of the existence of circumnuclear ionized matter came from the ROSAT/PSPC observation of MCG–6-30-15, the Seyfert 1 galaxy which is so famous for its relativistic line (Tanaka et al. 1995; Fabian, this conference): oxygen absorption edges were clearly detected (Nandra & Pounds 1992). The next step forward came with ASCA, which for the first time has been able, thanks to the improved energy resolution provided by the CCDs, to resolve the O vii and O viii absorption edges (Fabian et al. 1994). Systematic studies of warm absorbers in Seyfert 1 galaxies with ASCA have permitted to establish their commonness, being detected in at least half of the sources (Reynolds 1997; George et al. 1998). I will come back to this point in Sec. 2.1.2.
What are the signatures of warm absorbers? Detailed models have been produced by several authors (e.g. Netzer 1993; Reynolds & Fabian 1995; Krolik & Kriss 1995; Nicastro et al. 1998a; Nicastro, Fiore & Matt 1998; Porquet et al. 1998). Since the early days, it was clear that the best observable features are the photoelectric absorption edges, and up to now they are in fact the only features unambiguously detected. Netzer (1993) argued that emission lines are also to be expected, their intensity depending on the covering factor of the ionized matter. Matt (1994) and Krolik & Kriss (1995) pointed out the potential importance of absorption lines. While absorption edges are observable with moderate energy resolution but sensitive instruments (which is the reason why they have been so well studied by ASCA, and detected even by proportional counters), both emission and absorption lines require high energy resolution detectors, like the gratings. I will show below how their diagnostic capabilities can be exploited by the XMM/RGS.
Usually, warm absorbers are described by single zone, photoionization equilibrium models. In this situation, simple variability patterns are expected: increasing ionization of the matter when the source brightens. As usual, nature is more complex. The best example is again MCG–6-30-15. During the long–look ASCA observation (Otani et al. 1996) the source varied with large amplitude on short time scales. The depth of the O vii edge, on the contrary, stayed almost constant, while that of the O viii edge was roughly anticorrelated with the flux. While the last behaviour could be easily explained (higher the flux, higher the fraction of fully stripped iron at the expense of H–like one), the behaviour of the O vii edge was completely at odds with any simple model. The author’s suggestion is that there are actually two different regions were warm absorption occurs. The first one would be very close to the nucleus and highly ionized, and responsible for the bulk of O viii absorption. The second region would be more distant, less ionized and rather tenuous, so that the recombination time scale would be longer than the variability time scale, i.e. the matter would not be in photoionization equilibrium. Lack of photoionization equilibrium was invoked by Orr et al. (1997) also for the first zone to account for the fact that during the BeppoSAX observation also the O viii edge versus flux anticorrelation disappeared. Warm absorbers out of equilibrium have been studied in some detail by Nicastro et al. (1998a), who show that different ions respond on different time scales to variations in the ionizing continuum, so confusing attempts to derive the properties of the warm absorbers.

2.1.2 Are warm absorbers ubiquitous?
Reynolds (1997) and George et al. (1998) studied a large sample of Seyfert 1 galaxies observed by ASCA. Evidence for ionized absorption (i.e. absorption edges, especially of oxygen ones) was found in at least half of the sources, indicating that warm absorbers are rather common. Common or ubiquitous? There are at least three possibilities to explain the lack of evidence for ionized absorption in the other half of the sample:
-
•
The optical depth of the absorption edges is too small to be detectable (as an extreme case, it may be zero, i.e. ionized matter would be absent altogether). Typical upper limits for the O vii edge are around 0.1 for bright sources. The much larger sensitivity of XMM/EPIC with respect to the ASCA/SIS will permit to probe much lower column densities. As an example, in Fig. 1 we show the spectrum and residuals when a simple power law is fitted to a simulated 30 ksec EPIC/PN spectrum including O vii and O viii absorption edges with =0.07. The 2–10 flux of the source is 2 erg cm-2 s-1, i.e. bright but not extreme. A 2 cm-2 column density has been included to account for Galactic absorption. The oxygen edges are apparent in the residuals. The optical depths of the edges are recovered with 20% accuracy.
-
•
A different explanation may be that in these sources the matter is so highly ionized to significantly reduce the optical depths of O vii and O viii edges, i.e. the best signatures of warm absorbers with ASCA. Small, residual O viii absorption edges and/or iron edges should be then searched for. Again, high sensitivity is required, and XMM/EPIC is the most suited instrument in the near future.

Figure 2: RGS simulated spectrum of a power law plus He– and H–lile oxygen emission lines with EW=3 eV each. The plot show the residuals after fitting the spectrum with a simple power law. -
•
Finally, it may be possible that the covering factor of the warm absorbers is less than 1. In this case, warm absorbers are detected only in those sources in which they happen to be on the line of sight. In the other cases, however, warm absorbers may be indirectly observed through emission lines, which are expected to be produced in the warm material (Netzer 1993). Unfortunately, line equivalent widths (EWs) are expected to be very small, hopelessly so for moderate energy resolution detectors like CCDs. With the gratings, however, it is a different story. Lines should be narrow enough (i.e. a few eV for oxygen lines emitted in region with dispersion velocities typical of the Broad Line Regions) to be a perfect target for the XMM/RGS. This is demonstrated in Fig. 2, where a power law spectrum plus O vii and O viii narrow (i.e width set to zero for simplicity) emission lines is shown. Parameters of the source are as in Fig. 1. The simulation is for the first order RGS only; the exposure time is 30 ksec. The EWs of the lines are 3 eV each, a reasonable value for typical warm absorbers (Netzer 1996). The detection of the lines is highly significant: warm absorbers may be successfully searched for even if we are not observing absorption, after all!
2.1.3 Warm absorbers in Narrow Line Seyfert 1 galaxies
Narrow Line Seyfert 1 galaxies (NLS1s: e.g. Boller, Brandt & Fink 1996; see Brandt 1998 for a recent review) are a subclass of Seyfert 1s with Broad Lines narrower than usual (but still broader than the Narrow Lines). Apart from this rather confusing (at least semantically) optical properties, they differ in X–rays from classical Seyfert 1s because of a much steeper spectrum in soft X–rays (and somewhat steeper in hard X–rays, too) as well as a larger variability.
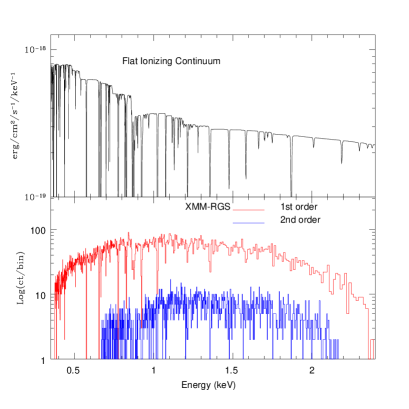
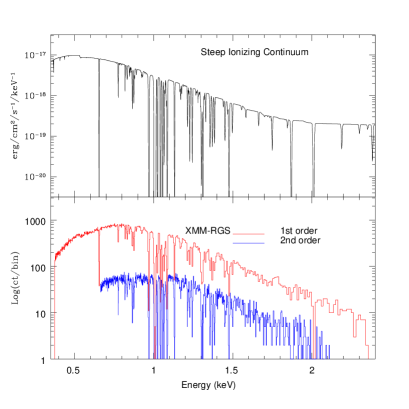
Recently, absorption–like features around 1 keV have been detected in the ASCA spectra of some NLS1 (Leighly et al. 1997; Fiore et al. 1998a; Nicastro et al. 1998b). The most obvious explanation would be in terms of neon absorption edges, but it clashes with the lack of any oxygen edge, and must be abandoned unless resorting to unusually high Ne/O abundances (Komossa & Fink 1998). Alternative explanations include blueshifted (0.2-0.3) oxygen edges (Leighly et al. 1997) or line emission from Ne and/or Fe L (Fiore et al. 1998a). In my opinion, however, the most promising explanation, and one which can be easily tested with XMM/RGS, involves resonant absorption lines (Nicastro, Fiore & Matt 1998 and this conference). This explanation answers also to the question of why these features are observed only in NLS1s. The key is in the much steeper spectrum. Flat spectra, like those typical of classical Seyfert 1s, produce an ionization structure in which, if iron is mildly ionized, oxygen is highly but not completely ionized (Fig. 3, left panel). Many absorption lines are present, but edges remains the best observable feature for moderate resolution detectors. For typical NLS1 spectra (i.e. very steep in soft X–rays, flatter above 1–2 keV), on the contrary, when iron is mildly ionized oxygen is almost completely stripped: absorption edges are no longer important, and the main absorption feature is the iron L forest (Fig. 3, right panel) which, when convolved with the ASCA/SIS response matrix, may be observable as a broad absorption feature around 1 keV (Nicastro, Fiore & Matt 1998). In the lower panels of Fig. 3 simulations with both the first and second order XMM/RGS are shown: the resonant absorption model will be thoroughly tested by XMM.
2.2 Searching for the torus in Seyfert 1s
In recent years, it has became evident that some intrinsic differences between the average properties of Seyfert 1s and 2s do exist, contrary to the strict version of unification models: enhanced star formation in Seyfert 2 galaxies (Maiolino et al. 1997); different morphologies between galaxies hosting type 1 and 2 nuclei, those hosting type 2 being on average more irregular (Maiolino et al. 1997, Malkan et al. 1998); a greater dust content in Seyfert 2s (Malkan et al. 1998). X–ray observations of optically selected samples have demonstrated that the nuclei of Seyfert 2 galaxies are usually strong X–ray emitter (e.g. Maiolino et al. 1998), which implies that the differences most likely are in the environment rather than in the nucleus.

A possible modification of the unification model may be as illustrated in Fig. 4 (see also Matt 1998). In this scenario, typical Seyfert 1s would not possess a (Compton–thick) torus, even if some objects with the torus are expected. To test the model, it is then important to search for torii in Seyfert 1s. When the torus (as any neutral matter) is illuminated by X–rays, the reprocessing of photons gives rise to the iron fluorescent line at 6.4 keV and the Compton reflection continuum (e.g. Lightman & White 1988; George & Fabian 1991; Matt, Perola & Piro 1991; Ghisellini, Haardt & Matt 1994). The problem is that the inner accretion disc produces similar features. Torus and disc reprocessing may be distinguished in two ways:
-
•
By searching for delayed variability in the reprocessing component. While any contribution from the disc should respond almost simultaneously to the primary flux (say, within a day or so), the reprocessing from the torus should vary on time scales of months or even years. A monitoring campaign would then be required. Of course, the most dramatic the variation in the primary flux, the easier the detection of any delayed reprocessing component. The ideal case would be the switching off of the central engine. This actually occurred in NGC 4051 (Guainazzi et al. 1998a), which has been observed by BeppoSAX on May 1998. Fig. 5 shows the observed spectrum (right panel), and the comparison of the best fit model with the 1994 ASCA observation (right panel). In the BeppoSAX observation the nucleus is completely invisible, and the spectrum is well fitted by a pure reflection component. This is probably the best evidence for substantial amount of circumnuclear cold matter in a Seyfert 1 galaxy.


Figure 5: Left panel: May 1998 BeppoSAX spectrum of NGC 4051. Right panel: bets fit model, compared with the 1994 ASCA one. From Guainazzi et al. (1998a) -
•
As the NGC 4051 behaviour has been unique so far, one has to consider also the other method to distinguish between disc and torus reprocessing: the profile of the iron line. Lines from the inner accretion discs are significantly broadened and skewed by relativistic effects (Fabian et al. 1989; Matt et al. 1992), while those from the torus should be narrow. While in many sources the presence of a broad line is out of question (Tanaka et al. 1995; Nandra et al. 1997; Fabian, this conference), the presence of a further narrow component is not so well established. Nandra et al. (1997) found that a contribution to the line from the torus is usually not required but also not ruled out by the data. Guainazzi et al. (1998b) found an upper limit of 40 eV to any narrow contribution in the BeppoSAX data on MCG–6-30-15, somewhat lower than expected from the torus (Ghisellini, Haardt & Matt 1994). Of course, to search for narrow line components high energy resolution, high sensitivity detectors are needed. Even if ASTRO-E seems to provide the best compromise between resolution and effective area at the iron line energy, the large sensitivity of XMM/EPIC coupled with its moderate energy resolution will be valuable in this respect.
3 Seyfert 2 galaxies
X–ray spectroscopy has already played a vital role in the study of Seyfert 2 galaxies, and promises to be very fruitful also in the future. This is particularly true for the subclass of Compton–thick Seyfert 2s, i.e. sources for which the column density of the line of sight absorber (from now on identified with the torus) is so large ( cm-2) to be optically thick to Compton scattering. In this case, the nucleus is completely obscured in soft and medium X–rays (and, if N cm-2, even in hard X–rays), and in particular at the iron line energy. This permits to study components which would otherwise be diluted to invisibility by the nuclear radiation.
The best studied case so far is NGC 1068. The X–ray spectrum is rather complex (Marshall et al. 1993; Ueno et al. 1994, Iwasawa et al. 1997; Matt et al. 1997; Guainazzi et al. 1999). Below 4 keV, a thermal–like component, probably associated with the extended starburst emission observed by ROSAT/HRI (Wilson et al. 1992), dominates. A prominent soft X–ray emission is often found in Seyfert 2s; it is generally not clear whether this emission is associated with starburst emission or is due to scattering of the nuclear radiation from warm, photoionized matter. Soft X–ray spectroscopy like that provided by XMM/RGS will be valuable in this respect, as the line spectrum in the two cases should be quite different.
Above 4 keV, the spectrum of NGC 1068 is dominated by two components, both of them due to reflection of the nuclear radiation by circumnuclear matter. The first is due to reflection from cold matter, and is characterized by a Compton reflection continuum plus an intense iron fluorescent line at 6.4 keV. The second is due to reflection from ionized matter, and is characterized by a power law continuum (just mirroring the primary continuum) and by several lines, most notably the He– and H–like iron recombination/resonant scattering lines. From the lines, information on the physical and geometrical properties of the reflectors can be derived (e.g. Matt, Brandt & Fabian 1996). A 30 ksec EPIC/PN simulation of the BeppoSAX best fit spectrum of NGC 1068 is shown in Fig 6 (left panel, while the blow–up on the iron line complex is shown in the right panel) to illustrate the quality of the spectrum which can be obtained with XMM.


4 Faint AGNs
ASCA (Ueda et al. 1998; Akiyama et al., this conference) and BeppoSAX (Fiore et al. 1998b, and this conference) have started resolving the hard (i.e above 2 keV) X–ray Background (XRB) in discrete sources, many of them turning out to be AGNs. According to popular synthesis models of the XRB (e.g. Comastri et al. 1995 and references therein), most of the AGNs which produce the XRB should be absorbed, i.e. type 2 objects. The fraction of absorbed AGN and their NH distribution down to very low fluxes can be studied by XMM/EPIC thanks to its unprecedented sensitivity. In Fig. 7 simulations of a Compton–thin (N cm-2; left panel) and a Compton–thick (right panel) sources are shown. In both cases, the observed flux is set to 6 erg cm-2 s-1, i.e. the flux limit of the deepest hard X–ray survey so far, i.e. the BeppoSAX HELLAS survey (Fiore et al. 1998b and this conference). The two kind of sources are easily distinguishable each other, and the column density, in the first case, is recovered with a 50% precision. It is worth noting that, in the Compton–thick case, the iron line energy is recovered with an error of only 0.1 keV, and therefore the redshift may be determined with great accuracy. No optical follow–ups will be needed, neither for the identification nor for the distance!


Acknowledgements
I thank all my collaborators, and in particular Fabrizio Nicastro, for fruitful discussions.
References
- (1) Antonucci R., 1993, ARA&A 31, 473
- (2) Boller T., Brandt W.N., Fink H.H., 1996, A&A, 305, 53
- (3) Brandt W.N., 1998, Proc. of the workshop “High Energy Processes in Accreting Black holes”, in press
- (4) Comastri A., Setti G., Zamorani G., Hasinger G., 1995, A&A, 296, 1
- (5) Fabian A.C., George I.M., Miyoshi S., Rees M.J., 1990, MNRAS, 242, 14P
- (6) Fabian A.C., et al., 1994, PASJ, 46, L59
- (7) Fabian A.C., 1996, in Röntgenstrahlung in the Universe”, MPE Report 263, p. 403
- (8) Fiore F., et al., 1998a, MNRAS, 298, 103
- (9) Fiore F., et al., 1998b, submitted
- (10) George I.M., Fabian A.C. 1991, MNRAS, 249, 352
- (11) George I.M., et al., 1998, ApJS, 114, 73
- (12) Ghisellini G., Haardt F., Matt G., 1994, MNRAS, 267, 743
- (13) Guainazzi M., et al., 1998a, MNRAS, in press
- (14) Guainazzi M., et al., 1998b, A&A, submitted
- (15) Guainazzi M., et al., 1999, A&A, to be submitted
- (16) Halpern J.P., 1984, ApJ, 281, 90
- (17) Iwasawa K., Fabian A.C., Matt G., 1997, MNRAS, 289, 443
- (18) Komossa S., Fink H.H., preprint (astro-ph/9808205)
- (19) Krolik J.H, Kriss G.A., 1995, ApJ, 447, 512 (erratum in 1996, ApJ, 456, 909)
- (20) Leighly K.M., Mushotzky R.F., Nandra K., Forster K., 1997, ApJ, 489, L25
- (21) Lightman A.P., White T.R., 1988, ApJ, 335, 57
- (22) Maiolino R., Ruiz M., Rieke G.H., Papadopoulos P., 1997, ApJ, 485, 552
- (23) Maiolino R., et al., 1998, A&A, 338, 781
- (24) Malkan M.A., Gorjian V., Tam R., 1998, ApJS, 117, 25
- (25) Marshall F.E., et al., 1993, ApJ, 405, 168
- (26) Matt G., Perola G.C., Piro L., 1991, A&A, 247, 25
- (27) Matt G., Perola G.C., Piro L., Stella L., 1992, A&A, 257, 63
- (28) Matt G., 1994, MNRAS, 267, L17
- (29) Matt G., Brandt W.N., Fabian A.C., 1996, MNRAS 280, 823
- (30) Matt G., et al., 1997, A&A, 325, L13
- (31) Matt G., 1998, Proc. of the workshop “High Energy Processes in Accreting Black holes”, in press
- (32) Mushotzky R. F., Done C., Pounds K. A., 1993, ARA&A 31, 717
- (33) Nandra K., Pounds K.A., 1992, Nature, 359, 215
- (34) Nandra K., George I. M., Mushotzky R. F., Turner T. J., Yaqoob T., 1997, ApJ, 477, 602
- (35) Netzer H., 1993, ApJ, 411, 594
- (36) Netzer H., 1996, ApJ, 473, 781
- (37) Nicastro F., et al., 1998a, ApJ, in press
- (38) Nicastro F., Fiore F., Brandt W., Reynolds C., 1998b, “The Active X–ray sky”, p. 501
- (39) Nicastro F., Fiore F., Matt G., 1998, ApJ, submitted
- (40) Orr A., et al., 1997, A&A, 324, L77
- (41) Otani C., et al., 1996, PASJ, 48, 211
- (42) Porquet D., Dumont A.-M., Collin S., Mouchet M., 1998, A&A, in press
- (43) Reynolds C.S., Fabian A.C., 1995, MNRAS, 273, 1167
- (44) Reynolds C.S., 1997, MNRAS, 286, 513
- (45) Svensson R., 1996, A&AS, 120, 475
- (46) Tanaka Y., et al., 1995, Nature, 375, 659
- (47) Ueda Y., et al., 1998, Nature, 391, 866
- (48) Ueno S., et al., 1994, PASJ 46, L71
- (49) Wilson A.S., Elvis M., Lawrence A., Bland–Hawthorn J., 1992, ApJ, 391, L75