The emission-line spectrum of KUG 1031+398 and the Intermediate Line Region ††thanks: Based on observations collected at the Observatoire de Haute-Provence (CNRS), France.
Abstract
We present results based on the analysis of optical spectra of KUG 1031+398, a Narrow Line Seyfert 1 (NLS1) galaxy for which Mason et al. (1996) reported evidence for a line-emitting region “intermediate” (both in terms of velocity and density) between the conventional broad and narrow line regions (BLR and NLR, respectively). From our observations and modelling of the spectra, we get a consistent decomposition of the line profiles into four components: an extended H ii region with unresolved lines, two distinct Seyfert-type clouds identified with the NLR, and a relatively narrow “broad line” component emitting only Balmer lines but no forbidden lines. Therefore, and although we find this object to be exceptional in having line-emission from the BLR with almost the same width as the narrow lines, our interpretation of the data does not support the existence of an “intermediate” line region (ILR).
Key Words.:
galaxies: active – galaxies: Seyfert – galaxies: individual: KUG 1031+3981 Introduction
1.1 The Intermediate Line Region
It is commonly accepted that line-emission in AGNs comes from two well separated regions: one, compact (smaller than 1 pc) and lying close to the central engine, has a high electron density ( 108 cm-3) and is responsible for the production of broad (FWHM thousands of km s-1) permitted lines – the BLR; the other, more extended and lying further away from the central source (10–1 000 pc), has lower electron densities (10 105 cm-3) and emits lines with a lower velocity dispersion ( hundreds of km s-1) – the NLR.
A line-emission “gap” is usually observed between the two regions, most objects showing an optical spectrum which can be fitted by line profiles corresponding to clouds belonging to one or the other line-emitting regions. This line-emission gap can be explained by the presence of dust mixed with the gas (Netzer & Laor 1993). Nevertheless, the existence of an intermediate region, both in terms of velocity and density, is expected; in such a region, the [O iii] lines would be partially collisionaly de-excited111If we make the assumptions that the excitation conditions in both the NLR and the ILR are the same and that in the ILR, 5007H 1, the [O iii]5007 line is collisionaly de-excited by about a factor 10. According to the formula given by Seaton (1975), this implies a density of 1–3 106 cm-3 if the electronic temperature is in the range 1–3 104 K. and show substantially broadened wings (Shields 1978). This ILR should not be confused with the ILR found in QSOs by Brotherton et al. (1994), which is much smaller and denser, with a velocity dispersion of the order of 2 000 km s-1 and density 1010 cm-3.
Mason et al. (1996) presented high-resolution (2 Å) optical spectroscopic observations of KUG 1031+398. The model they used to fit the data revealed a line-emitting region with lines of intermediate width (FWHM 1 000 km s-1); according to Mason et al., this region would dominate the Balmer lines profile, being also a significant contributor to the [O iii]4959, 5007 lines, with a flux ratio 5007H = 1.4, suggesting an intermediate density.
Osterbrock (1978) thought that he had detected, in a few Seyfert 1 galaxies, faint wings to the [O iii] lines with essentially the same widths as the Balmer lines. Crenshaw & Peterson (1986) and van Groningen & de Bruyn (1989) have found broad wings in the [O iii] lines of a number of Seyfert 1 galaxies, implying the presence, in these objects, of an ILR with a density of a few times 106 cm-3, similar to the one reported in KUG 1031+398; however, all these objects show strong Fe ii emission, and the observed broad [O iii] components could be due to an inaccurate removal of the Fe ii blends (Boroson & Green 1992).
In summary, although the presence in Seyfert 1 galaxies of emitting clouds with density intermediate between those of the “broad” and “narrow” components is not unexpected, no uncontroversial report of the existence of such intermediate components has ever been made to the best of our knowledge. Therefore, the claims by Mason et al. (1996) that the NLS1 KUG 1031+398 shows evidence for an ILR induced us to conduct new spectroscopic observations and modelling of its emission-line features.
1.2 KUG 1031+398
2RE J1034+396 was found in the ROSAT Wide Field Camera all-sky extreme-ultraviolet survey (Pounds et al. 1993; Pye et al. 1995). It was identified by Shara et al. (1993) and Mason et al. (1995) with the compact UV-excess 15.0 mag galaxy KUG 1031+398 (Takase & Miyauchi-Isobe 1987) at = 0.042. This object has an intense soft X-ray emission with an unusually steep 2–10 keV power law of photon index 2.6 0.1 (Pounds et al. 1995) and an even steeper 0.1–2.4 keV power law with = 3.4 0.3 (Puchnarewicz et al. 1995) or = 4.4 0.1 (Rodriguez-Pascual et al. 1997).
UV spectroscopy with the Hubble Space Telescope shows the Ly profile to be complex, with a narrow (400 km s-1 FWHM) and a broad (1 600 km s-1 FWHM) component (Puchnarewicz et al. 1998). The optical continuum is not polarized (Breeveld & Puchnarewicz 1998).
The broad component of the Balmer lines is relatively narrow (FWHM 1 500 km s-1) and, consequently, this object has been classified as a NLS1 by Puchnarewicz et al. (1995). Narrow line Seyfert 1 galaxies are defined as Seyfert 1s having “broad” Balmer lines narrower than 2 000 km s-1 FWHM (Osterbrock 1987). Most NLS1s have a steep soft ( 1 keV) X-ray component and, conversely, most ultra-soft X-ray sources are associated with a NLS1 (Puchnarewicz et al. 1992; Greiner et al. 1996; Boller et al. 1996; Wang et al. 1996).
2 Observations
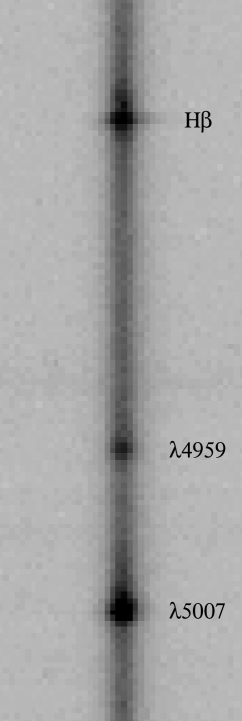
Spectroscopic observations of KUG 1031+398 were carried out with the spectrograph CARELEC (Lemaître et al. 1989) attached to the Cassegrain focus of the Observatoire de Haute Provence (OHP) 1.93 m telescope. The detector was a 512512 pixels, 2727 m Tektronix CCD. We used a 600 l mm-1 grating giving a dispersion of 66 Å mm-1. On January 10, 1997 we obtained a 20 min exposure in the range 6175–7075 Å, on March 4, a 20 min exposure in the range 4780–5780 Å, and three more on March 5.
The slit width was 21, corresponding to a projected slit width on the detector of 52 m, or 1.9 pixel. The resolution, as measured on the night sky emission lines, was 3.4 Å FWHM in the blue and 3.5 Å in the red. In both cases the galaxy nucleus was centered on the slit and 3 columns of the CCD ( 32) were extracted, corresponding to 4 kpc at the distance of the galaxy (with = 50 km s-1 Mpc-1).
The spectra were flux calibrated using the standard stars EG 247 (Oke 1974) and Feige 66 (Massey et al. 1988), observed with the same instrumental settings; these standards were also used to correct the red spectrum for the atmospheric B band at 6867 Å (Fig. 1b).

3 Analysis
3.1 Methodology
Positive correlations between line-widths and ionization potentials/critical densities have been observed in the narrow line region of many Seyfert galaxies. Negative correlations are also sometimes found. A positive correlation implies that the density and/or ionization parameter gradually increases inward in the NLR of these objects. In the case of correlations with critical densities, the observed values range from 103 to 3 106 cm-3 (Filippenko & Sargent 1985).
Sub-structures were found in the narrow line profiles of most objects suggesting that the line emitting region is a collection of individual clouds in motion relative to each other and producing different parts of the line profiles (see for instance Veilleux 1991, Espey et al. 1994 or Ferguson et al. 1997).
These findings induced us to assume that each of these clouds is characterized by a single density and that lines coming from the same emission-region should have the same profile and mean velocity. We therefore tried to model the spectra of KUG 1031+398 with the smallest possible number of line sets, each set including three Gaussians (modelling H and the [N ii]6548, 6583 lines, or H and the [O iii]4959, 5007 lines) having the same velocity shift and width, with the additional constraint that the intensity ratio of the two [N ii] (respectively [O iii]) lines was taken to be equal to the theoretical value of 3.00 (respectively 2.96) (Osterbrock 1974). In a physically meaningful and self-consistent model, the components found when fitting the blue and red spectra should have velocity shifts and widths compatible within the measurement errors.
3.2 The narrow line-core components
The spectra were deredshifted assuming = 0.0434 (Fig. 1a and b) and analysed in terms of Gaussian components as described above. We discovered first that the core of the lines could not be fitted by a single set of narrow Gaussian profiles. To get a satisfactory fit, two sets of Gaussian components are needed: the first, unresolved (and subsequently taken as the origin of the velocity scales) has 6583H = 0.55 and 5007H = 1.27 and corresponds to a H ii region (Fig. 2); the second is resolved (FWHM 350 km s-1, corrected for the instrumental broadening), blueshifted by 95 km s-1 with respect to the narrower components and has line intensity ratios typical of a Seyfert 2 (6583H = 0.84, 5007H = 10.2).
3.3 The “broad” components
At this stage, we removed from the blue and red spectra the best fitting line-core (the H ii region and the Seyfert 2 nebulosity, Fig. 1c and d), obtaining two spectra we shall call “original data minus core”. The blue one was then fitted with a broad H Gaussian component and two sets of three components modelling the narrow H and [O iii]4959, 5007 lines. The result is very suggestive: one set has a strong H line and very weak negative [O iii] components, while the other set displays a strong [O iii] contribution and a weak negative H component, showing that we have in fact a H component with no associated [O iii] emission and [O iii] lines with a very weak (undetected) associated H; in other words, the region producing the H line does not emit forbidden lines, while the [O iii] emitting region has a high 5007H ratio, which are, respectively, the characteristics of the “broad” and “narrow” line regions in Seyfert 1 galaxies.
Having these results in mind, we optimized this last fit by using a Lorentzian profile for the H line, with no associated [O iii] emission, and a set of three Gaussians for the remaining contribution coming from the “narrow” components (this is not the first time Lorentzian profiles are used to fit AGN emission lines; for example Stüwe et al. (1992) found that, in the case of NGC 4258, the narrow lines were better fitted by Lorentzians, rather than Gaussians).
The best fit is presented in Fig. 1e: in this model, the flux of the “narrow” (Gaussian) H component is only 9% of the “broad” (Lorentzian) H component. The H Lorentzian component is blueshifted by 150 km s-1 with a width of 915 km s-1. The Gaussian components are blueshifted by 395 km s-1 and their width is 1 115 km s-111footnotemark: 1. Mason et al. found a FWHM = 1 030 150 km s-1 for this component which is blueshifted by 240 30 km s-1. This blueshift, however, is measured with respect to the [O iii] lines core which is dominated by the Seyfert 2 cloud, itself blueshifted by 95 km s-1 with respect to the H ii region; the blueshift of Mason et al.’s intermediate component is, therefore, 240 + 95 = 335 km s-1, in agreement with our value of 395 km s-1.
In Seyfert 1 galaxies, the Balmer decrement of the broad component is never smaller than that of the narrow component; in the present case, we therefore expect the “narrow” H component flux to be less than 9% of the “broad” H component flux. Moreover, the [N ii]6583 line flux is, in Seyfert galaxies, equal or smaller than the narrow H component flux. So, in KUG 1031+398, we expect the narrow lines to be quite weak compared to the “broad” H component, and we fitted the “original data minus core” red spectrum with a single Lorentzian profile of 1 205 km s-1 FWHM, blueshifted by 65 km s-1 with respect to the H ii region. This fit is shown in Fig. 1f.
Another model allowing, in addition, for a set of H and [N ii] Gaussian components was also tested, resulting in a fit of similar quality; the very small 6583H ratio observed for this solution (0.2), shows that the nitrogen lines may be considered as undetectable.
4 Results and Discussion
Our new observations and modelling of KUG 1031+398 yield a consistent decomposition of the emission-line profile into four components (see Table 1):
-
1.
An extended H ii region with unresolved lines (Fig. 2);
-
2.
A first Seyfert-type cloud with relatively narrow lines ( 350 km s-1 FWHM), blueshifted by 95 km s-1, belonging to the NLR;
-
3.
A second Seyfert-type component with somewhat broader lines, blueshifted by 395 km s-1; the width of the lines in this component ( 1 115 km s-1 FWHM), which may seem large for a Seyfert 2, is not exceptional as the FWHM of the lines in the prototype Seyfert 2 galaxy NGC 1068 is 1 670 km s-1 (Alloin et al. 1983). Only the [O iii] lines are observed in this component, with 5007H 6.1, a line ratio characteristic of NLRs;
-
4.
Finally, a Narrow Line Seyfert 1 cloud with lines well fitted by a Lorentzian profile of 1 060 km s-1 FWHM, blueshifted by 105 km s-1.
Our analysis shows that the emission line spectrum of KUG 1031+398 can be satisfactorily decomposed in a set of components which have line ratios characteristics of H ii regions or conventional NLR or BLR clouds, whithout the need to invoke the presence of an ILR characterized by 5007H 1.
There are two main reasons why our analysis yields different results from those published by Mason et al. (1996). First, KUG 1031+398 having a redshift of 0.043, the [N ii] 6583 line coincides with the atmospheric B band. When correcting for this absorption feature, the [N ii] true intensity is recovered (Fig. 1b) and our red spectrum appears different from the published one; different line-ratios and widths are therefore not unexpected.
Second, the line-profile analysis of Mason et al. differs from ours in that, while we force each Balmer component to be associated with forbidden lines having the same velocity and width, Mason et al. allow these parameters to have different values for the Balmer and forbidden line components. As a result, they found three H components (a narrow, an intermediate and a broad one), as well as two [O iii] components (a narrow and an intermediate one); they also detected three H components (again a narrow, an intermediate and a broad one), but only a single [N ii] component (narrow). The measured width of the narrow H component is 150 20 km s-1 FWHM, while the width of the narrow [O iii] lines is 265 10 km s-1; this last value, significantly larger than the narrow H line width, suggests that the [O iii] lines may have a complex profile. Moreover, the width of the [N ii] lines is found to be significantly larger (400 60 km s-1) than that of the narrow H component (190 40 km s-1); this could be due to an inaccurate correction of the atmospheric B band, as we have seen above.
Although our spectra have a lower resolution than those obtained by Mason et al. (3.4 Å compared to 2 Å FWHM), this does not affect the analysis; the narrow core components being identified and subtracted, all the discussion is centered on the broader components, well resolved even with our lower resolution. Similarly, the larger slit width used in our observations (21 compared to 15 for Mason et al.) does not affect the study of these broader components, since only the contribution from the extended emitting region (the H ii region, Fig. 2), removed with the core, changes with the slit width.
Boller et al. (1996) and Wang et al. (1996) have suggested that the small width of the broad Balmer lines and the soft X-ray excess characteristic of NLS1 galaxies could be the effect of a high accretion rate on an abnormally small mass black hole. Mason et al. (1996) have argued that, although the emission line spectrum in KUG 1031+398 is dominated by the ILR, a weak broad component is present with line-widths of the order of 2 500 km s-1 FWHM and that, therefore, at least in this object, such a model is not required.
Our analysis of the spectra of KUG 1031+398 has shown that, in the BLR, the Balmer lines are well fitted by a Lorentzian profile with 1 060 km s-1 FWHM; this value is much narrower than the value found by Mason et al. ( 2 500 km s-1). This is due to the fact that we used a Lorentzian, rather than a Gaussian profile to fit the broad Balmer lines; the Lorentzian profile was required by the presence of broad wings, fitted with a Gaussian by Mason et al. (1996).
We have shown (Gonçalves et al. in preparation) that in NLS1s the broad component of the Balmer lines is generally better fitted by a Lorentzian than by a Gaussian; the Lorentzian Balmer lines (component 4), without any measurable associated forbidden line, would qualify this object as a NLS1 with, in fact, very narrow lines. So, in this respect, KUG 1031+398 is a normal NLS1 and could be explained by the same small black hole mass model as the other objects of this class.
V |
FWHM | 5007 | 6583 | I(H) | I(H) | |
|---|---|---|---|---|---|---|
| (km s-1) | (km s-1) | H |
H | |||
| 1 | 0 |
80 |
1.27 | 0.55 | 29 | 93 |
| 2 |
95 |
350 |
10.2 |
0.84 | 8 | 81 |
| 3 |
395 |
1115 |
6.1 |
– | 18 | – |
| 4 |
105 |
1060 |
– |
– | 189 | 938 |
5 Conclusions
We have obtained new spectra of KUG 1031+398 around H and H. We have found that the emission-line spectrum of this object can be modelled with four components: an extended H ii region, two narrow emission regions of Seyfert 2-type and a relatively narrow “broad line” component, well fitted by a Lorentzian profile.
We disagree with Mason et al. on the analysis of the emission line profile of KUG 1031+398, in the sense that we find no evidence for the presence of an “intermediate” component in which the forbidden lines are almost, but not completely, suppressed by collisional de-excitation. Nevertheless, we find that this object is exceptional in having a “narrow” line region (defined as a region where 5007H 5) with almost the same width at half maximum as the “broad” line region (Balmer lines with no detectable associated forbidden lines); however, in the first case, the line-profile is Gaussian, while in the second case, it is Lorentzian.
Acknowledgements.
We would like to thank A. Rodriguez-Ardila and G. Shields for useful comments and suggestions. A. C. Gonçalves acknowledges support from the Fundação para a Ciência e a Tecnologia, Portugal, during the course of this work (PRAXIS XXI/BD/5117 /95 PhD. grant).References
- (1) Alloin D., Pellat D., Boksenberg A., Sargent W. L. W., 1983, ApJ 275, 493
- (2) Boller T., Brandt W. N., Fink H., 1996, A&A 305, 53
- (3) Boroson T. A., Green R. F., 1992, ApJS 80, 109
- (4) Breeveld A. A., Puchnarewicz E. M., 1998, MNRAS 295, 568
- (5) Brotherton M. S., Wills B. J., Francis P. J., Steidel C. J., 1994, ApJ 430, 495
- (6) Crenshaw D. M., Peterson B. M., 1986, PASP 98, 185
- (7) Espey B. R., Turnshek D. A., Lee L. et al., 1994, ApJ 434, 484
- (8) Ferguson J. W., Korista K. T., Baldwin J. A., Ferland G. J., 1997, ApJ 487, 122
- (9) Filippenko A. V., Sargent W. L. W., 1985, ApJS 57, 503
- (10) Greiner J., Danner R., Bade N. et al., 1996, A&A 310, 384
- (11) Lemaître G., Kohler D., Lacroix D., Meunier J.-P., Vin A., 1989, A&A 228, 546
- (12) Mason K. O., Hassall B. J. M., Bromage G. E. et al., 1995, MNRAS 274, 1194
- (13) Mason K. O., Puchnarewicz E. M., Jones L. R., 1996, MNRAS 283, L26
- (14) Massey P., Strobel K., Barnes J. V., Anderson E., 1988, ApJ 328, 315
- (15) Netzer H., Laor A., 1993, ApJ 404, L51
- (16) Oke J. B., 1974, ApJS 27, 21
- (17) Osterbrock D. E., 1974, Astrophysics of gaseous nebulae., Freeman and company, San Francisco
- (18) Osterbrock D. E., 1978, Physica Scripta 17, 285
- (19) Osterbrock D. E., 1987, Lecture Notes in Physics 307, 1
- (20) Pounds K. A., Allen D. J., Barber C., et al., 1993, MNRAS 260, 77
- (21) Pounds K. A., Done C., Osborne J. A., 1995, MNRAS 277, L5
- (22) Puchnarewicz E. M., Mason K. O., Cordova F. A. et al., 1992, MNRAS 256, 589
- (23) Puchnarewicz E. M., Mason K. O., Siemiginowska A., Pounds K. A., 1995, MNRAS 276, 20
- (24) Puchnarewicz E. M., Mason K. O., Siemiginowska A., 1998, MNRAS 293, L52
- (25) Pye J. P., McGale P. A., Allan D. J. et al., 1995, MNRAS 274, 1165
- (26) Rodriguez-Pascual P. M., Mas-Hesse J. M., Santos-Lléo M., 1997, A&A, 327, 72
- (27) Seaton M. J., 1975, MNRAS 170, 475
- (28) Shara M. M., Shara D. J., McLean B., 1993, PASP 105, 387
- (29) Shields G. A., 1978. In: Wolfe A.M. (ed.), Pitsburgh conference on BL Lac objects, University of Pittsburgh, Pittsburgh, Pennsylvania, p. 257
- (30) Stüwe J. A., Schulz H., Huehnermann H., 1992, A&A 261, 382
- (31) Takase B., Miyauchi-Isobe N., 1987, Ann. Tokyo astron. Obs. 2nd series 21, 363
- (32) van Groningen E., de Bruyn A. G., 1989, A&A 211, 293
- (33) Veilleux S., 1991, ApJ 369, 331
- (34) Wang T., Brinkmann W., Bergeron J., 1996, A&A 309, 81