Present address: ]SORST, Japan Science and Technology Corporation, Tokyo 113-8656, Japan.
Present address: ]Department of Chemistry, Carnegie Mellon University, Pittsburgh, Pennsylvania 15213.
Photoinduced spin crossover in Fe-picolylamine
complex:
A farinfrared study on single crystals
Abstract
Farinfrared spectroscopy has been performed on [Fe(2-picolylamine)3]Cl2EtOH (Fe-pic) single crystals, to probe changes in the molecular vibrations upon the photoinduced and temperature-induced spin crossovers. Synchrotron radiation has been used as the farinfrared source to overcome the strong absorption and the small sizes of the samples. Absorption lines due to FeN6 cluster vibrations, observed below 400 cm-1, show strong intensity variations upon the crossover due to the deformation of FeN6 between high-spin and low-spin states. However, they remain almost unchanged between the photo- and temperature-induced high-spin states. This is in sharp contrast to the lines at 500-700 cm-1 due to intramolecular vibrations of the picolylamine ligands, which show marked variations between the two high-spin states. It is concluded that the most important microscopic difference between the two high-spin states arises from the ligands, which is likely to reflect different states of intermolecular bonding between them.
pacs:
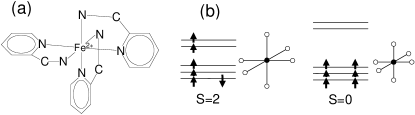
75.30.Wx, 78.30.-j[Fe(2-pic)3]Cl2EtOH (2-pic: 2-picolylamine or 2-aminomethyl pyridine, EtOH: ethanol), referred to as the Fe-pic, is one of the Fe(II)-based complexes which have recently attracted much interest for exhibiting a photoinduced spin crossover.time ; koshihara ; SC-review As sketched in Fig. 1(a), an Fe2+ ion in Fe-pic is located in a nearly octahedral crystal field created by the three 2-pic ligands. Depending on the magnitude of the crystal field splitting, Fe2+ takes either total spin =2 (high spin) or =0 (low spin), as sketched in Fig.1 (b). Well above 118 K, Fe-pic is in the high-spin state (high-temperature high-spin state, HTHS). Upon cooling through , Fe-pic undergoes a crossover to the low-spin state (low-temperature low-spin state, LTLS). The width of the crossover is about 20 K, as observed in the high-spin fraction, . The crossover is associated with a 8 % change in the average Fe-N distance. The resulting electron-lattice coupling leads to cooperative interaction among the Fe2+ ions,SC-review as discussed later. In LTLS, a photoexcitation can cause a crossover to a high-spin state. Below 40 K, this photoinduced high-spin state (PIHS) persists even after the excitation is turned off. The half life in reaches 160 min at 10 K.time The development of PIHS involves highly nonlinear responses to the photoexcitation, such as an incubation time, a threshold intensity, a step-like change of with time, and a domain formation.koshihara These results led to the suggestion that the development of PIHS in Fe-pic should be a transition to a novel macroscopic phase under photoexcitation, referred to as the “photoinduced phase transition”.koshihara
To examine this suggestion, it is important to compare the microscopic nature of PIHS with that of HTHS, and to characterize the cooperative interaction among Fe2+ ions under photoexcitation. It was foundtaya-PRL ; taya-PRB ; okamura that the Raman-infrared selection rules in Fe-pic were modified between HTHS and PIHS, which suggested a photoinduced symmetry lowering in PIHS. In contrast, detailed X-ray diffraction (XRD) study of Fe-pichuby found no significant difference in the average crystal structure between HTHS and PIHS. In addition, X-ray absorption fine structure (XAFS) of Fe-pic showed that the local coordinations of the neighboring ions around Fe2+ were very similar between HTHS and PIHS.oyanagi Recently, a nuclear resonant inelastic scattering (NRIS) experiment was reported on 57Fe-enriched Fe-pic.juhasz This technique was able to selectively probe the partial vibrational density of states for 57Fe. The obtained NRIS spectra were very similar between PIHS and HTHS, showing that the atomic vibration state of Fe2+ was also similar.
In this work, we have measured the farinfrared (FIR) absorption spectra of Fe-pic single crystals in the 80-700 cm-1 range. Unlike the previous midinfrared work,okamura this range can cover the normal-mode vibrations of the FeN6 cluster. To analyze the observed data, the frequencies of molecular vibrations are calculated for [Fe(2-pic)3]2+ using density-functional method. Many of the observed absorption lines below 400 cm-1 are attributed to the FeN6 cluster vibrations, which exhibit characteristic intensity changes upon the photo- and temperature-induced spin crossovers. However, they are almost unchanged between HTHS and PIHS. It is concluded that the microscopic vibrational states of the FeN6 cluster is nearly unchanged between PIHS and HTHS, and that the deformation of 2-pic ligand should play an important role in the development of PIHS.
The single crystals of Fe-pic used in this work were grown by the evaporation method. Plate-shaped samples of approximately 0.7 0.7 0.1 mm3 were obtained by cleaving the crystals, and mounted on a continuous-flow liquid He cryostat. The FIR absorption experiment was done using a synchrotron radiation (SR) source and a custom-made microscope at the beam line BL43IR, SPring-8.micro The SR source can deliver much higher photon flux density to the sample than the usual FIR sources. Since the Fe-pic single crystals had small sizes and strong FIR absorption, the use of SR was crucial to successfully perform this experiment. A black polyethylene filter was used to cut the visible component of the SR. Photo-excitation of the sample was made using white light from a tungsten lamp. A Si bolometer was used as a detector, and a Fourier-transform interferometer was used to record the spectra. The spectral resolution was set to 4 cm-1.
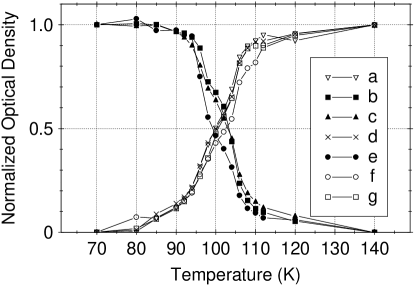
Figure 2(a) shows the FIR absorption spectra of Fe-pic without photoexcitation at several temperatures across . Here, the absorption is expressed as the optical density (OD), , where and are the transmission spectra with and without the sample, respectively. The detection limit for the weak transmission was about OD=2.8 with an accumulation time of 2 min, and Fig. 2 shows the spectra below OD=2.8 only. The lines above 450 cm-1 agree well with those previously observed, which result from the intramolecular vibrations of the 2-pic ligand and ethanol.okamura In contrast, many of the lines below 450 cm-1 are attributed to vibration modes of the FeN6 cluster, as discussed later. The absorption lines show quite strong intensity variations through . The detailed temperature dependence of several bands and lines, indicated by the labels in Fig. 2, are displayed in Fig. 3. It is seen that the variation of the absorption strength occurs over a width of about 20 K,footnote4 which agrees well with that of .okamura Namely, the absorption strength closely reflects the evolution of electronic configuration at Fe2+ and the associated deformation in the Fe-pic molecule upon the crossover.
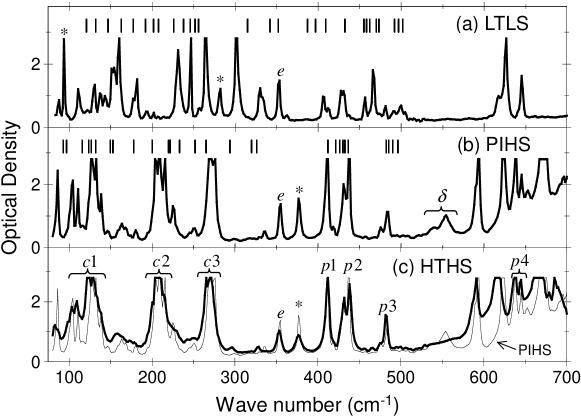
Figures 4(a)-(c) present the absorption spectra of Fe-pic in LTLS at 9 K, in PIHS at 9 K, and in HTHS at 140 K, respectively.footnote3 Here, spectrum (a) was first recorded, then the sample was photoexcited with a 2 mW/mm2 power density of white light for 5 min. After turning off the excitation, spectrum (b) was measured, then the sample was warmed up and spectrum (c) was recorded. The spectra above 450 cm-1 agree well with those reported previously:okamura The double lines at 530-570 cm-1, marked by the label , are observed in PIHS, but not in LTLS and HTHS.taya-PRL ; okamura In addition, the lines in 570-700 cm-1 range show marked differences between PIHS and HTHS, except for the line which is due to C-H deformation within the 2-pic ligand.okamura These lines have been attributed to skeletal vibrations of the aminomethyl group (NHCH2) in the 2-pic ligand.okamura Hence the variations of these lines were regarded as evidence for microscopic deformations in the 2-pic ligand between HTHS and PIHS.
To analyze the data below 450 cm-1, we have calculated the frequencies of infrared-active molecular vibrations for an isolated [Fe(2-pic), using the density-functional method. The calculation was made using the Gaussian ’03 program,gaussian the details of which were similar to those previously reported.juhasz The parameters involved in the calculation were first optimized so as to reproduce the reported molecular structure of [Fe(2-pic), then they were used to calculate the infrared frequencies. The calculated vibration frequencies are displayed by the vertical bars in Figs. 4(a) and (b). It is seen that most of the observed lines have their frequencies close to the calculated ones. (Note that line should be due to ethanol, since it is hardly affected by the crossover.) The lines marked by the asterisks are located far apart from the calculated frequencies. This deviation should be related with the strong hydrogen bonding between the amine group (-NH-) of 2-pic and Cl-,mikami which was neglected in the calculation. The calculated lines below 300 cm-1 in the high-spin states and those below 400 cm-1 in LTLS are mainly derived from the FeN6 vibration modes. Hence the observed lines in these frequency ranges are also attributed to FeN6-based vibrations (except for line ). The lines - are attributed to intramolecular vibrations of 2-pic ligand, as in the previous Raman work.taya-PRL ; taya-PRB
In Fig. 4, the spectra below 300 cm-1 in PIHS and HTHS [(b) and (c)] are very similar to each other. They mainly consist of three strong bands, which are labeled as 1-3 in Fig. 4(c). The spectral similarity demonstrates that the microscopic vibrational states of the FeN6 cluster are also similar between PIHS and HTHS. In contrast, the spectrum in LTLS, Fig. 4(a), appears quite different from those of the high-spin states. The bands 1-3 are no longer observed in LTLS. Instead, a larger number of narrower lines are observed, which implies a symmetry lowering of FeN6 in LTLS. The spectral differences should be due to the deformation of FeN6 and due to changes in the force constants of Fe-N bonds. The occupation of orbitals by 6 electrons in LTLS, as sketched in Fig. 1(b), results in not only the shorter Fe-N distances, but also stronger Fe-N bonds.SC-review Note that the symmetry of the FeN6 in the average crystal structure is nearly the same between the high- and low-spin states.mikami ; huby Hence, the changes in the force constants seem to have lowered the symmetry of FeN6 cluster mechanically (not geometrically), resulting in the appearance of a larger number of narrower lines in LTLS.
The present data have demonstrated that the microscopic vibrational states of FeN6 are very similar between PIHS and HTHS. This is consistent with the previous results of XRD,huby XAFSoyanagi and NRIS,juhasz all of which gave very similar data between PIHS and HTHS. Compared with the previous works, however, it is very important that the present work has explicitly and directly shown the microscopic similarity with a high spectral resolution. In contrast, as already mentioned, the absorption spectrum at 530-700 cm-1 range has shown clear differences between PIHS and HTHS, due to skeletal deformation of the 2-pic ligand.taya-PRB ; okamura Considering these results, therefore, the most important microscopic difference between the PIHS and HTHS of Fe-pic should be the deformation of 2-pic ligands. Note that this deformation does not have a long-range order, since the XRD datahuby show no appreciable deformation of 2-pic in the average crystal structure.
The unusual properties of PIHS, mentioned in the introduction, apparently result from a cooperative interaction (cooperativity) among Fe2+ ions. However, a cooperativity is very important also in the thermal spin crossover between HTHS and LTLS.SC-review This was experimentally demonstrated on the diluted system (Fe, Zn)-pic, where the spin crossover became much broader at low Fe fractions, approaching to that given by the Boltzmann distribution over isolated molecules.dilution An important source of cooperativity is the long-range elastic interaction, caused by the deformation of FeN6 upon the crossover.SC-review ; dilution ; elastic In this mechanism, an increase in the density of high-spin Fe2+ effectively increases the interaction (or equivalently lowers the energy difference between low- and high-spin statesogawa ), accelerating the crossover compared with the isolated case.dilution ; ogawa A theory based on the elastic interaction has also successfully reproduced two key properties of PIHS under photoexcitation,ogawa i.e., the presence of incubation period and the threshold excitation intensity.koshihara
In the above models, however, the microscopic properties involved in the interaction are not taken into account. In addition, short-range interaction among Fe2+ ions is neglected. It has been pointed out that the step-like change of and the phase separation in PIHS cannot be understood without the short-range interaction.ogawa It is therefore important to characterize the interaction among Fe2+ ions more microscopically. As mentioned before, the -NH- portion of the aminomethyl group in the 2-pic ligand is strongly hydrogen-bonded to the Cl- anion. This hydrogen bonding is also responsible for the intermolecular bonding and crystallization of Fe-pic molecules.mikami Hence, the microscopic deformation of 2-pic ligand found in the present work is quite likely to reflect different states of intermolecular bondings between HTHS and PIHS. To further characterize such bonding, it should be very useful to study the vibration modes below the frequency range of this work. The intermolecular vibration modes, which involve the vibration of the entire [Fe(2-pic)3]2+ ion, are expected to appear well below 80 cm-1. Such modes are expected to be more sensitive to changes in the intermolecular bonding than those observed in this work.
Low-frequency vibrations may be important also in terms of the vibrational entropy.entropy2 For the thermal crossover in Fe-pic, the phonon part () of the observed entropy change is as large as 56 %.entropy This acts as a strong driving force for the crossover and also increases the cooperativity.SC-review ; entropy3 The large results from the strong anharmonicity of the FeN6 vibrations: When the average lattice constants change upon the crossover, the phonon frequencies also change due to the anharmonicity. Consequently, the phonon density of states is modified, leading to the large .entropy2 ; entropy Since the photoinduced crossover is observed at much lower temperatures, high-frequency phonons are quenched, and phonons with much lower frequencies may play important roles in terms of the entropy in PIHS. It is interesting that, in Fig. 4(c), the absorption band shows significant broadening in HTHS compared in PIHS. This broadening of seems unusually larger than those of and , compared with phonons in the usual solids having similar frequencies. This might be a sign of the strong anharmonicity of the low-frequency FeN6 vibrations. Again, a further study at lower frequency range is needed to obtain more information about the role of phonon anharmonicity.
In conclusion, we have reported the first FIR absorption study of Fe-pic single crystals in its three characteristic states. The absorption lines below 400 cm-1 are mainly attributed to the FeN6 vibrations. The spectra are found very similar between PIHS and HTHS, which demonstrate that the microscopic environment at the FeN6 cluster is also similar. The most important microscopic difference between HTHS and PIHS is the deformation of the 2-pic ligand, which should have important effects on the intermolecular coupling. The present result suggests the importance of further study at lower frequencies, which should give more insight into the microscopic nature of the intermolecular interaction in PIHS.
The experiments at SPring-8 were performed under the approval of JASRI (2004A0480-NSa-np).
References
- (1) H. Romstedt, A. Hauser, and H. Spiering, J. Phys. Chem. Solids, 59, 265 (1998).
- (2) Y. Ogawa, S. Koshihara, K. Koshino, T. Ogawa, C. Urano, and H. Takagi: Phys. Rev. Lett. 84, 3181 (2000).
- (3) For a review, see for example, P. Gutlich, A. Hauser, and H. Spiering, Angew. Chem. Int. Ed. 33 2024 (1994); P. Gutlich, Y. Garcia, and H.A. Goodwin, Chem. Soc. Rev. 29, 419 (2000).
- (4) M. Mikami, M. Konno, and Y. Saito, Acta. Cryst. 36, 275 (1980).
- (5) T. Tayagaki and T. Tanaka: Phys. Rev. Lett. 86, 2886 (2001).
- (6) T. Tayagaki, K. Tanaka, and H. Okamura, Phys. Rev. B 69, 064104 (2004).
- (7) H. Okamura, M. Matsubara, T. Tayagaki, K. Tanaka, Y. Ikemoto, H. Kimura, T. Moriwaki, and T. Nanba, J. Phys. Soc. Jpn. 73, 1355 (2004).
- (8) N. Huby, L. Guerin, E. Collet, L. Toupet, J.-C. Ameline, H. Cailleau, T. Roisnel, T. Tayagaki, and K. Tanaka, Phys. Rev. B 69, 020101(R) (2004).
- (9) H. Oyanagi, T. Tayagaki, and K. Tanaka, in X-Ray and Inner-Shell Processes, ed. A. Marceli et al., AIP Conf. Proc. 652 (AIP, New York, 2003) p438.
- (10) G. Juhász, M. Seto, Y. Yoda, S. Hayami, and Y. Maeda, Chem. Commun. 2574 (2004).
- (11) Y. Ikemoto, T. Moriwaki, T. Hirono, S. Kimura, K. Shinoda, M. Matsunami, N. Nagai, T. Nanba, K. Kobayashi, and H. Kimura, Infrared Phys. Tech. 45, 369 (2004).
- (12) The curves in Fig. 3 show the mid-point of the crossover around 103 K, which is lower than . This difference is due to a low thermal contact of the sample with the cryostat, which resulted from our effort of not rigidly mounting the sample to avoid causing an internal strain. At lower temperatures, the thermal conductivity of the sample becomes much higher, and the difference between the measured and actual temperatures should be smaller. Our discussions below will not be affected by such temperature difference.
- (13) Due to technical restrictions, the data in Fig. 3 were measured on a different sample from that for the data in Fig. 2. The former was slightly thicker, resulting in the stronger absorption in Fig. 3.
- (14) M.J. Frisch, Gaussian ’03, Revision B.04 (Gaussian Inc., Pittsburgh, 2003).
- (15) H. Spiering, E. Meissner, H. Koppen, E.W. Muller, and P. Gutlich, Chem. Phys. 68, 65 (1982).
- (16) N. Willenbacher and H. Spiering, J. Phys. C Solid State Phys. 21, 1423 (1988).
- (17) K. Koshino and T. Ogawa, J. Phys. Soc. Jpn. 68, 2164 (1999).
- (18) A. Bousseksou, J.J. McGarvey, F. Varret, J.A. Real, J.-P. Tuchagues, A.C. Dennis, and M.L. Boillot, Chem. Phys. Lett. 318, 409 (2000).
- (19) K. Kaji and M. Sorai, Thermochim. Acta 15, 185 (1985).
- (20) A. Bousseksou, H. Constant-Machado, and F. Varret, J. Phys. I (France) 5, 747 (1995).