A discrete statistical mechanics approach to aeolian ripple dynamics
Abstract
The interaction between a fluid and a granular material plays a crucial role in a large class of phenomena such as landscape morphology and transport of sediments, aeolian sand dunes formation and ripples dynamics. Standard models involve deterministic continuum equations or, alternatively, Lattice Boltzmann and Lattice Gas Cellular Automata. We here introduce a toy-model to address the issue of aeolian ripple formation and evolution. Our simplified approach accounts for the basic physical mechanisms and enables to reproduce the observed phenomenology in the framework of an innovative statistical mechanics formulation.
pacs:
47.54.+rPattern selection; pattern formation 45.70.-nGranular systems 05.65.+bSelf-organized systemsI Introduction and general background
The complex interactions between a granular material and a fluid may lead to the formation of spectacular structures, like erosion patterns, dunes and ripples. We are here interested in ripple patterns that emerge due to the interactions between a fluid (air) flow and a granular material (sand). The conditions of the flow and the characteristics of the granular material give origin to a large variety of morphologies Bagnold ; Pye .


Ripples have been recently photographed even on Mars, qualitatively resembling the ones observed on the Earth surface, see Fig. 1. From a direct inspection of the peculiar shapes of such coherent structures, one could in principle aim at reconstructing the characteristics of the surrounding environment. It is therefore of paramount importance to develop dedicated models enabling to successfully address the issue of ripple formation and evolution. Phenomenologically, the correct interpretative framework is provided by the pioneering investigations by Bagnold Bagnold based on wide observational and experimental facts. In particular, the two key processes, namely saltation and surface creeping (reptation), are outlined in Ref. Bagnold .
Saltation refers to the process by which a grain is entrained by the fluid, accelerated and transported to another site. In wind flows the transition from rest to entrainment occurs as a sudden jump, when the lift force is able to dislodge a particle from its gravitational trap. Due to the large density differences between sand and air, this occurs for large shear velocities. The takeoff angle (with respect to horizontal) is large, and so is the flight time and transport. The subsequent impact with the other particles occurs at relatively high energy, and even when the restitution coefficient is small, this energy may be sufficient to dislodge other particles. These reptated particles are then transported by the fluid, but their initial velocity is generally lower than that associated to the saltating particles, thus preventing avalanche effects.
Reptated particles finally stop in a local gravitational trap, loosing energy via anelastic collisions. One of the standard assumption NO1993 is that this reptation mechanism is the main origin of the creeping flow, including what in other context would be referred as toppling.
Which one of these phenomena is more relevant, depends on the combined effects of drag and lift forces, gravity and dissipation of energy during collisions. However the main difficulty arises in modeling the interaction between the fluid and the grains. This interaction depends on the distribution of the fluid velocity, that may vary widely in space and time, on the shape of the grains and on their relative density, that gives origin to buoyancy. Moreover, the instantaneous fluid velocity field depends on the profile of the sand bed, which is modified by erosion and deposition, and on the shielding effect of saltating particles. Self-organized patterns are originated by these nontrivial interactions Andreotti ; KH2002 . Dedicated models aim at reproducing some of the most relevant aspects of these phenomena. In particular, following Ref. Bagnold , ripples are characterized by being asymmetric and their formation and persistence is determined by flux intensity. Small ripples are observed to travel faster than large ones and the temporal evolution of the maximum ripple height is limited and not linear.
In order to study the erosion/deposition process continuum models of mechanics have been proposed TB1998 ; VR1999 ; LP1999 . In addition accurate hydrodynamical descriptions have been studied by various authors KH2002 ; AV2005 ; PL2003 ; CV2000 . These alternative approaches enable to quantitavely study the process of ripple formation by incorporating a detailed representation of the fluid flow via Navier-Stokes equation, and/or facing the problem of considering the flow near the soil. However, the latter models are computationally expensive and difficult to treat analitically particularly in presence of complex and time-dependent boundaries, or when turbulence and other fluctuating aspects play an active role. However, linear stability analysis TB1998 ; VR1999 ; Andreotti enables to predict the instability regime of a flat surface and quantifies its associated growth rate.
To gain more insight into the crucial interplay between erosion and deposition, beyond the linear approximation, a series of simplified theoretical frameworks (toy models) have been developed, focusing only on those aspects supposed to be the relevant ones. Following these lines, it is customary to replace the complex fluid velocity distribution with a limited number of aggregated data, like the average shear velocity and the associated fluctuations.
Simple models of sand ripples dynamics were first introduced by Anderson RA1987 ; RA1990 for grain segregation and stratigraphy. A discrete stochastic model was further proposed about a decade ago by Werner and Gillespie WG1993 . Another minimal model, widely adopted in the relevant literature, was proposed the same year by Nishimori and Ouchi NO1993 . The latter, termed NO, qualitatively captures some of the peculiar features of ripple evolution. Within this scenario, the saltation and reptation are accounted for and shown to produce the spontaneous formation of a characteristic ripple patterns. Though it represents a significant step forward in the comprehension of the basic mechanism underlying the phenomenon, the NO model allows for non realistic structures of infinite heights, since in this model there is no explicit or implicit mechanism that leads to the appearance of a critical angle of repose. Recently, Caps and Vandewalle Caps modified the preexisting scheme by including explicitly the effect of avalanches (SCA model: Saltation Creep and Avalanches). This modification results in asymmetric ripple profiles and induces a saturation for the maximal height.
Cellular automata modeling of sand transportation was introduced by Anderson and Bunnan AB1993 and by Werner and Gillespie WG1993 . In these models, the driving mechanism for sand transport is the saltation/reptation dynamics, eventually complemented by toppling, that corresponds to diffusion in a continuous model. Masselot and Chopard chopard also introduced a cellular automata for snow and sand transportation. They explicitly modeled the fluid flow by means of lattice Boltzmann methods, while the granular phase is represented as a probabilistic cellular automaton. The erosion mechanism here is modeled by a constant probability of detachment, and local rearrangements are again achieved by a toppling mechanism.
The elementary building blocks of these stochastic models, like the erosion, deposition and toppling steps, have a phenomenological nature, implying that the probability of their occurrence has to be measured experimentally. In this work we propose to adopt a standard statistical mechanics description of the elementary steps, coupled with an external forcing that drives the system out of equilibrium. The role of temperature is here played by the fluctuations of the velocity field.
We focus on the formation and evolution of aeolian ripples. The proposed local-equilibrium dynamics enables to reproduce the main characteristics of ripple dynamics, like the observed stable states and the saturation of ripples heights, without including an explicit mechanism for toppling or other local rearrangements. This simple scheme may be easily extended to include a more detailed description of a real fluid.
II The model
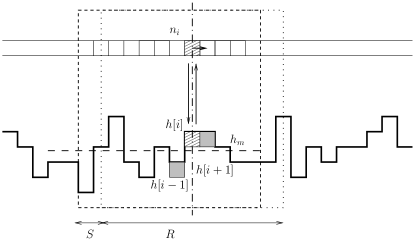
We consider a one dimensional discrete model, being the extension of the segment partitioned in equally spaced intervals, and assuming periodic boundary conditions, Fig. 2.
To each site we associate the height which labels the number of particles constituting the slice of the sand bed. Further, we consider a bunch of particles flowing over the bed. The system is therefore composed of two interacting layers of particles.
The two processes driving the dynamics of the system are: erosion, which occurs when a resting grain belonging to the surface of the sediments layer is entrained by the fluid and deposition, that mimics the deposition of a flowing grain.
The evolution of the system is then modeled as follows: focusing on the site, we select an interval of neighbors, asymmetrically shifted by an amount , see Fig. 2. The amplitude of the interval accounts for the range of local interactions and is shown to be correlated to the shape of the ripple. The quantity is introduced to model hydrodynamics effects, such as lift and drag forces Graf ; Andreotti ; KH2002 , which result in an asymmetry of the flow.

We then calculate the mean height of the selected interval, . As a reasonable hypothesis, assume that the probability to experience an erosion event increases by augmenting the gap between and , under the constraint . Conversely, the deposition will most probably occur when the positive difference gets larger, Fig. 3.
Following the previous reasoning, as a first approximation, we suppose the force acting on a particle to depend on the difference between the height of the site being considered and the mean height of the neighbors. The energy scales therefore as:
| (1) |
The erosion and deposition processes are hence characterized by means of the following change in energy:
| Erosion | Deposition |
|---|---|
Consequently, it is reasonable to assume the erosion and deposition probabilities Metropolis :
where and are constant parameters, analogous to the inverse of effective temperatures , . The system is largely out of equilibrium, and these temperatures are assumed to be related to the amplitude of the fluctuations of the velocity field in correspondence of the typical erosion and deposition events.
III Numerical implementation
The evolution rule, applied simultaneously to each site, is based on a Metropolis Monte Carlo dynamics Metropolis : first the deposition is made to happen followed by the subsequent erosion step. Focusing on the site, the deposition step yields:
-
1.
for each of the flowing particles a uniformly distributed random number is extracted;
-
2.
if deposition occurs and the height of the site is increased by one, , while the bunch of flowing particles is decreased by one, ,
The erosion is characterized by:
-
1.
a uniformly distributed in the unit interval random number is generated;
-
2.
according to the Monte Carlo Metropolis rule the site is eroded if ; in this case the height of the site is decreased by one, , and the pool of eroded particle is increased by one, .
The procedure is iterated and the evolution of the heights monitored.
IV Results
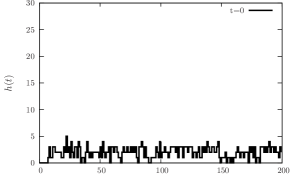
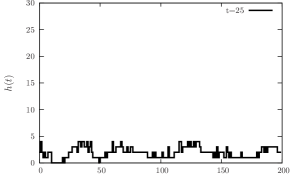
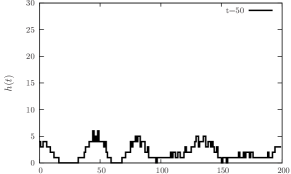
Numerical simulations are performed starting from an initial uniformly random generated river-bed. Small inhomogeneities are enhanced as time progresses, and eventually result in macroscopic ripples that display a characteristic asymmetric profile.
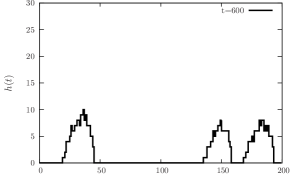
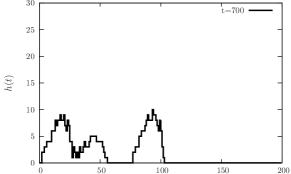

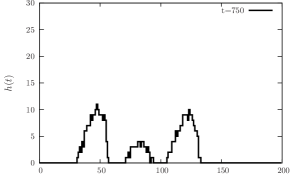


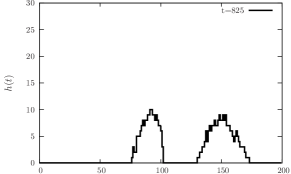

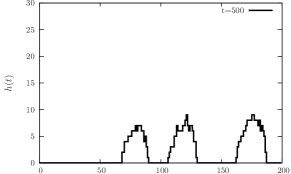
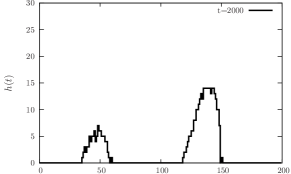
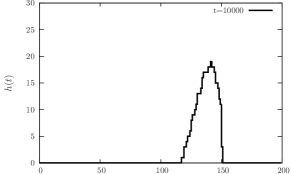
A sequence of successive snapshots of the dynamics is collected in Figure 4 and allows to qualitatively investigate the process of formation of coherent structures.
The displacement of a ripple is a consequence of the combined effects of erosion and deposition: the grains are eroded in the stoss side and deposed in the lee one. This is a dynamical mechanism: there is a continuous exchange between the rest particles and the flowing ones. The global consequence of this flow is that the lower end of the stoss side is eroded and this matter deposes in the lee part, leading to the displacement of the ripple with a velocity that decreases with size.
The interaction mechanism of two ripples is rather complex, as illustrated by the “collision” of two ripples of similar size, Fig. 5. In order to collide, the front ripple has to be larger than the rear one, which is consequently faster. When the two ripples approach, the lower part of the stoss side of the front ripple is no more eroded. This is due (in the model) to the increasing average height, that includes the contribution of the approaching rear ripple. In the reality, this corresponds to the reduction in erosion due to the shielding effect of the rear ripple.
The region of the stoss side next to this one becomes the source of eroded particles, thus forming a local sink. The size of the front ripple is decreased and its speed increased. If the relative difference of velocity of the two ripples is low enough (i.e. for similar ripples of similar size) this depression may proceed enough to make the front ripple detach from the rear one, Fig. 5.
If the rear ripple is small, the sinking region is continuously moved downwind and finally the two ripples coalesce. This mechanism is illustrated in Fig. 6. In the third panel () one can still recognize a signature of this process: focusing on the right ripple, originated by the interaction of two ripples of different size (see first panel), one can still identify the protruding bump on the lee side. This is the relic of the highest peak displayed by the right ripple in the second panel, that experienced a reduction in size and consequently proceeded faster. However, this bump is eventually screened by the rear portion of the ripple. As a consequence it stops and is therefore engulfed in the incoming massive bulk.
These observations are in agreement with direct measurements and provide a first validation of our simplified interpretative framework Bagnold .

Label with the linear size of a typical ripple and assume to represent its characteristic height. By tuning the parameter , i.e. varying the extension of the segment that defines the interacting region, one modulates the ratio and operates an a priori selection among various types of structures (ripples, megaripples, giantripples) based on their intrinsic geometry. The crucial role of has been investigated through a dedicated campaign of simulations: by assigning larger values of corresponds to generate less peaked structure, which translates into a systematic reduction of the quantitative indicator . Focusing on ripples, we assume , and speculate on the role of the remaining parameters and in the formation of the ripple footnote : few quantities of paramount importance are monitored and compared with analogous predictions reported in the classical literature NO1993 ; Caps .
As already anticipated, within our simplified scheme, the ripples present an asymmetric shape which can be measured by introducing the aspect ratio :
| (2) |
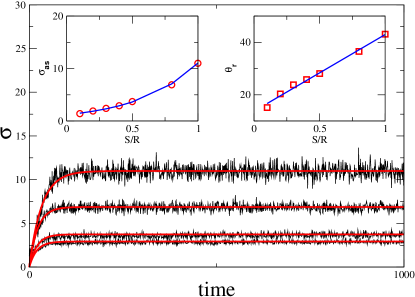
where (resp. ) stands for the projection of the stoss (resp. lee) slope on the horizontal axis, as depicted in Figure 7. If the ripples are symmetric, while implies an asymmetry. In the main panel of Figure 8, the evolution of the ripple aspect ratio is plotted as function of time for different values of the ratio . An initial growth is observed, followed by a subsequent saturation towards an asymptotic plateau, . A self-consistent selection mechanism is therefore operated by the system and eventually only one specific class of ripples arises and occupies the one dimensional lattice. The following ansatz,
| (3) |
is numerically fitted to the simulated profiles of Figure 8 and shown to interpret well the data. To better visualize the tendency of enhancing the degree of asymmetry for increased values of the local distortion S (working at constant R), is represented versus the ratio in the top-left inset of Figure 8. Further, to provide a complete characterization of the morphology of the ripple, we calculate the repose angle , dynamically selected within our proposed approach, as function of the control quantity S/R.
The temporal evolution of was previously monitored in Ref. Caps for both the NO and SCA models. The original NO formulation predicts almost symmetric profiles and therefore . Conversely, for the case of the SCA grows linearly in time and then relaxes to a final value. This remarkable improvement was achieved by Caps and Vandewalle by postulating the existence of a repose angle and modeling the process of avalanches, not included in the NO philosophy. It is worth emphasizing that a somehow similar mechanism (the saturation for being here exponentially approached) is here reproduced without invoking a priori the existence of a limiting angle.
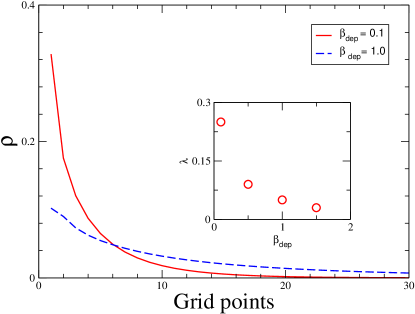
In Figure 9 the deposition process is investigated to shed light into the crucial role of . The normalized density of particles as function of the deposition distance is plotted for distinct values of . The measured distributions decays exponentially and the characteristic length scale is represented versus in the small inset. As expected, for larger values of the particles spend more time in the surrounding halo and retard the deposition event. We therefore suggest that provides an indirect control of the characteristic length of the reptation process.
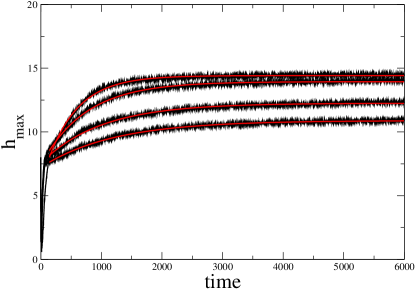
Finally, we studied the dynamical evolution of the maximum ripple height . In Caps the SCA model was shown to reproduce the non linear evolution of the ripple amplitude , this success being ascribed to the new ingredients introduced with respect to the NO scenario. Results of our simulations are reported in Figure 10: as for the SCA an exponential growth law is also found in the framework of our probabilistic approach, thus reinforcing its validity as an alternative tool to address the relevant issue of ripple formation.
V Conclusion
The proposed local-equilibrium model for the study of aeolian ripple dynamics has shown to successfully reproduce important observed features, despite its intrinsic simplicity. In particular, the irreversible and not trivial coarsening dynamics with merging and scattering of structures, the saturating value of the maximum height of the ripples and the asymmetry of ripple structures have been reproduced. The results are critically compared with the classical literature NO1993 ; Caps , outlining the role of the parameters involved in our formulation and their physical interpretation. This simple formulation may be easily extended to include a more detailed description of the fluid flow and the characteristics of the granular phase.
References
- (1) R.A. Bagnold, The Physics of Blown Sand and Desert Dunes (Chapman and Hall, London, 1941).
- (2) K. Pye and H.Tsoar, Aeolian Sand and Sand Dunes (Unwin Hyman, London, 1990).
- (3) http://www.art-landscape.com/Nature/SandDuneRipples600.eps
- (4) http://www.abc.net.au/science/news/space/SpaceRepublish_986918.htm
- (5) H. Nishimori, N. Ouchi, Phys. Rev. Lett. 71, 197 (1993).
- (6) B. Andreotti, P. Claudin, S. Douady, Eur. Phys. J. B 28, 321 (2002).
- (7) K. Kroy, G. Sauermann, H. Hermann, Phys. Rev. Lett. 88, 54301 (2002).
- (8) O. Terzidis, P. Claudin, and J.-P. Bouchaud, Eur. Phys. J. B 5, 245 (1998).
- (9) A. Valance and F. Rioual, Eur. Phys. J. B 10, 543 (1999).
- (10) L. Prigozhin, Phys. Rev. E 60, 729 (1999).
- (11) A. Valance, Eur. Phys. J. B 45, 433 (2005).
- (12) P.-Y. Lagree, Phys. Fluids 15, 2355 (2003).
- (13) Z. Csahók , C. Misbah, F. Rioual, A. Valance, Eur. Phys. J. E 3, 71 (2000).
- (14) R. S. Anderson, Sedimentology 34, 943 (1987).
- (15) R. S. Anderson, Earth Sci. 29, 77 (1990).
- (16) B. T. Werner and D. T. Gillespie, Phys. Rev. Lett. 71, 3230 (1993).
- (17) H. Caps, N. Vandewalle, Phys. Rev. E, 64, 041302 (2002).
- (18) R. S. Anderson, K. L. Bunan, Nature 365, 740 (1993).
- (19) A. Masselot and B. Chopard, Europhys. Lett. 42, 259 (1998); B. Chopard, A. Masselot and A. Dupuis, Comp. Phys. Comm. 129, 167, (2002).
- (20) W. Graf, Hydraulics of sediment transport, (McGraw-Hill, New York, 1971).
- (21) N. Metropolis, A.W. Rosenbluth, M.N. Rosenbluth. A.H. Teller and E. Teller, J. Chem. Phys. 21, 1087 (1953).
- (22) The quantity refers to the granular material selected and indirectly measure its degree of packing and internal cohesion. In the present study we assume .