Theoretical and Experimental Adsorption Studies
of Polyelectrolytes
on an Oppositely Charged Surface
Using self-assembly techniques, x-ray reflectivity measurements, and computer simulations, we study the effective interaction between charged polymer rods and surfaces. Long-time Brownian dynamics simulations are used to measure the effective adhesion force acting on the rods in a model consisting of a planar array of uniformly positively charged, stiff rods and a negatively charged planar substrate in the presence of explicit monovalent counterions and added monovalent salt ions in a continuous, isotropic dielectric medium. This electrostatic model predicts an attractive polymer-surface adhesion force that is weakly dependent on the bulk salt concentration and that shows fair agreement with a Debye-Hückel approximation for the macroion interaction at salt concentrations near 0.1 M. Complementary x-ray reflectivity experiments on poly(diallyldimethyl ammonium) chloride (PDDA) monolayer films on the native oxide of silicon show that monolayer structure, electron density, and surface roughness are likewise independent of the bulk ionic strength of the solution.
Introduction
Coulombic interactions are ubiquitous in biological systems, as Nature uses them in aqueous environments to regulate the structure of biological macroions such as proteins so that desired catalytic properties can be maintained.[1, 2] Whereas electrostatic interactions are very important to biological systems, water-soluble synthetic polymers (i.e., polyelectrolytes) also use electrostatic interactions to gain solubility in hydrophilic environments and, like proteins, are also expected to optimize their structures using secondary interactions such as dipole-dipole and hydrogen-bonding interactions. Coulombic interactions apply more generally to many industrial applications; for example, they are key to controlling the stability and flocculation properties of colloids.[3, 4, 5] A clear example of the significance of electrostatic interactions is the biologically inspired concept of molecular self-assembly on surfaces. In essence, molecular self-assembly is a phenomenon in which hierarchical organization or ordering is spontaneously established in a complex system without external intervention. Electrostatic interactions have been successfully employed in the fabrication of layered molecular assemblies,[6] including functional multilayered devices such as light-emitting thin films and diodes.[7, 8] Here we discuss electrostatic interactions as a driving force in the spontaneous self-assembly of rigid polyelectrolytes on surfaces.
Numerous analytical, simulational, and experimental polyelectrolyte adsorption studies (for reviews, see Refs. [9, 10, 11, 12]) have examined how the amount of adsorbed polymer and thickness of the absorbed layer depend on properties such as the solution ionic strength, solution pH, molecular weight or length of polymer, bulk polymer concentration, linear charge density of the polymer, and surface potential or surface charge density. Nearly all of these studies focus on flexible, “weak” polyelectrolytes of variable degree of dissociation along the chain. The difficulty in treating polyelectrolyte adsorption theoretically lies in the complex interplay among chain conformational entropy and long-ranged electrostatics.[10, 13, 14, 15, 16] The entropy introduced into the system by the flexible backbones competes with the inherent bare attraction between the oppositely charged chains and surface.[17] Here, we study just one aspect of polyelectrolyte adsorption problem: the effect of ionic strength on the effective forces between charged polymers and an oppositely charged surface. Added salt has been noted for its dual effect on adsorption; whether or not increasing the salt concentration leads to an increase or decrease in the adsorbed amount depends on the balance between the screening of intrachain repulsion and chain-surface attraction.[18] For hydrophobically modified polyelectrolytes, added salt can act as a switch for adsorption.[19] To eliminate the issue of the internal degrees of freedom of the chains, we treat the chains as rigid rods so that the roles of electrostatics and ion entropy can be studied.
The most often studied self-assembling experimental systems are self-assembled monolayers because they can be conveniently manipulated and studied on substrate surfaces. In particular, oxide surfaces with their low negative charge density can be used to anchor polycations—rather than monovalent cations—because the number of charge-charge attractions is greater. Since the Coulombic energy to separate a monovalent ion pair in water initially at a distance of 5 Å is 3.5 kJ/mol, or about 1.4 times the thermal energy, a single charge-charge interaction is usually not strong enough to produce well-organized monolayer structures. Multiple charge attractions, however, are able to generate good surface adhesion between films and substrates. Poly(diallyldimethyl ammonium) chloride (PDDA), whose idealized structure is shown in Fig. 1, is an ideal example for this study for several reasons. PDDA is a “strong” polyelectrolyte; its backbone charge density (and hence morphology) is not influenced by the pH of the surrounding solution. As it also lacks lone electron pairs and empty orbitals, it neither participates in hydrogen bonding nor functions as a ligand to metal ions. Thus, the dominant interactions involving PDDA are expected to be electrostatic in nature.
In this paper we calculate the effective interaction between an array of model rigid rods parallel to an oppositely charged interface in the presence and absence of added salt using Brownian dynamics simulations with explicit ions in a continuous aqueous medium. The resulting effective interaction is an attractive adhesion force that depends relatively weakly on the bulk concentration of monovalent salt. We also present complementary x-ray reflectivity measurements on single-layer PDDA films on the native oxide of a silicon substrate that show a weak dependence on ionic strength (due to monovalent salt) in the monolayer structural properties of electron density, surface roughness, and thickness. The model suggests that PDDA monolayers self-assemble via a largely salt-independent, adhesion-attraction force when the intermolecular interactions are governed by electrostatics.
Theory
A Model
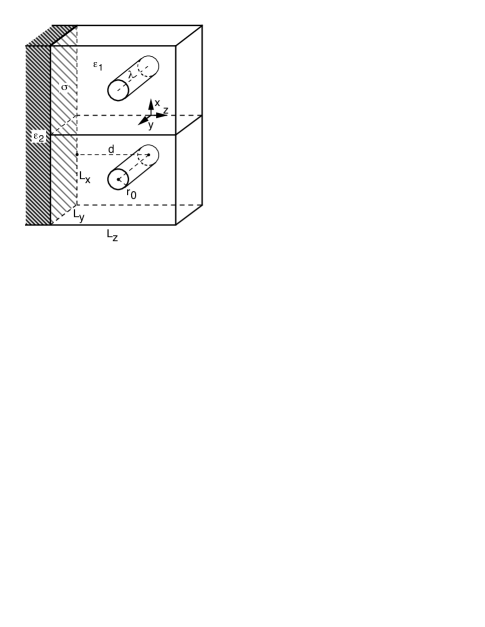
The model consists of a combination of mobile ions and fixed macroions together in a unit cell. Figure 2 shows two adjacent unit cells, each of which is rectangular region of dimensions and contains a single line charge (i.e., PDDA) of uniform charge density located a distance from a fixed, flat surface (i.e., silicon) of a specified uniform charge density located at . To approximate an infinite thermodynamic system, the unit cell is replicated in the and directions using periodic boundary conditions to produce an infinite one-dimensional array of infinitely long, parallel line charges of spacing and repeat distance in the direction, parallel to a charged, infinite plane. The direction is not periodic. The dielectric constant within the unit cell is , and that of the medium below () is . For simplicity, the case where is studied, thereby producing no dielectric interface. Counterions and co-ions, consisting of monovalent cations and anions, are added such that the system is overall charge neutral. To study systems having a “bulk” concentration of salt, a uniformly charge-neutral surface is placed at to confine the particles during the simulation.
As exact correspondences between the physical parameters describing real PDDA polymers and silicon surfaces with a native oxide layer are difficult to make, we make the following approximations. Real PDDA polymers (Fig. 1) have one positive charge per 5.4 Å and have an anisotropic diameter, ranging from 4 to 12 Å due to their molecular structure. The model rod is chosen to have a uniform axial linear charge density Å and a radius of an intermediate value of 4 Å. This rod size enters through a short-ranged repulsion between the rod axis and the mobile ions and is discussed in the next section. The rod spacing is taken to be 40 Å. The native oxide on silicon and its distribution of negatively charged hydroxyl groups is represented by a uniform surface charge density Å2. The dielectric constants of the aqueous medium and substrate interior were both set equal to 80, and all simulations were carried out at room temperature.
Each simulation further required the specification of the values for the rod-center-to-surface separation distance , the repeat rod segment length , unit cell height , and the numbers and charges of the mobile particles. The values of and fell into the ranges 60–150 Å and 60–120 Å, respectively, and approximately 100 ions were introduced at random into the unit cell until the system became charge neutral. The Brownian dynamics algorithm [20] used to simulate the motion of the ions relates the positions of the ions at a time to those at the previous time according to the relation , where is the deterministic force acting on ion due to long-ranged electrostatic and short-ranged nonelectrostatic interactions, represents the random displacement of ion due to the random thermal motions of a discrete solvent, is the isotropic diffusion constant, is Boltzmann’s constant, and is temperature. This description assumes the solvent to be a continuum. The diffusion constant is related to the particle mass and the coefficient of friction , due to a particle moving against the solvent, by the relation . In all simulations and the time step was 0.005, in normalized units. At every time step the force is calculated as the gradient of the potential energy surface due to the ions, rods, and the surface, and the random displacement is chosen independently for each particle from a Gaussian distribution with a variance of in each spatial component.[21] The positions of the particles were updated according to the periodic boundary conditions. During the simulations the average vertical -force on the rod (i.e., the component of the force acting on the rod in the direction perpendicular to the charged surface) and the distributions of the ions were monitored. The system was considered to have reached equilibrium when the time-averaged vertical force on the rod reached a steady value, the average lateral -force on the rod was zero, the total system energy reached a steady value, and the ion distributions remained stationary. These requirements necessitated the time averages to be accumulated for up to 11 106 time steps after the initial 5–25 104 steps were discarded.
B Interaction potentials
The interaction potentials used in the simulations consist of pairwise, long-ranged electrostatic forces and short-ranged, nonelectrostatic repulsions, where the electrostatic interactions are exact for these periodic systems. The ion-surface electrostatic interaction per unit cell is a function of the distance between an ion with charge and the surface:
| (1) |
where is the vacuum permittivity. The rod-surface electrostatic contribution per unit cell for a uniform surface charge distribution is similarly
| (2) |
The ion-ion electrostatic potential energy per unit cell for an ion with charge at the point in the unit cell and an ion with charge in the unit cell and its replicas located at , where are integers, resulting from the two-dimensional replication of the unit cell in the and directions, is [22]
| (3) |
| (4) |
| (5) |
| (6) |
where is the modified Bessel function of the second kind of order zero. The ion-rod potential energy per unit cell is the combined logarithmic interactions between a point particle and a one-dimensional array of line charges. The analytic form of is derived from the potential energy of an ion interacting logarithmically with a two-dimensional array of line charges arranged on a rectangular lattice (see Eq. (14) in Ref. [23]) by eliminating one of the dimensions. The result is
| (7) |
| (8) |
The associated ion-ion and rod-rod self-energies arising from an ion/rod interacting with its own periodic replicas are given elsewhere [22, 24] and need not be considered in this work.
Finally, the ion-ion, ion-rod, ion-surface, and rod-surface short-ranged, nonelectrostatic repulsions were modeled as , , , and , respectively, to prevent electrostatic collapse of the charge-neutral system. The combination of Coulombic attraction and short-ranged repulsion between two oppositely charged ions, ion and rod, ion and surface, or rod and surface introduces optimal ion-ion, ion-rod, ion-surface, and rod-surface distances, respectively. Chemically speaking, these optimal distances are a measure of the “polar-bond” distance between oppositely charged species. Values of the coefficients were 103 kcal Å12/mol, 105 kcal Å11/mol, 102 kcal Å10/mol, and 104 kcal Å9/mol, giving optimal ion-ion, ion-rod, ion-surface, and rod-surface distances of 2.4, 4.0, 2.4, and 4.0 Å, respectively. In general, in order to use a line-charge model to represent a PDDA polymer and its nonaxially distributed ammonium charge centers, the model rod radius differs from the real size of the polymer so that the electrostatic “binding” energy between a counterion and a PDDA charge—on the order of a few —can be obtained. The ion-rod short-ranged interaction was applied to all mobile charges and was taken according to the minimum image convention.[20]
Experimental
The preparation of self-assembled PDDA monolayers has been described previously.[25] Here we summarize the main points and describe the differences from previous experiments. The growth of PDDA monolayers was carried out on thin silicon wafers instead of thick silicon substrates. The PDDA solution concentration used for these experiments was 0.1 M instead of 1 mM, and the ionic strength of these solutions was tuned with monovalent salt (NaCl) to obtain ionic strengths of = 0.001, 0.01, and 0.1 M. The reaction time for deposition of PDDA onto the substrate was extended from 5 min to 20 min at room temperature. The x-ray reflectivity measurements were carried out as described previously without modification, and the quality of the data for thin silicon wafers (500 m) is the same as those of thick silicon substrates (0.1 cm).
Results and Discussion
To see the qualitative similarity between theory and experiment on the structural properties of monolayers of rigid rods near oppositely charged surfaces, we first examine the results of the particle simulations. Figure 3 shows a typical concentration profile for the mobile ion species at equilibrium. The time-averaged monovalent cation distribution near the surface and monovalent anionic distribution near the rod are noticeably peaked. At large distances from both the rod and surface, the concentration profiles are featureless. This flat region is identified as the bulk electrolyte solution, whose salt concentration is given by the height of the plateau. The concentration in Fig. 3 is approximately 0.13 M. Clearly, the local concentration of ions can differ significantly from the bulk. For the surface charge density used in the simulations, the ion concentration near the surface is two orders of magnitudes greater than the bulk (not shown). The bulk concentration as indicated by the simulation corresponds to the concentration that would be measured experimentally.
The time-averaged vertical -force on the rod that we call the adhesion force and its dependence on for sample values of the fixed rod-surface distance is shown in Fig. 4. Force values greater than zero indicate an effective rod-surface repulsion; less than zero, an attraction. Here, a bulk concentration of zero means that only a charge-neutralizing number of counterions was added to the simulation unit cell with the neutral lid removed. The data reveal that the effective attraction decreases rather weakly with increasing salt concentration for all distances . For small , this behavior may simply be the result of salt exclusion from between the rod and the surface. An alternate way of viewing the effect of on the adhesion force is shown in Fig. 5, where the force (, , and *) is now plotted against the rod-surface spacing for several values of the bulk salt concentration. Figure 5, obtained by linear interpolation of the data sets shown in the previous figure, shows three major features: 1) the force at Å is approximately zero; 2) there is a shoulder in the force curve near to 8 Å; and 3) the effective attractive force generally decreases with increasing rod-surface distance, regardless of . The fact that the force crosses over from attraction to repulsion near Å results from our having fixed the equilibrium rod-surface distance in the absence of any ions at 4 Å in the model via the short-range repulsive coefficients discussed earlier. The shoulder is likely due to the finite size of the ions because the ions are expected to be able to pass freely in between the rod and the surface only for Å.
The interpolated force-distance data was compared to Debye-Hückel theory[26] (DHT), adapted to interactions between macroions. Briefly, DHT is a mean-field theory that gives an exponentially screened Coulombic electrostatic interaction between two ions due to their ionic atmospheres. The adhesion force per unit length of rod acting on each rod as a function of the rod-surface distance is
| (9) |
where is the Debye screening length, given in terms of the (bulk) ionic strength as . As a guideline, DHT generally provides an adequate description of electrostatic interactions between two ions when their interaction energy is small compared to . The above expression for the adhesion force, if it is valid, is thus expected to provide better predictions for the adhesion force as increases. The results of DHT are shown in Fig. 5 as the solid and broken lines for bulk ionic strengths of 0, 0.06, and 0.12 M, corresponding to values of 0, 0.08, and 0.11 Å-1, respectively, as derived from the simulation data. At small rod-surface separation distances, agreement between DHT and the simulations not surprisingly fails because the simulations include a short-ranged rod-surface nonelectrostatic repulsion that is absent from DHT. Under conditions of zero ionic strength, the simulations and DHT disagree severely as a result of the incompatibility of DHT and our method for determining from the simulations. Although DHT can in principle account for screening due to counterions alone, the formulation of implicitly assumes that screening is primarily due to added salt. In the absence of salt, the resulting electrostatic interaction is that of uniformly charged, bare macroions. At ionic strength values of 0.06 and 0.12 M, DHT is seen to capture fairly well the behavior of the interpolated force-distance curves for distances beyond the shoulder ( Å), with better agreement occurring for the larger ionic strength values. Interestingly, the simulations and DHT results seem comparable for Å, although the validity criterion on the electrostatic interaction energy is marginally satisfied for the range of rod-surface distances shown. Finally, there may still be a qualitative disagreement in the force between the simulations and DHT for Å. Whereas DHT gives an adhesion force on the rod that decays exponentially with distance, simulations indicate a more slowly decaying force and may be due to the increased equilibration times needed for large rod-surface separations.
Under the condition that DHT in Eq. (9) is a good approximation to the adhesion force curve, the adhesion or “dissociation” energy per unit length rod per rod may be calculated as the integral of the force:
| (10) |
where is the equilibrium distance of the rod from the surface. The inset of Fig. 5 shows the adhesion energy per rod as a strongly decaying function of the bulk salt concentration that goes as . The DHT model gives a substantial adhesion energy: about 30 kcal/mol for every 10 nm of rod in a 0.1 M (monovalent) salt solution.
The theoretical model suggests that in experiments, where the polymer rods are mobile in solution, the rods would be attracted to the surface by a fairly salt-independent adhesion force and thus would move spontaneously toward the surface and possibly form a monolayer. Indeed, monolayer formation is observed in the molecular self-assembly of PDDA polymer as evidenced by x-ray reflectivity measurements. PDDA was found to form a uniform nanometer-thick thin film on a silicon substrate at various solution ionic strengths in the range 0.001 to 0.1 M. Other film properties, such as the film electron density and surface roughness, were also found to be independent of the bulk salt concentration. The driving force for the formation of the monolayers on the surface is the electrostatic attraction between the charged rods and surface.
To verify the weak influence of ionic strength on the surface and PDDA rod adhesion characteristics, we performed x-ray reflectivity characterization of the monolayers by measuring their reflectivity profiles. The reflectivity profiles , normalized to unit reflectivity, are shown as a function of momentum transfer in Fig. 6. The maximum of the reflectivity profile occurs at a value of corresponding to the condition when the x-ray radiation in the sample is evanescent (), [27] and the sample surface subtends the full width of the x-ray beam. A difference, or contrast, between the electron densities of the PDDA monolayer and the silicon substrate produces fringes and oscillations in the x-ray reflectivity. The amplitude of the fringes is related to the magnitude of the contrast in electron densities. The oscillations with are caused by interference between the x-ray beam reflected by the film-air and film-substrate interfaces, and the period of the oscillation is inversely related to the film thickness. In addition to the decay in the reflectivity of the sample with due to the Fresnel reflectivity, the reflectivity profile may be further attenuated by roughness at the interfaces. This decay is related to the variation in the displacement of the interface in the direction normal to the surface about a mean value across the sample. The fluctuation in interface height forms a distribution whose root-mean-square width, , increases the attenuation of the reflectivity profile with .
The x-ray reflectivity data was fitted to a model [27] for single-layer films on a substrate which yields the average electron density of the film, , the thickness of the film, , and the surface roughness of the film, . The values of these parameters were determined for the PDDA monolayers by perturbing the values from initial guesses until the weighted difference between the observed data ( in Fig. 6) and the fitted profile was minimized, and the resulting calculated reflectivity profiles are shown as the solid curves in Fig. 6. For PDDA monolayers formed from solutions of ionic strengths of 0.001, 0.01, and 0.1 M NaCl, the electron density values were calculated to be, respectively, , 0.225, and 0.234 , with thicknesses of 12.7, 12.8, and 12.4 Å, and surface roughnesses of 1.2, 1.2, and 0.9 Å for the PDDA-air interfaces. Not only are these thickness values consistent with the formation of a monolayer of PDDA whose molecules are upright, as shown in Fig. 1, but also the fitted profiles reveal that the monolayer structural parameters are independent of the bulk ionic strength of the initial PDDA solution. Thus, these experimental results support the theoretical simulation model in that ionic strength, as varied from 0.001 to 0.1 M experimentally and from 0 to 0.12 M theoretically, does not greatly affect the adhesion characteristics of the polymer rods to substrate surfaces.
Conclusions
We have developed a theoretical simulation model to predict self-assembly behavior of rod-like polymers in aqueous salt solutions based on electrostatic interactions and presented supporting experimental x-ray reflectivity data for PDDA monolayers. The model shows that the bulk ionic strength, due to monovalent salt, has only a small effect on the effective attractive force between model rods and an oppositely charged surface. Experimental x-ray reflectivity results demonstrated that PDDA monolayer structure (thickness) and morphology (roughness) do not vary significantly over the two orders of magnitude of solution ionic strength studied. Comparison of the model results to the prediction of Debye-Hückel theory (DHT) for macroions revealed fair agreement, even though the expected range of validity of DHT likely lies outside the region of parameter space studied by the simulations, and the reason for this apparent agreement is not well understood. Nonetheless, the theoretical and complementary experimental results of the adhesion of charged rigid rods onto an oppositely charged substrate are in good agreement.
Dynamic simulations involving mobile rods and ions would be interesting, as the kinetics[28, 29, 30, 31, 32, 33] of the adsorption process could be studied. Whereas we have shown in this paper that a planar array of rods is attracted to the surface via electrostatic interactions, new information as to 1) the surface distribution of the rods and 2) whether the rods adsorb independently or form bundle-like structures in solution prior to adsorption could be obtained. However, such simulations are expected to depend sensitively on the model rod parameters, in particular, on the rod size and on the distribution of the charged sites. It was recently shown[34] that for two isolated, like-charged rods in an infinite space under no-salt conditions that the rod size is a crucial control parameter for determining whether (divalent) counterions could mediate an effective attraction between the rods. This finding suggested that for a given linear charge density of the rods, there was a maximal rod size that would allow the rods to be mutually attracted. Similar conclusions about the rod size were reached in systems of like-charged rods and surfaces using the geometry discussed in this paper.[24] Nontrivial charge distributions on the rod surface are expected to complicate matters further.
Whereas we have focused here on electrostatic interactions, other interactions such as hydrogen bonding, hydrophobic effects, and explicit dipole interactions are important in materials in many fields of research. However, the idea of incorporating combined secondary interactions in the design of new synthetic macromolecular materials remains largely unexplored systematically.[35] We anticipate that further modelling of electrostatic and other interactions will not only provide insight into the structure of biocompatible polymers in solution, but also lead to better design and construction of electronic and optical devices using molecular self-assembly techniques.
Acknowledgments
We thank Robijn Bruinsma, William Gelbart, Li-Chung Ku, and Philip Pincus for helpful discussions. This work was performed under the auspices of the United States Department of Energy, supported in part by Contract No. W–7405–Eng–36 (MF, ML, and DL), by funds provided by the University of California for conduct of discretionary research by Los Alamos National Laboratory (NGJ), and by NSF Grant No. DMR–9708646 (RJM).
REFERENCES
- [1] T. Smilda, P. Reinders, and J. J. Beintema, Biochem. Gen. 36, 37 (1998).
- [2] V. Z. Spassov, R. Ladenstein, and A. D. Karshikoff, Protein Sci. 6, 1190 (1997).
- [3] J. S. Vanduijneveldt and D. Beysens, J. Chem. Phys. 94, 5222 (1991).
- [4] J. E. Seebergh and J. C. Berg, Langmuir 10, 454 (1994).
- [5] F. F. Peng and P. K. Di, J. Colloid Interface Sci. 164, 229 (1994).
- [6] G. Decher, Science 277, 1232 (1997).
- [7] J. K. Lee, D. S. Yoo, E. S. Randy, and M. F. Rubner, Appl. Phys. Lett. 69, 1686 (1996).
- [8] A. C. Fou, O. Onitsuka, M. Ferreira, M. F. Rubner, and B. R. Hsieh, J. Appl. Phys. 79, 7501 (1996).
- [9] M. A. Cohen Stuart, J. Phys. (Paris) 49, 1001 (1988).
- [10] M. A. Cohen Stuart, G. J. Fleer, J. Lyklema, W. Norde, and J. M. H. M. Scheutjens, Adv. Colloid Interface Sci. 34, 477 (1991).
- [11] G. J. Fleer, M. A. Cohen Stuart, J. M. H. M. Scheutjens, T. Cosgrove, and B. Vincent, Polymers at Interfaces (Chapman & Hall, London, 1993), Chap. 11.
- [12] C. A. Haynes and W. Norde, Coll. Surf. B 2, 517 (1994).
- [13] F. Oosawa, Polyelectrolytes (Marcel Dekker, New York, 1971).
- [14] P. G. De Gennes, Scaling Concepts in Polymer Physics (Cornell Univ., Ithaca, NY, 1979).
- [15] T. Odijk, Macromolecules 12, 688 (1979).
- [16] A. V. Dobrynin, R. H. Colby, and M. Rubinstein, Macromolecules 28, 1859 (1995).
- [17] M. Muthukumar, J. Chem. Phys. 86, 7230 (1987).
- [18] H. G. M. van de Steeg, M. A. Cohen Stuart, A. de Keizer, and B. H. Bijsterbosch, Langmuir 8, 2538 (1992), and references therein.
- [19] Y. Zhang and M. Tirrell, Macromolecules 29, 7299 (1996).
- [20] M. P. Allen and D. J. Tildesley, Computer Simulation of Liquids (Oxford, New York, 1987).
- [21] G. Parisi, The Stochastic Approach in Statistical Field Theory (Addison-Wesley, Redwood City, 1988).
- [22] N. Grønbech-Jensen, G. Hummer, and K. M. Beardmore, Mol. Phys. 92, 941 (1997).
- [23] N. Grønbech-Jensen, Int. J. Mod. Phys. C. 7, 873 (1996); 8, 1287 (1997).
- [24] R. J. Mashl and N. Grønbech-Jensen, J. Chem. Phys. 109, 4617 (1998).
- [25] M. Lütt, M. R. Fitzsimmons, and D. Q. Li, J. Phys. Chem. B 102, 400 (1998).
- [26] D. A. McQuarrie, Solutions of strong electrolytes in Statistical Mechanics (Harper and Row, New York, 1976).
- [27] L. G. Parratt, Phys. Rev. 95, 359 (1954).
- [28] T. G. M. Vandeven, Adv. Colloid Interface Sci. 48, 121 (1994), and references therein.
- [29] N. G. Hoogeveen, M. A. Cohen Stuart, and G. J. Fleer, J. Colloid Interface Sci. 182, 133 (1996); 182, 146 (1996).
- [30] J. B. Schlenoff and M. Li, Ber. Bun.-Gesell. Phys. Chem. Chem. Phys. 100, 943 (1996).
- [31] M. A. Cohen Stuart, C. W. Hoogendam, and A. de Keizer, J. Phys. Cond. Matt. 9, 7767 (1997).
- [32] N. L. Filippova, Langmuir 14, 1162 (1998).
- [33] E. S. Pagac, D. C. Prieve, and R. D. Tilton, Langmuir 14, 2333 (1998).
- [34] N. Grønbech-Jensen, R. J. Mashl, R. F. Bruinsma, and W. M. Gelbart, Phys. Rev. Lett. 78, 2477 (1997).
- [35] M. Muthukumar, C. K. Ober, and E. L. Thomas, Science 277, 1225 (1997).