Asymmetries in the Production of and Baryons in 500 GeV/c
Nucleon Interactions
E. M. Aitala
S. Amato
J. C. Anjos
J. A. Appel
D. Ashery
S. Banerjee
I. Bediaga
G. Blaylock
S. B. Bracker
P. R. Burchat
R. A. Burnstein
T. Carter
H. S. Carvalho
N. K. Copty
L. M. Cremaldi
C. Darling
K. Denisenko
S. Devmal
A. Fernandez
G. F. Fox
P. Gagnon
C. Gobel
K. Gounder
A. M. Halling
G. Herrera
G. Hurvits
C. James
P. A. Kasper
S. Kwan
D. C. Langs
J. Leslie
B. Lundberg
J. Magnin
S. MayTal-Beck
B. Meadows
J. R. T. de Mello Neto
D. Mihalcea
R. H. Milburn
J. M. de Miranda
A. Napier
A. Nguyen
A. B. d’Oliveira
K. O’Shaughnessy
K. C. Peng
L. P. Perera
M. V. Purohit
B. Quinn
S. Radeztsky
A. Rafatian
N. W. Reay
J. J. Reidy
A. C. dos Reis
H. A. Rubin
D. A. Sanders
A. K. S. Santha
A. F. S. Santoro
A. J. Schwartz
M. Sheaff
R. A. Sidwell
F. R. A. Simão
A. J. Slaughter
M. D. Sokoloff
J. Solano
N. R. Stanton
R. J. Stefanski
K. Stenson
D. J. Summers
S. Takach
K. Thorne
A. K. Tripathi
S. Watanabe
R. Weiss-Babai
J. Wiener
N. Witchey
E. Wolin
S. M. Yang
D. Yi
S. Yoshida
R. Zaliznyak
C. Zhang
Centro Brasileiro de Pesquisas Físicas, Rio de Janeiro, Brazil
University of California, Santa Cruz, California 95064, USA
University of Cincinnati, Cincinnati, Ohio 45221, USA
CINVESTAV, 07000 Mexico City, DF Mexico
Fermilab, Batavia, Illinois 60510, USA
Illinois Institute of Technology, Chicago, Illinois 60616, USA
Kansas State University, Manhattan, Kansas 66506, USA
University of Massachusetts, Amherst, Massachusetts 01003, USA
University of Mississippi–Oxford, University, Mississippi 38677, USA
Princeton University, Princeton, New Jersey 08544, USA
Universidad Autonoma de Puebla, Mexico
University of South Carolina, Columbia, South Carolina 29208, USA
Stanford University, Stanford, California 94305, USA
Tel Aviv University, Tel Aviv 69978, Israel
Box 1290, Enderby, British Columbia V0E 1V0, Canada
Tufts University, Medford, Massachusetts 02155, USA
University of Wisconsin, Madison, Wisconsin 53706, USA
Yale University, New Haven, Connecticut 06511, USA
Abstract
We present a measurement of asymmetries in the production of
and baryons in 500 GeV/
–nucleon interactions from the E791 experiment at Fermilab.
The asymmetries were measured as functions of Feynman () and
transverse momentum squared () using a sample of
’s observed in the decay channel .
We observe more than baryons, with an asymmetry of
independent of and in our kinematical
range ( and ).
This asymmetry measurement is the first with data in
both the positive and negative regions.
Several studies [1] have reported an
enhancement in the production rate
of charm particles having a valence quark or diquark in common with the
incident particles, relative to charge-conjugate particles which have
fewer or no common valence quarks. This effect, known as the
leading-particle effect, cannot be accounted for by
next-to-leading-order perturbative QCD (pQCD) calculations followed
by Peterson fragmentation of the produced and quarks.
Thus, the effect is attributed to additional hadronization
effects or non-pQCD contributions to charm production.
In this work we report on the production
asymmetry measured using a sample containing
fully-reconstructed
and charge conjugate (c.c.) decays from the Fermilab
E791 experiment. The data are from 500 GeV/ -nucleon
interactions. This measurement represents a significant increase in
statistics from previously published results, and it also explores for the
first time the production asymmetry at negative values of .
This feature of our measurement allows us to look both for
diquark effects which should be present in the negative region (since
the has two valence quarks in common with the target particles whereas
the has none)
and for leading particle effects in the positive
region (in which both the particle and antiparticle share a single
valence quark with the incident pions). The production asymmetries are
measured as functions of and in the kinematic
ranges and .
Varied predictions about what asymmetries should be observed in the E791
data are made by three models which address leading particle effects:
the string fragmentation (SF) model [2], the intrinsic charm (IC) model
[3], and the two-component recombination (2CR) model [4].
In the string fragmentation model implemented in the Lund Pythia/Jetset package [5], the and quarks produced by leading
order QCD diagrams are connected
by color strings to valence quarks or diquarks in the beam or target
particles. Hadronization proceeds through fragmentation of the ends of the
color string and recombination with valence quarks from the initial
particles. The model predicts a negative asymmetry (more than ) for
, a positive asymmetry for , and a flat dependence on .
For the intrinsic charm model, fluctuation of one or the other of the
incident particles to a Fock state containing quarks
( or for nucleons
and for ) favors
production of particles with valence quarks in common with the Fock state
via a coalescence (recombination) mechanism. Hence, this model predicts no
asymmetry in the region and a positive asymmetry for ,
increasing as one moves toward more negative .
In the two-component recombination model, hadronization takes place
through fragmentation of perturbatively produced and quarks, and
the recombination of valence and () quarks produced in the initial
collision. In the region, this model predicts a positive
asymmetry growing strongly as becomes more negative, due to
target-diquark effects. Again, there is no asymmetry in the pion
fragmentation region () since both and are singly-leading
particles.
The main difference between the IC and 2CR models is that the former
predicts very little asymmetry in the E791 negative range
because the IC distribution
peaks at about of the initial particle momentum. Because of diquark
effects, the 2CR model can account for larger asymmetries in this region.
Neither the IC nor the 2CR model has been used to make a prediction
regarding the variation of asymmetry with respect to . Whatever
asymmetries do exist, however, are expected to decrease as increases,
since the density of beam and target valence quarks available for
recombination decreases with increasing .
Experiment E791 recorded data from 500
interactions in five thin foils (one platinum and four diamond)
with center-to-center separations of about 15 mm. Each foil was
approximately 0.4% of
a pion interaction length thick (0.5 mm for the platinum foil and 1.6 mm
for the carbon foils). The E791 spectrometer [6] in the Tagged
Photon Laboratory was a large-acceptance, two-magnet spectrometer
with eight planes of multiwire proportional chambers (MWPC) and
six planes of silicon
microstrip detectors (SMD) placed upstream of the target
for beam tracking. Downstream of the target
were 17 planes of SMD’s for track and vertex reconstruction,
35 drift chamber planes, two MWPC’s, two multicell threshold
Čerenkov counters, electromagnetic and hadronic calorimeters, and a
muon detector. The experiment recorded interactions using an
open transverse-energy trigger and a fast data acquisition
system [7].
A sample of candidate and
c.c. decays was selected using similar criteria to those reported
in Ref. [8]. Since the mean decay length for ’s
was several mm, in most cases they decayed in air gaps between the target
foils and before entering the silicon
vertex detectors. We selected all combinations of three tracks which had
Čerenkov counter identification probabilities consistent with the
hypothesis and which had a invariant mass between
and GeV/.
We then required that the distance between the reconstructed candidate
decay vertex and the production vertex be at least five times the
rms uncertainty in that distance.
To further reduce background, we required the to decay
a distance greater than from the nearest
material, where is the uncertainty on the
vertex position. The vertex position is also required to lie
between one and four lifetimes from the primary (interaction) vertex.
The momentum vector, reconstructed from its decay
products, was required to pass within of the production
vertex, and the reconstructed production and decay
vertices were each required to have
an acceptable . We also required that no more than one of the
-candidate decay tracks be consistent with coming from the
primary interaction point. The sum of the of the secondary tracks with
respect to the flight path of the reconstructed was required to be
greater than if , and greater than
if .
Events were kept if the candidate had
and .
The invariant-mass plots for the final and
samples are shown in Figs. 1(a) and (b) respectively for
, and in Figs. 1(c) and (d) for .
Fits to a Gaussian signal and a quadratic background
yield and
in the entire and
range.
For each bin of or we define an asymmetry parameter as
(1)
where () is the number of ()
produced in the bin and the efficiency ()
is the product of the geometrical acceptance and reconstruction efficiency
for the bin.
Values for () were obtained from fits to
invariant-mass distributions for events within specific
and ranges. In each case, well defined signals were evident.
Efficiencies (, ) were calculated using a
sample of Monte Carlo (MC) events produced with the Pythia/Jetset event
generator [5]. These events were projected
through a detailed simulation of the E791 detector and then
reconstructed with the algorithms used for the data. The final
reconstructed MC sample was approximately
ten times the size of our data sample. In the simulation of the
detector, special care was taken to accurately simulate the reduced
chamber efficiency seen in the experiment in a
small region of the tracking chambers nearest the beam.
The behavior of the apparatus and details of the reconstruction
code changed during the data taking and data processing periods,
respectively. To account for these effects, we generated
the final MC sample in subsets mirroring these behaviors and
combined the samples using their known fractional contributions
to the data set.
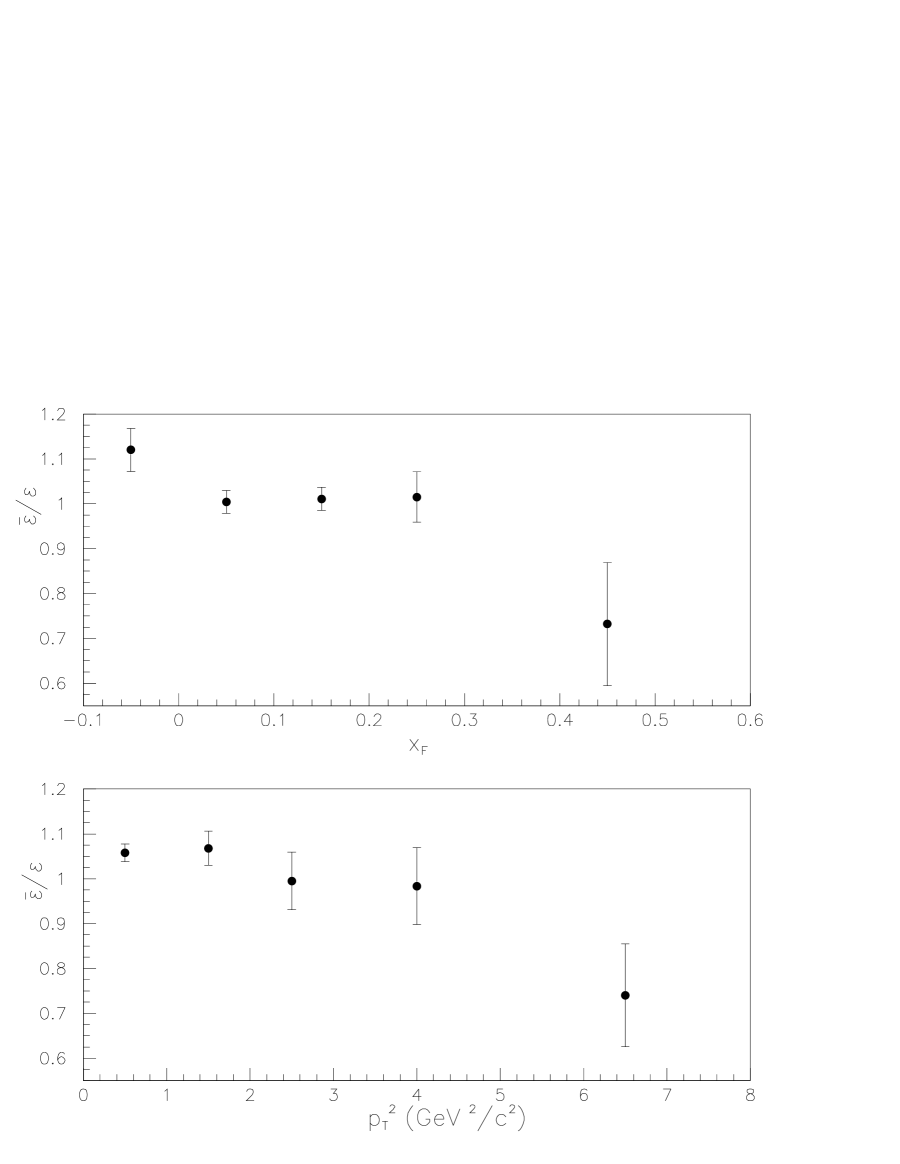
Good agreement between MC and data samples in a variety of kinematic variables
and resolutions was achieved. The efficiency ratios obtained
are shown in Fig. 2.
Acceptance-corrected asymmetries in the range
integrated over all , and
in the range integrated from to
, are shown in Fig. 3 and listed in Table 1.
The statistical errors given include those due to the number of observed
events and the number of MC events accepted. Typically, only for the
highest and bins is the error dominated by the MC uncertainty.
Also shown in Fig. 3 are predictions from the default Pythia/Jetset .
The asymmetries predicted by Pythia are negative for and in all
the range studied, while our data exhibit a positive asymmetry
throughout the kinematical region studied. However, the data do not exclude a
rise in the small negative region.
Sources of systematic uncertainties were checked. Among them we checked the
effect of changing the parametrization of the signal and background shape,
the effect of varying our principal selection criteria and the effect of
a contamination in the beam.
The most significant effect comes from the parametrization of the background
shape and the variation of our principal selection criteria. The effect of the
contamination in the beam, which might produce a negative asymmetry in the
region, was found to be negligible.
We also checked for contamination due to and
decaying into
and modes. We found that, by restricting our sample to have
lifetimes between one and four lifetimes, we reduced any possible contamination to negligible levels.
The SELEX collaboration has measured an asymmetry in the region
using different incident beam particles. Their
preliminary results for the beam indicate an asymmetry
of [9].
The ACCMOR Collaboration [10]
has also measured the asymmetry over the
region in 230 GeV/ –Cu interactions and found
, indicating no asymmetry, although with
large uncertainty. Our measurement, when averaged over the
region, is .
No inconsistencies are observed in these
results. The asymmetries measured by the three
experiments and predictions of theoretical models are shown in Table 2.
In the forward region, leading particle effects
are expected to cancel since, in this region, both particle
and anti-particle share one valence quark
with incident pions. The observed constant asymmetry could be due to
different energy thresholds for particle and antiparticle in
associated production of charmed mesons and baryons. A similar effect
was observed in the hyperon production asymmetries measured in
this experiment [11]. Our data cannot exclude a rise in
asymmetry in the region.
The default Pythia/Jetset model, which predicts a negative asymmetry
over the range , does
not provide a good description of our data. The data show a trend
similar to predictions of the two component models [3, 4].
We have presented data on production
asymmetries in both the forward () and backward ()
regions. The range of covered, allows
the first simultaneous study of the production asymmetry
in both the negative and positive regions. Our results show a
uniform, positive asymmetry of
after acceptance corrections over the entire kinematical range studied .
We gratefully acknowledge the assistance of the staffs of
Fermilab and of all the participating institutions. This research was
supported by the Brazilian Conselho Nacional de Desenvolvimento Científico
e Tecnológico, CONACyT (Mexico), the U.S.-Israel Binational Science Foundation,
the U.S. Department of Energy and the U.S. National Science Foundation.
Fermilab is operated by the Universities Research Associates, Inc., under contract
with the U.S. Department of Energy.
References
[1] E769 Collaboration (G.A. Alves, et al.),
Phys. Rev. Lett. 77, 2388 (1996), E769 Collaboration
(G.A. Alves, et al.), Phys. Rev. Lett. 72, 812 (1994),
WA82 Collaboration (M. Adamovich, et al.),
Phys. Lett. B305, 402 (1993), E791 Collaboration
(E.M. Aitala, et al.), Phys. Lett. B371, 157 (1996),
WA92 Collaboration (M. Adamovich, et al.),
Nucl. Phys. B495, 3 (1997).
[2] B. Andersson, G. Gustafson, G. Ingelman and
T. Sjostrand, Phys. Rep. 97, 31 (1983).
[3] R. Vogt and S.J. Brodsky, Nucl. Phys. B478, 311
(1996).
[4] G. Herrera and J. Magnin, Eur. Phys. J. C2, 477 (1998).
[5]Pythia 5.7 and Jetset 7.4 Physics Manual, CERN-TH-7112/93(1993).
H. U. Bengtsson and T. Sjostrand, Computer Physics Commun.
46, 43 (1987) and T. Sjostrand, CERN-TH.7112/93 (1993).
[6] E791 Collaboration (E.M. Aitala et al.), Eur. Phys. J. C4, 1 (1999);
E791 Collaboration (E.M. Aitala, et al.), Phys. Rev. Lett. 76, 364 (1996), and references therein;
J.A. Appel, Ann. Rev. Nucl. Part. Sci. 42, 367 (1992), and
references therein; D.J. Summers et al., Proceedings of the
XXVIIth Rencontre de Moriond, Electroweak Interactions
and Unified Theories, Les Arc, France (15-22 March, 1992) 417.
[7] S. Amato, et al., Nucl. Instr. and Methods A324, 535 (1993).
[8] E791 Collaboration (E.M. Aitala, et al.),
Phys. Lett. B379, 292 (1996).
[9] James Russ, private communication;
SELEX Collaboration (M. Iori et al.), Proceedings of the EPS-HEP99
Conference, Tampere, Finland, July 1999, hep-ex/9910039.
[10] ACCMOR Collaboration (S. Barlag, et al.),
Phys. Lett. B247, 113 (1990).
[11] J.C. Anjos for the E791 Collaboration, Proceedings of the
Hyperon’99 Conference, Fermilab (27-29 September, 1999), hep-ex/9912039.
Figure 1: and invariant-mass distributions
for and . All distributions show a clear
and signal. Fitting to a Gaussian signal and
quadratic background yields (a) and (b) in
the negative region and (c) and
(d) in the positive region.
Figure 2: and efficiency ratios, as a function of (upper plot) and (lower plot). The efficiency
ratios for () are integrated over the () range of
the data set.
Figure 3: asymmetry as a function of
(upper plot) and (lower plot). Full lines are the prediction of
Pythia/Jetset . The asymmetry for () is integrated
over the () range of the data set. Error bars show
the statistical and systematic errors added in quadrature.
Table 1: Measured asymmetry as a function of and .
bin
Asymmetry
bin
Asymmetry
–
–
–
–
–
–
–
–
–
–
Table 2: Comparison of the asymmetries as measured by the
E791, ACCMOR and SELEX Collaborations and predicted by three models.
Experimental results in the region are for different ranges.
See the text for details.