What can we learn from the Caldwell plot? ††thanks: Talk given at DIS’99, Zeuthen, Germany, April 1999
Abstract
We show that when screening corrections are included is consistent with the behaviour that one expects in pQCD. Screening corrections explain the enigma of the Caldwell plot.
1 Introduction
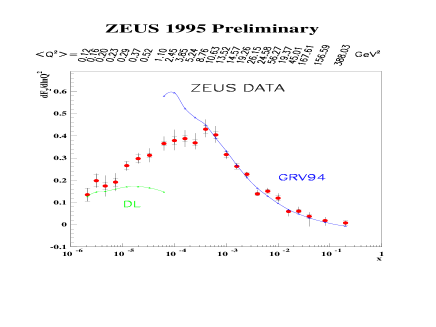
The Caldwell plot [1] of presented at the Desy Workshop in November 1997 suprized the community. The results appeared to indicate that we have reached a region in the x and where pQCD was no longer valid. DGLAP evolution lead us to expect that at fixed would be a monotonic increasing function of , whereas a superficial glance at the data suggests that the logarithmic derivative of deviates from the expected pQCD behaviour, and has a turnover in the region of 2 4 GeV2 (see fig.1 where the ZEUS data and the GRV’94 predictions are shown). Opinions were also voiced that the phenomena was connected with the transition from ”hard” to ”soft” interactions.
Amongst the problems that one faces in attempting to comprehend the data, is the fact that due to kinematic constraints that data is sparse, and each point shown pertains to a different pair of values of x and . We miss the luxury of having measurements at several different values of x for fixed values of , which would allow one to deduce the detailed behaviour of .
2 Results
We show that the Caldwell plot is in agreement with the pQCD expectations, once screening corrections (SC) (which become more important as one goes to lower values of x and ), are included. To provide a check of our calculations, we compare with the results one derives using the ALLM’97 parametrization [2], which we use as a ”pseudo data base”.
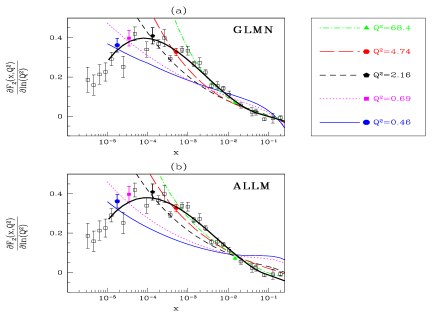
Following the method suggested by Levin and Ryskin [3] and Mueller [4] we calculate the SC pertaining to for both the quark and gluon sector. In fig.2 we show the results as well as those of ALLM compared with the experimental results.
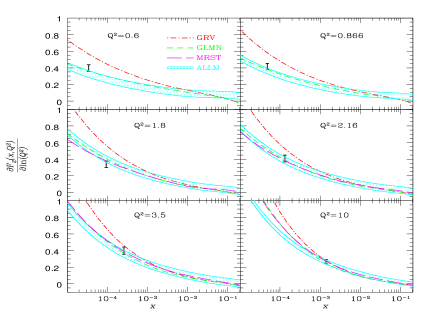
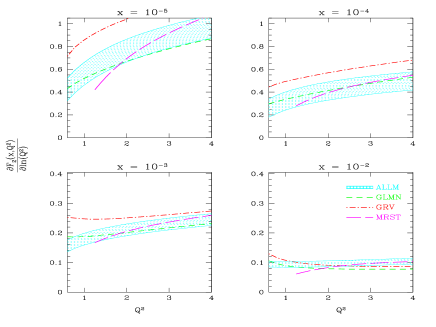
In fig.3 and 4 we display our calculations for the logarithmic derivative of after SC have been incorporated, as well as the ALLM results. In fig.3 for fixed values of and varying values of x, and in fig.4 for fixed x and varying values of . In fig.4 we show our results as well as those of ALLM compared with the experimental results. We note that at fixed both in our calculations and in the ”psuedo data” (ALLM), remains a increasing function of .
From fig.4 we note that for fixed x, decreases as becomes smaller. The decrease becomes stronger as we go to lower values of x. This phenomena which is due to SC adds to the confusion in interpreting the Cadwell plot.
3 Conclusions
1) We have obtained a good description of for x 0.1.
2) At low ,
both in the pseudo data and in our calculations.
3) Our results suggest that there is a smooth transition between the ”soft” and ”hard” processes.
4) The apparent turn over of is an illusion, created by the experimental limitation in measuring the logarithmic derivative of at particular correlated values of and x.
4 Acknowledgements
I would like to thank my friends and collegues Genya Levin and Uri Maor for an enjoyable and fruitful collaboration.
References
- [1] A. Caldwell, Invited talk, DESY Theory Workshop. DESY, October 1997.
- [2] H. Abramowicz and A. Levy, DESY 97-251, hep-ph/9712415.
- [3] E.M. Levin and M.G. Ryskin, Sov. J. Nucl. Phys. 45 (1987) 150.
- [4] A.H. Mueller, Nucl. Phys. B 335 (1990) 115.
- [5] E. Gotsman, E. Levin and U. Maor, Phys. Lett. B 425 (1998) 369.
- [6] E. Gotsman, E. Levin and U. Maor, Nucl. Phys. B 539 (1999) 535.