Error estimates for scattering threshold parameters in Chiral Perturbation Theory to two loops.111 Work supported by DGES PB98-1367 and by the Junta de Andalucía FQM0225.
J. Nieves222e-mail: jmnieves@ugr.es and E. Ruiz Arriola333e-mail:earriola@ugr.es
Departamento de Física Moderna, Universidad de Granada, E-18071 Granada, Spain.
(7 April, 2000)
Abstract
Using the analysis of ChPT to two loops, we perform an error analysis of the threshold and low energy parameters, based on the uncertainties for the one loop low energy parameters and the resonance saturation mechanism. Different sets of one loop low energy constants have been considered. Thus, the predictive power of the effective field theory, is quantified on the basis of the present experimental uncertainties.
PACS: 11.10.St;11.30.Rd; 11.80.Et; 13.75.Lb; 14.40.Cs; 14.40.Aq
Keywords: Chiral Perturbation Theory,-Scattering, Error analysis.
Chiral perturbation theory (ChPT) is the effective pion field theory where the expansion parameter is , with the pion mass and the weak pion decay constant. At some finite order an increasing number of undetermined parameters is generated which can, so far, only be fixed by experimental data. Besides the theoretical uncertainty introduced by the finite number of terms considered in the expansion, there is an additional experimentally induced uncertainty. The low energy parameters inherit such an uncertainty, thus limiting in practice the predictive power of the effective field theory; if the errors at a given order, say are larger than the contributions of the next order , the calculation of the latter becomes useless, unless more accurate experiments are performed.
To make our points quantitative, we consider scattering as the prototype reaction to study the role played by chiral symmetry breaking and the validity of the chiral expansion within QCD at low energies. The scattering lengths and effective ranges for the isospin have been computed in ChPT at tree level [1], one loop [2] and two loops [3, 4], in a power series expansion
| (1) | |||||
| (2) |
At tree level, the number of parameters involved are two: the pion weak decay constant MeV and the pion mass MeV. For the purposes of the present discussion the experimental error bars in these parameters can effectively be taken to be zero. At the one loop level one has four, in principle undetermined, parameters . At the two loop level the whole amplitude information can be gathered into six coefficients, which in Ref. [3, 4] have been called . Ideally, these parameters could be extracted from a direct low energy analysis of scattering experiments. The data are, however, too poor in the low energy region and several methods have been devised. Motivated by the success of the resonance saturation hypothesis at scales GeV, at the one loop level [5], the authors of Ref. [4] suggest to estimate the bulk of the two loop corrections through resonance saturation. This approach requires the values for the one loop ’s deduced from some clean source. In Ref. [4] two different sets of parameters have been considered: i) by taking the and parameters obtained from form factors using a dispersive one loop calculation for three flavors [6] (Set I in [4]), and ii) fixing and to the values deduced from wave scattering lengths, at order (Set II in [4]). Unfortunately, no error analysis has been undertaken in Ref. [4]. On the other hand, the estimates based on analysis, can now be improved thanks to a recent study of this process at two loop accuracy [7]. Other possibility is to extract the one loop low energy constants, together with their errors, from Roy sum rules, saturated by the high energy behavior of scattering [8]. In conjunction with resonance saturation, this procedure also yields an error analysis of threshold parameters [8].
An error analysis from the point of view of the predictive power of ChPT is missing, and it is the main subject of the present work. We assume that primary quantities, coming from a fit or direct experimental measurements, are Gauss distributed (with or without correlations), as we learn from elementary statistics. We propagate errors by means of Monte Carlo simulations, keeping always statistical correlations between all parameters entering in a given derived quantity. We use samples, and to quote errors we always use a 68% confidence level around the central value. Since the out-coming threshold parameters distributions are not gaussians, we take in this way into account possible skewness in the distributions. By using the Monte Carlo method we avoid summing errors in quadratures, which would be incorrect for statistically correlated quantities, and we do not have to use any complicated covariance formula.
Let and be the n-loop central value and error of an observable. Thus, to be predictive and convergent at the loop level one ought to have the relation,
| (3) |
In order to establish these necessary requirements from a quantitative point of view we will adopt the currently accepted scheme of assuming that resonance saturation yields the bulk of the two loop contribution at scales GeV. This induces a scale ambiguity in the two–loop part of the parameters, which we implement by providing the scale with an error,
| (4) |
Moreover, since one does not expect resonance saturation to be exact, we provide these parameters with uncertainty and take, in the notation of Ref. [4], the values
| (5) |
at the scale given in Eq. (4). In addition to these numbers, one needs estimates of the one loop low energy parameters . Through all this work we fix
| (6) |
as determined from the study of breaking effects and the scalar form factor in Refs. [2] and [9] respectively. There is less consensus regarding the values of and , therefore we consider three possibilities. We give below the central values, errors and linear correlation coefficients for and in each case, in order to characterize the full statistical distributions, deduced from different primary distributions, which will be used later to calculate threshold and low energy parameters.
-
•
Set I form factors: Ref. [7] allows to determine and from a two loop analysis of decays. The analysis is done in terms of the scale dependent low energy constants at the mass scale, MeV, and central values for and are given. The relation between the and low energy constants is known at one loop [10] and thus the determination of the and parameters in [7] suffers from two loop uncertainties. From the remarks of that work a strong anti–correlation between and can be inferred, although the corresponding correlation matrix is not given. We will take here two extreme view points, total de–correlation and total anti–correlation. As we will see, the totally anti–correlated case seems to induce smaller errors in the scattering lengths as compared to the totally de–correlated case. We will call these two choices Set Ia and Set Ib respectively. We will also examine here a partial anti–correlation scenario (Set Ic) which models more accurately the limited statistical information provided in Ref. [7]. More details are given in the Appendix.
For the three sets, we take , and (main fit in Table 1 of Ref. [7]). For Set Ia, we assume that the three statistical distributions are de–correlated, whereas for Set Ib [Set Ic] assume these are correlated as specified in Eq. (12) [ Eq. (13) with ]. By means of a Monte Carlo simulation we generate the statistical distributions for the and parameters, and thus we get
(7) (8) (9) being the linear correlation coefficient. The errors quoted above are clearly low bounds, because they do not account for any systematic effects, in particular those induced by the corrections to the relations between the two– and three–flavor low energy constants444Note that in the second entry of Ref. [7] there is an inconsistency. In Eq. (6.24) an error of for is quoted. That error is not compatible with having , as deduced from Eq. (6.23) of that reference, and an error for of . The previous formula gives an error for of and it is obviously independent of the possible correlations between the and parameters, because it only involves . This is in agreement with our results. The problem in Ref. [7] is that the error definition for the parameters, “projections on the relevant variable of the 68% confidence level domain”, is not consistent with that adopted for the parameters. For these latter ones, the standard and traditionally accepted errors are given. The method of the projections would lead to significantly different errors for , as can be appreciated from the figures shown in Ref. [7]. In anycase, this projection method is not standard. The standard and complete procedure consists of giving the full correlation matrix deduced from the fit. We ignore to what extent the errors on derived quantities given in Ref. [7] are affected by this inconsistency. . Estimates for the systematic errors are not given in Ref. [7] either. Notice that correlations among do not affect to the error in (see footnote 4).
-
•
Set II waves: The method of Ref. [4] allows to define another parameter set. If the wave scattering lengths for isospin and , and respectively, are fixed at the two loop level one gets parameter Set II,
(10) To obtain and and their errors, we have propagated the errors in , , , , and the resonance parameters of Eq. (5) in the formula for the wave scattering length given in Ref. [4]. This procedure generates a correlation between and which has to be taken into account when calculating errors in quantities depending on the previous parameters. Note that our central values for and numbers are not exactly the ones quoted in Ref. [4] since they take GeV. Furthermore, in Ref. [4] no error estimates are quoted for and . If we had taken , we would have obtained and , in agreement with their quoted central value.
-
•
Set III Roy sum rules: Finally, using the method of Roy sum rules, Ref. [8], another parameter set has been obtained. We call it Set III,
(11) Both central values and errors quoted above do not agree with those given in Eq. (21) of Ref. [8]. The difference on the central values is due to the fact that in this latter reference all resonance parameters are set to zero at 1 GeV (). To obtain the errors we have propagated the errors in the resonance saturation scale , , (parameters given in Eq. (2) of Ref. [8]), , and the resonance parameters of Eq. (5) when Eqs.(6-7) of Ref. [8] are inverted. This, again generates a correlation between and as in the previous cases555Errors differ from those quoted in Ref. [8], because of the different treatment considered here (error on the resonance saturation scale, different choice, both for central values and errors, for the resonance parameters but also because there is a numerical mistake in that work, which we correct here. The error analysis of Eqs. (16) and (17) of that work yields and , which errors do not agree with those quoted in Eq. (20) of that reference. . The , parameters suffer from sizeable systematic uncertainties. Those have been estimated in the second entry of Ref. [3] and turned out to be of comparable magnitude, when not bigger, than the statistical fluctuations, and as a consequence statistical correlations get washed out. This justifies the use of de–correlated distributions for these two parameters both in Ref. [8] and in the present work.


The determination of the one loop parameters, their corresponding uncertainties as well as their mutual correlation can be best seen by plotting the resulting two-dimensional Monte Carlo generated distributions for all considered sets. This is done in Fig. 1. For all sets we consider a sufficiently large sample, , and have checked numerical stability by doubling the sample size. We also plot the confidence limit contours, i.e., inside these boundaries of distribution points are enclosed. For a better comparison we have also superposed (bottom panel) the confidence limit contours to check for statistical compatibility. As could already be anticipated, the main difference between parameter Sets Ia, Ic and Ib (corresponding to decays) is that the errors decrease as the anti–correlation increases. The parameter Set II provides the largest uncertainties, and large overlap with the remaining sets is encountered. At the same time, it is clear that there is a trend to discrepancy between parameter Sets Ic and III, since very little overlap is observed between both distributions. We should also mention that the level of uncertainty regarding both the and the Roy sum rules determinations is comparable, although the latter method seems to be slightly more accurate.
In Ref. [4] the calculation of the two loop contributions to the threshold parameters was undertaken and explicit expressions for scattering lengths and ranges were written, in terms of the low energy constants, . In this note we complete their numerical calculation by providing their numbers with the inherited error-bars and also exploring different parameter sets. This is shown in Table 1 (for the parameters) and in Table 2 (for the threshold parameters, ).
For all sets, we have generated statistical distributions both in the one loop and the two loop corrections to the scattering lengths and effective ranges by propagating the statistical distributions in the low energy parameters , the resonance parameters and the scale disccused above. The uncertainty in the scale and in the resonance contributions, affect to the error of the two loop corrections only. Errors in the two loop contributions are correlated with those in the one loop contributions. Therefore, the error of the sum cannot be obtained by simply adding the errors in quadrature of one and two loop contributions. In any case, for the two loop calculation to be numerically meaningful these one loop uncertainties have to be significantly smaller than the corrections due to the two loop calculation. At the same time the two loop correction has to be significantly smaller than the one loop correction, for a convergent expansion.
As we see in Table 1, all predictions for the parameters are compatible within errors. Moreover, as one might have inferred from the values and distributions of the parameters and the increasing accuracy of the determinations correspond to Sets II, Ia, Ic, Ib and III, in that order666These two latter parameter sets have similar accuracy.. Besides, we would like to point out that for the Sets Ia,Ib and Ic the statistical fluctuations in the one loop parameters induce errors on the parameters as important, when no more as in the de–correlated case of Set Ia, as the scale uncertainty quoted in Ref. [4]. For the parameter Set II the central values of the parameters are slightly different than those in Ref. [4] because the central and values are also different. The errors for the parameter Set II are much larger than those found for parameter Sets I and III. The size of the errors for Set II is comparable with the ones for found in Ref. [3]777 Regarding the parameter Set III, one should say that if one would calculate the ’s from Eq. (48) of Ref. [3], with the numerical input of Eq.(2) of Ref. [8], one would have obtained are in agreement with Eq.(49) of Ref. [3]. We see that this is not the same as evaluating the ’s in the spirit of resonance saturation (Eqs. D.1,D.2 and D.3 of second entry in Ref. [4]) from previously computed values of and , through their relation to and parameters, as suggested in Ref [8] and adopted in this work. In any case, the values given above and those corresponding to Set III in Table 1 are compatible within statistical fluctuations..
| Set Ia | Set Ib | Set Ic | Set II | Set III | |
|---|---|---|---|---|---|
| Set | ||||||
|---|---|---|---|---|---|---|
| Ia | ||||||
| Ib | ||||||
| Ic | ||||||
| II | ||||||
| III | ||||||
| Ia | ||||||
| Ib | ||||||
| Ic | ||||||
| II | ||||||
| III | ||||||
| Ia | ||||||
| Ib | ||||||
| Ic | ||||||
| II | ||||||
| III | ||||||
| Ia | ||||||
| Ib | ||||||
| Ic | ||||||
| II | ||||||
| III | ||||||
| Ia | ||||||
| Ib | ||||||
| Ic | ||||||
| II | ||||||
| III | ||||||
| Ia | ||||||
| Ib | ||||||
| Ic | ||||||
| II | ||||||
| III | ||||||
| Ia | ||||||
| Ib | ||||||
| Ic | ||||||
| II | ||||||
| III | ||||||
| Ia | ||||||
| Ib | ||||||
| Ic | ||||||
| II | ||||||
| III |
As we see in Table 2, results for , and with parameter Set Ia are such that the one loop errors are larger than the central values of the two loop contribution. The inclusion of statistical correlations, Sets Ib and Ic, increases the accuracy of the predictions, though it still happens that errors on the one loop contribution make irrelevant the two loop one. The situation worsens dramatically, for parameter Set II where we see that in most considered cases predictive power is lost beyond one loop, with the exception of the wave scattering lengths and . Set III, obtained from the Roy-sum rule analysis of Ref, [8], turns out to be as predictive as Sets Ib and Ic, obtained from the two-loop improved analysis of Ref. [7]. In any case is also true that for , and within Set III the one loop uncertainties are larger than the two loop contribution. The results of the table are compatible, for all parameter sets with the experimental analysis of scattering data [11] but produce in general much better errors despite of the problems discussed above on the relevance of the two loop contributions. The early work on form factors using a dispersive one loop calculation for three flavors [6], predicted a isoscalar wave three standard deviations above the value extracted from the experiment [8], the upgrade of this calculation to two loop accuracy in Ref. [7] have contributed to considerably improve such a discrepancy.
In Fig. 2 we exhibit the Monte Carlo propagated two dimensional distributions of the -wave scattering lengths, for isospin channels and , for all parameter sets and in terms of the confidence limit contours. It is interesting to compare this distributions with the preliminary results of Ref. [12], based on the detailed numerical analysis of Roy equations in scattering. Such an analysis implies the existence of a universal band, outside which no solution to Roy equations exists, as a mathematical consequence of analyticity, crossing, unitarity and isospin conservation. In addition to this, the physical requirement of describing the available experimental data, provides a confidence limit contour [12]. As can be seen in the figure, with all parameter sets considered in this work, the two-loop ChPT analysis are not only compatible with the confidence limit contour of Ref. [12] but have significant smaller statistical fluctuations.


In summary, effective field theories like Chiral Perturbation Theory have predictive power, but it is not unlimited because of three reasons: 1) truncation of the expansion, 2) proliferation of undetermined constants at any order and 3) experimental uncertainties. Thus, experimental data prove crucial to determine the, increasing with the order, unknown constants and their errors, which propagate in a correlated way to higher orders in the expansion possibly undermining the “convergence” of the expansion. This situation also appears in fundamental theories like QED or QCD, but it is in fact worse in ChPT because the number of unknown parameters in these theories does not increase with the order of the expansion. This why error analysis is so important. We have exemplified our points in the calculation of the threshold parameters for scattering up to two loops. The general picture provided by ChPT is rather satisfactory, in the sense that the accuracy of the predictions is much bigger than the available data 888Right plot of Fig.2 constitutes a clear example.. Nevertheless we find cases where, within the present experimental accuracy, the errors in the one loop contribution are larger than the central values of the two loop contribution. Conclusions regarding the loss of predictive power, can only be reinforced if systematic uncertainties induced by the the corrections to the relations between the two– and three–flavor low energy constants are included in the results of Ref. [7]. The effect of these systematic corrections will be twofold: a general increase of the error fluctuations and a decrease of the correlations. Both effects will contribute to increase the errors on all derived threshold and low energy parameters presented in this work and deduced from decays.
ChPT defines a whole family of effective theories, but obviously the most interesting choice exactly corresponds to low energy QCD. In QCD with two flavors and neglecting isospin breaking there appear only two independent parameters, and the quark mass . The quantities , , the ’s, the ’s and higher order parameters must be functions of them. This dependence introduces correlations among all low energy parameters which, if taken into account, would influence the present error analysis, and presumably might yield to more moderate errors in terms of and and their errors. Assuming more statistically independent parameters than QCD suggests is, so far, another manifestation of the inability to undertake a quantitative and microscopic derivation of ChPT as an effective low energy theory of QCD on the one hand, but on the other hand reassures ChPT as a convenient tool to deal with non-perturbative phenomena in strong interactions.
Appendix: Modeling statistical correlations in decays.
In Ref. [7] is stated that is strongly anti–correlated with and , though central values and errors for these parameters are given (, and , main fit in Table 1 of Ref. [7]), however the correlation matrix is not provided. Besides, new parameters , and are introduced, it is quoted the value and it is also specified that is little correlated with and . We will show below how statistical modeling and the fragmentary information given in Ref. [7] can be used to reconstruct some relevant information on the correlations between and . To be most objective, we also explore two other extreme cases which correspond to total de–correlation and total anti–correlation. This said, we explore three different scenarios in this work:
-
•
A total de–correlated picture (, being the linear correlation coefficient). It leads to , and .
-
•
A total anti–correlation scenario () which can be implemented by simply assuming a linear relation
(12) That is the necessary and sufficient condition for total anti–correlation. Besides, one also has . This simple model leads to and . Thus, the total anti–correlation scenario, though simple, provides an acceptable description, and in any case much more precise than when correlations between , and are neglected, of the findings of Ref. [7].
-
•
A partial anti–correlation scenario which can be implemented if one assumes that , and are gaussian distributed999This is totally justified, because in Ref. [7] these variables have been determined from a fit. according to
(13) where is the join density probability distribution of the three random variables, is the error, is a column matrix with elements , being the central value of the variable , and finally the inverse of the symmetric matrix is given by
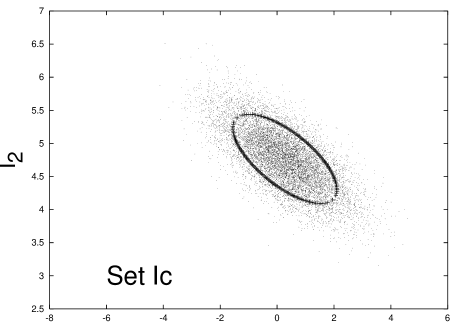
(14) and therefore it is determined by the linear correlation coefficients . Our aim is to improve the total anti–correlated scenario presented in the item above but keeping the model still as simple as possible. Thus we have explored situations where , for which one can analytically diagonalize the matrix in Eq. (13). We find for , still a strong anti–correlation, , and . Thus, this model for the correlations reproduces pretty much the results given in the analysis of Ref. [7]. This can also be appreciated in Fig. 3 where we show the resulting two dimensional distributions of the low energy parameters and . These distributions compare reasonably well with those given in Fig.2 of the first entry of Ref. [7]. This makes us more confident on the validity of the simple statistical model used here.


Figure 3: Two dimensional distributions of the low energy parameters and . generated via Monte Carlo simulation with samples. The contours represent the confidence limit, i.e., inside them the of the samples are enclosed.
The correlations between , and are transported through the equations relating and low energy constants. For the total anti–correlated scenario leads to a total anti–correlation for and , it is to say and therefore . For the total de–correlated case the correlation coefficient is zero, whereas for the partial correlation scenario we get .
References
- [1] S. Weinberg, Phys. Rev. Lett 17 (1966) 616,
- [2] J. Gasser and H. Leutwyler, Ann. Phys. (N.Y.) 158 (1984) 142.
- [3] M. Knecht, B. Moussallam, J. Stern and N.H. Fuchs, Nucl. Phys. B457 (1995)513; ibidem B471 (1996)445;
- [4] J. Bijnens, G. Colangelo, G. Ecker, J. Gasser and M.E. Sainio, Phys. Lett. B374 (1996) 210; ibidem Nucl. Phys. B508 (1997) 263.
- [5] G. Ecker, J. Gasser, A. Pich and E. de Rafael, Nucl. Phys. B321 (1989) 311.
- [6] J. Bijnens, G. Colangelo and J. Gasser, Nucl. Phys. B 427 (1994) 427.
- [7] G. Amoros, J. Bijnens and P. Talavera, hep-ph/9912398; ibidem hep-ph/0003258.
- [8] L. Girlanda, M. Knecht, B. Moussallam an J. Stern, Phys. Lett. B 409 (1997) 461.
- [9] J. Bijnens, G. Colangelo and P. Talavera, JHEP 9805 (1998) 014.
- [10] J. Gasser and H. Leutwyler, Nucl. Phys. B250 (1985) 465.
- [11] O. Dumbrajs et al., Nucl. Phys. B 216 (1983) 277.
- [12] G. Colangelo, hep-ph/0001256.