11institutetext: Institut für Kernphysik, Forschungszentrum Jülich, 52425 Jülich, Germany 22institutetext: High Energy Physics Department, Petersburg Nuclear Physics Institute, 188350 Gatchina, Russia 33institutetext: Institute of Physics, Jagellonian University, Reymonta 4,30059 Cracow, Poland 44institutetext: Institut für Kernphysik, Universität zu Köln, Zülpicher Str. 77, 50937 Köln, Germany 55institutetext: Institut für Kernphysik, Universität Münster, W.-Klemm-Str. 9, 48149 Münster, Germany 66institutetext: Institut für Hadronen- und Kernphysik, Forschungszentrum Rossendorf, D-01474 Dresden

Inclusive K+-meson production in proton-nucleus interactions

M. Büscher m.buescher@fz-juelich.de11    V. Koptev 22    M. Nekipelov 1122    Z. Rudy 33    H. Ströher 11    Yu. Valdau 1122    S. Barsov 22    M. Hartmann 11    V. Hejny 11    V. Kleber 44    N. Lang 55    I. Lehmann Present address: Department of Radiation Sciences, University of Uppsala, Box 535, S-75121 Uppsala, Sweden1166    S. Mikirtychiants 22    H. Ohm 11
(Received: date / Revised version: date)
Abstract

The production of K+superscript𝐾K^{+}-mesons in pA𝑝𝐴pA (A=𝐴absentA= D, C, Cu, Ag, Au) collisions has been investigated at the COoler SYnchrotron COSY-Jülich for beam energies Tp=1.02.3subscript𝑇𝑝1.02.3T_{p}=1.0-2.3 GeV. Double differential inclusive p𝑝p\,C cross sections at forward angles ϑK+<12subscriptitalic-ϑsuperscript𝐾superscript12\vartheta_{K^{+}}<12^{\circ} as well as the target-mass dependence of the K+superscript𝐾K^{+}-momentum spectra have been measured with the ANKE spectrometer. Far below the free NN𝑁𝑁NN threshold at TNN=1.58subscript𝑇𝑁𝑁1.58T_{NN}=1.58 GeV the spectra reveal a high degree of collectivity in the target nucleus. From the target-mass dependence of the cross sections at higher energies, the repulsive in-medium potential of K+superscript𝐾K^{+}-mesons can be deduced. Using pN𝑝𝑁pN cross-section parameterisations from literature and our measured p𝑝p\,D data we derive a cross-section ratio of σ(pnK+X)/σ(ppK+X)(34)similar-to𝜎𝑝𝑛superscript𝐾𝑋𝜎𝑝𝑝superscript𝐾𝑋34\sigma(pn\to K^{+}X)/\sigma(pp\to K^{+}X)\sim(3-4).

pacs:
13.75.-nHadron-induced low- and intermediate-energy reactions and scattering and 25.40.-hNucleon-induced reactions and scattering

1 Overview

One important topic of contemporary hadron physics is the investigation of the influence of the nuclear medium on the properties of hadrons and their production processes. Such phenomena can, for example, be studied in detail by measuring meson production in proton-nucleus collisions. If the measurements are carried out at projectile energies below the threshold for free nucleon-nucleon (NN𝑁𝑁NN) collisions (so-called subthreshold production) these processes necessarily imply collective effects involving several of the nucleons inside the target nucleus. K+superscript𝐾K^{+}-production is particularly well suited for such investigations since this meson is heavy compared to the pion, so that its production requires strong medium effects. As a consequence, the production of K+superscript𝐾K^{+}-mesons in proton-nucleus collisions is an appropriate tool to learn either about cooperative nuclear phenomena or high momentum components in the nuclear many-body wave function.

In this paper we present data obtained at the ANKE spectrometer ANKE_NIM of COSY-Jülich on inclusive K+superscript𝐾K^{+} production with various targets and over a wide range of beam energies, see Sects. 3 and 5. A simple parameterisation, in terms of a few Lorentz-invariant variables, is presented in Sect. 4 which allows us to compare our data, measured at near-forward angles ϑ<12italic-ϑsuperscript12\vartheta<12^{\circ}, with those obtained in other experiments under different kinematical conditions. It is shown that the data at the lowest beam energy Tp=1.0subscript𝑇𝑝1.0T_{p}=1.0 GeV ANKE_1.0GeV , reveal a large collective behaviour of the target nucleons. Either large intrinsic momenta of the nucleons must be involved in the K+superscript𝐾K^{+}-formation processes or the number of participating nucleons must be significantly larger than one. The latter could, for example, be due to multi-step processes. At the higher energies, Tp2.0subscript𝑇𝑝2.0T_{p}\geq 2.0 GeV, our data suggest that direct kaon production on single nucleons prevails.

Final state interactions (FSI) can mask the information about the production mechanisms. However, due to the strangeness content of the K+superscript𝐾K^{+}-meson (S=+1𝑆1S=+1), FSI effects are generally considered to be rather small. As a consequence the mean free path of K+superscript𝐾K^{+}-mesons at normal nuclear density ρ0subscript𝜌0\rho_{0} is as large as 6similar-toabsent6\sim 6 fm. In a previous publication PLB we have shown that the low momentum part of the K+superscript𝐾K^{+}-spectrum is sensitive to the Coulomb and the in-medium repulsive nuclear potential. In Sect. 3.2 we compare the data from ANKE with model calculations using a CBUU transport code wolf ; rudy . The comparison allows for a determination of the K+superscript𝐾K^{+}-potential at normal nuclear density.

Experimental data on the K+superscript𝐾K^{+}-production cross section from proton-neutron (pn𝑝𝑛pn) interactions in the close-to-threshold regime are not yet available. This quantity is crucial, for example, for the theoretical description of proton-nucleus (pA𝑝𝐴pA) and nucleus-nucleus (AA𝐴𝐴AA) data. Predictions for the ratio of the proton-induced production cross sections on neutrons (σnsubscript𝜎𝑛\sigma_{n}) and protons (σpsubscript𝜎𝑝\sigma_{p}), Rnp=σn/σpsubscript𝑅𝑛𝑝subscript𝜎𝑛subscript𝜎𝑝R_{np}=\sigma_{n}/\sigma_{p}, range from unity to a factor of six, depending on the underlying model assumptions. In Ref. Piroue it was proposed that there should be no difference between K+superscript𝐾K^{+} production on the neutron and proton, whereas isospin-based models yield Rnp2similar-tosubscript𝑅𝑛𝑝2R_{np}\sim 2 Tsushima . The authors of Ref. Wilkin draw an analogy between K+superscript𝐾K^{+}- and η𝜂\eta-meson production and predict Rnp6similar-tosubscript𝑅𝑛𝑝6R_{np}\sim 6. In Sect. 5 we present inclusive ANKE data for K+superscript𝐾K^{+} production in p𝑝p\,D reactions. Based on a simple phase-space estimate we conclude that the total K+superscript𝐾K^{+}-production cross section on neutrons is significantly larger than that on protons.

2 𝑲+superscript𝑲K^{+} identification with ANKE and determination of absolute cross sections

2.1 The ANKE spectrometer and 𝑲+superscript𝑲K^{+} detectors

The COoler SYnchrotron COSY-Jülich cosy , which provides proton beams in the range Tp=0.042.88subscript𝑇𝑝0.042.88T_{p}=0.04-2.88 GeV, is well suited for the study of K+superscript𝐾K^{+}-meson production in pp𝑝𝑝pp and pA𝑝𝐴pA reactions. In measurements with very thin windowless internal targets, secondary processes of the produced mesons can be neglected and, simultaneously, sufficiently high luminosities are obtained. Foil or cluster-jet targets have been used at ANKE, providing effective luminosities of 1032cm2s1greater-than-or-equivalent-tosuperscript1032superscriptcm2superscripts1\mathcal{L}\gtrsim 10^{32}\,\mathrm{cm^{-2}s^{-1}} and 1031cm2s1greater-than-or-equivalent-tosuperscript1031superscriptcm2superscripts1\mathcal{L}\gtrsim 10^{31}\,\mathrm{cm^{-2}s^{-1}}, respectively. For the foil-target measurements, the COSY beam with an intensity of (24)×101024superscript1010(2-4)\times 10^{10} protons is accelerated to the desired energy on an orbit below the target (in order to avoid unwanted beam-target interactions and beam losses during acceleration) ANKE_NIM . These targets are strips of C, Cu, Ag or Au with thicknesses of (40–1500)μ𝜇\,\mug/cm2. After acceleration the beam is slowly steered upward onto the target over a period of approximately 50 s, keeping the trigger rate in the detectors nearly constant at (1000–1500) s-1, a level that can be handled by the data acquisition system with dead time corrections of less than 25%. For the study of p𝑝p\,D interactions, a deuterium cluster-jet target clustertarget has been used, providing areal densities of up to 5×10¹⁴similar-toabsent5superscript1014\sim 5\times 10^{14} cm-2. Due to the lower target density, the cycle times were here typically in the range of 5–30 minutes, and the rate load on the detectors was smaller than in the case of the solid targets.

When using the deuterium cluster-jet target at ANKE, the luminosity can be measured with a telescope consisting of three silicon counters with thicknesses of respectively 60μ𝜇\,\mum, 300μ𝜇\,\mum, and 5 mm Spectator . These so called “spectator” counters are located within the vacuum pipe of the accelerator a few centimetres to the side of the circulating proton beam, see Fig. 1. They cover polar angles in the range 83104superscript83superscript10483^{\circ}-104^{\circ} and ±7plus-or-minussuperscript7\pm 7^{\circ} in azimuth. The ability to identify a deuteron and measure its kinetic energy in the telescope allows one to determine the luminosity by measuring proton-deuteron elastic scattering in parallel to kaon production. Such a “direct” luminosity measurement is not possible with the foil targets since the differential cross sections for the emission of spallation products are not known with sufficient accuracy. Therefore, a different procedure has been developed where the measured K+superscript𝐾K^{+} yields from the carbon target are normalised to pion cross sections from literature, see Sect. 2.2. A major advantage of this method is that only the ratios of luminosities π+/K+subscriptsuperscript𝜋subscriptsuperscript𝐾\mathcal{L}_{\pi^{+}}/\mathcal{L}_{K^{+}} during π+superscript𝜋\pi^{+} calibration and K+superscript𝐾K^{+} data-taking runs has to be determined, which reduces systematic uncertainties.
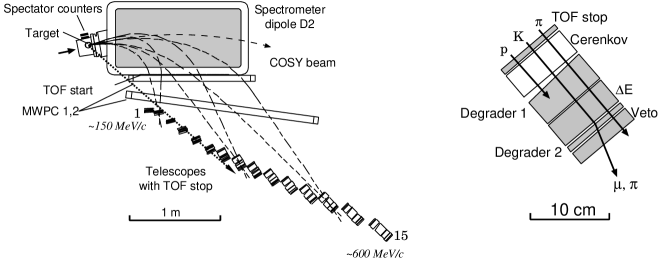
Refer to caption
Figure 1: Layout of ANKE and the K+superscript𝐾K^{+}-detection system. The two MWPCs provide tracking and momentum reconstruction of the ejectiles. K+superscript𝐾K^{+}-identification is achieved with the help of time-of-flight (TOF) and energy-loss measurements in the 15 range telescopes K_NIM . The momentum range covered by the telescopes is indicated for the maximum field strength in D2 of B=1.57𝐵1.57B=1.57 T. The dashed lines depict trajectories of particles with low/medium/high momenta and horizontal emission angles of ±10plus-or-minussuperscript10\pm 10^{\circ} at the target. The dotted line sketches the trajectory of particles bypassing D2 and hitting stop counters 2–5, which are used for luminosity monitoring. Also indicated is the location of the target-near spectator counters for luminosity monitoring together with the cluster target. On the right hand side a schematic top view of one telescope is presented.

Subthreshold K+superscript𝐾K^{+}-production was one of the primary motivations for building the large-acceptance ANKE spectrometer ANKE_NIM . This facility consists of three dipole magnets, which separate forward-emitted reaction products from the circulating proton beam and allow one to determine their emission angles and momenta. Depending on the choice of the magnetic field in the spectrometer dipole D2 (see Fig. 1), K+superscript𝐾K^{+}-mesons in the momentum range pK150600similar-tosubscript𝑝𝐾150600p_{K}\sim 150-600 MeV/c can be detected. The angular acceptance for these momenta is ±12plus-or-minussuperscript12\pm 12^{\circ} horizontally and up to ±7plus-or-minussuperscript7\pm 7^{\circ} vertically.

The layout of ANKE, including detectors and the data-acquisition system, has been optimised to study K+superscript𝐾K^{+} spectra at beam energies down to Tp1.0similar-tosubscript𝑇𝑝1.0T_{p}\sim 1.0 GeV ANKE_1.0GeV ; K_NIM . This is a very challenging task because of the smallness of the K+superscript𝐾K^{+}-production cross sections, e.g. 39 nb for p𝑝p\,C collisions at 1.0 GeV pnpi . The ANKE detection system for K+superscript𝐾K^{+} mesons, located along the side of D2, permits kaon identification in a background of pions, protons and scattered particles up to 106superscript10610^{6} times more intense. For the identification of the K+superscript𝐾K^{+}-mesons the following criteria are used:

  • ANKE provides horizontal momentum focusing of the ejectiles. This is used to define the K+superscript𝐾K^{+}-momenta in 15 telescopes which are located along the focal surface of the spectrometer dipole D2. The momentum ranges covered by each telescope, given in the left columns of Tables 4 and 8 in the Appendix, are determined by their widths (10 cm) and the dispersion of D2.

  • A fast on-line trigger system, based on start- and stop detectors of a time-of-flight setup, allows for the selection of individual start-stop combinations and thus of particles with certain momenta and emission angles at the target. Narrow time-of-flight (TOF) gates can be defined for the identification of pions, kaons and protons, respectively. 23 TOF-start counters are located close to the exit window of the D2 vacuum chamber in order to maximise the distance to 15 TOF-stop counters which are the foremost ones in the telescopes (see Fig. 1).

  • The range telescopes discriminate pions, kaons and protons with the same momenta due to their different energy losses. Passive copper degraders in the telescopes between the scintillation counters enhance the discrimination efficiency.

  • The K+superscript𝐾K^{+}-mesons are stopped in the ΔEΔ𝐸\Delta E counters or in the second degrader of each telescope. Their decay mainly into μ+νμsuperscript𝜇subscript𝜈𝜇\mu^{+}\nu_{\mu} and π+π0superscript𝜋superscript𝜋0\pi^{+}\pi^{0} with a lifetime of τ=12.4𝜏12.4\tau=12.4 ns provides a very effective criterion for kaon identification via the detection of delayed signals in a so-called veto counter (with respect to prompt signals from e.g. a π+superscript𝜋\pi^{+} produced in the target punching through all counters of a telescope).

  • The tracks of the ejectiles are measured with two multi-wire proportional chambers (MWPCs). From this information the emission angles at the target are deduced and a suppression of background not originating from the target is possible.

For further details of the K+superscript𝐾K^{+} identification procedures, we refer to an earlier publication K_NIM .

The production of K+superscript𝐾K^{+}-mesons has been studied with ANKE at beam energies Tp=1.0, 1.2, 1.5, 2.0subscript𝑇𝑝1.01.21.52.0T_{p}=1.0,\,1.2,\,1.5,\,2.0 and 2.3 GeV for C, Cu, Ag and Au targets. Two different settings of the magnetic field in D2 were used: B=1.3𝐵1.3B=1.3 T (“1.3 T mode”) for Tp=1.0, 1.2, 2.0subscript𝑇𝑝1.01.22.0T_{p}=1.0,\,1.2,\,2.0 and 2.3 GeV, and B=1.57𝐵1.57B=1.57 T (“1.6 T mode”) for Tp=1.2, 1.5subscript𝑇𝑝1.21.5T_{p}=1.2,\,1.5 and 2.3 GeV. With these two modes of operation different regions of the kaon-momentum spectra can be explored. For example, the lower D2 magnetic field of B=1.3𝐵1.3B=1.3 T is sufficient to measure the complete kaon momentum spectrum at Tp=1.0subscript𝑇𝑝1.0T_{p}=1.0 GeV, whereas with the 1.6 T mode larger kaon momenta are accessible, which is advantageous at higher beam energies. The geometry of the experimental setup as well as the K+superscript𝐾K^{+}-identification procedures is identical for the two field values, though different methods for the normalisation to pion cross sections have been applied. The K+superscript𝐾K^{+} spectra from p𝑝p\,D interactions have been obtained at Tp=2.02subscript𝑇𝑝2.02T_{p}=2.02 GeV using the 1.6 T mode, and for Tp=1.83subscript𝑇𝑝1.83T_{p}=1.83 GeV at an intermediate field strength (“1.45 T mode”).

2.2 Normalisation of the 𝒑𝐂𝑲+𝑿bold-→𝒑𝐂superscript𝑲𝑿p\mathrm{C}\to K^{+}X cross sections

When using foil targets at ANKE, absolutely normalised kaon cross sections are deduced from the number of identified kaons NK+isuperscriptsubscript𝑁superscript𝐾𝑖N_{K^{+}}^{i} in each telescope i𝑖i (with mean momenta pisuperscript𝑝𝑖p^{i}), using differential π+superscript𝜋\pi^{+} cross sections from literature measured under similar kinematical conditions.

The detection and identification of π+superscript𝜋\pi^{+}-mesons, which have been measured in different runs with dedicated trigger conditions, in the ANKE detectors is rather simple and the analysis procedures are straightforward. Since the pions can be identified by TOF and energy-loss in the stop counters alone, the pion detection efficiency is given by

ϵπ+i=ϵπ+TOF(i)ϵπ+MWPC(i)ϵπ+decaysuperscriptsubscriptitalic-ϵsuperscript𝜋𝑖subscriptsuperscriptitalic-ϵTOF𝑖superscript𝜋subscriptsuperscriptitalic-ϵMWPC𝑖superscript𝜋subscriptsuperscriptitalic-ϵdecaysuperscript𝜋\epsilon_{\pi^{+}}^{i}=\epsilon^{\mathrm{TOF}(i)}_{\pi^{+}}\cdot\epsilon^{\mathrm{MWPC}(i)}_{\pi^{+}}\cdot\epsilon^{\mathrm{decay}}_{\pi^{+}} (1)

The efficiency of the TOF-ΔEΔ𝐸\Delta E criterion for pions is large, ϵπ+TOF(i)98subscriptsuperscriptitalic-ϵTOF𝑖superscript𝜋98\epsilon^{\mathrm{TOF}(i)}_{\pi^{+}}\geq 98K_NIM . The MWPC efficiencies ϵπ+MWPC(i)subscriptsuperscriptitalic-ϵMWPC𝑖superscript𝜋\epsilon^{\mathrm{MWPC}(i)}_{\pi^{+}} have been measured for each beam energy and are larger than 95%. The decay probabilities between target and stop counters were obtained from simulation calculations.

The differential cross sections for π+superscript𝜋\pi^{+}-production in p𝑝p\,C interactions have been taken from Refs. abaev ; papp . The π+superscript𝜋\pi^{+}-momentum spectrum has been measured at Tp=1.0subscript𝑇𝑝1.0T_{p}=1.0 GeV for ϑπ+=0subscriptitalic-ϑsuperscript𝜋superscript0\vartheta_{\pi^{+}}=0^{\circ} at the Petersburg Nuclear Physics Institute (PNPI) abaev . At higher beam energies only the production cross sections at a fixed pion momentum of pπ=500subscript𝑝𝜋500p_{\pi}=500 MeV/c and ϑπ=2.5subscriptitalic-ϑ𝜋superscript2.5\vartheta_{\pi}=2.5^{\circ} are known from an experiment at the Lawrence Berkeley Laboratory (LBL) for Tp=1.05, 1.73, 2.1subscript𝑇𝑝1.051.732.1T_{p}=1.05,\,1.73,\,2.1 and 4.2 GeV, both for positively and negatively charged pions papp . The results of the two experiments have to be combined before they can be used for the normalisation of the ANKE data. Additional values for the π+superscript𝜋\pi^{+}-production cross section at Tp=2.66subscript𝑇𝑝2.66T_{p}=2.66 and 3.5 GeV can be calculated when cross sections of πsuperscript𝜋\pi^{-}-production, which have been measured at LBL also for these intermediate energies papp , are included into the analysis.

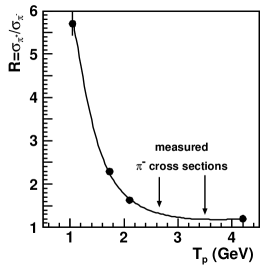
The ratios of the differential pion cross sections R=σπ+/σπ𝑅subscript𝜎superscript𝜋subscript𝜎superscript𝜋R=\sigma_{\pi^{+}}/\sigma_{\pi^{-}} calculated from the LBL data papp for Tp=1.05, 1.73, 2.1subscript𝑇𝑝1.051.732.1T_{p}=1.05,\,1.73,\,2.1 and 4.2 GeV are shown in Fig. 2 (upper). When fitting these ratios by a polynomial, only the statistical errors of the data have been taken into account in order to avoid double counting the systematic errors, which are considered later. The resulting interpolated values of R𝑅R at Tp=2.66subscript𝑇𝑝2.66T_{p}=2.66 and 3.5 GeV together with the πsuperscript𝜋\pi^{-}-production cross sections from Ref. papp , can then be used to derive the π+superscript𝜋\pi^{+} cross sections at these energies. This gives d2σπ+/dΩdp=(41.8±1.2)superscriptd2subscript𝜎superscript𝜋dΩd𝑝plus-or-minus41.81.2\mathrm{d}^{2}\sigma_{\pi^{+}}/\mathrm{d}\Omega\mathrm{d}p=(41.8\pm 1.2) and (59.8±1.2)μb/(srMeV/c)plus-or-minus59.81.2𝜇bsrMeVc(59.8\pm 1.2)\,\mathrm{\mu b/(sr\,MeV/c)} at Tp=2.66subscript𝑇𝑝2.66T_{p}=2.66 and 3.5 GeV, respectively.

Refer to caption
Refer to caption
Refer to caption
Figure 2: Upper: Ratio of pion-production cross sections R=σπ+/σπ𝑅subscript𝜎superscript𝜋subscript𝜎superscript𝜋R=\sigma_{\pi^{+}}/\sigma_{\pi^{-}} for pCπ±X𝑝𝐶superscript𝜋plus-or-minus𝑋pC\to\pi^{\pm}X reactions at pπ=500subscript𝑝𝜋500p_{\pi}=500 MeV/c as a function of the beam energy. The solid dots represent the calculated ratios using π+superscript𝜋\pi^{+} and πsuperscript𝜋\pi^{-} cross sections from Ref. papp . The solid line is a polynomial fit to these points. The energies where only πsuperscript𝜋\pi^{-} cross sections are available papp are indicated. Middle: π+superscript𝜋\pi^{+}-production cross sections at pπsubscript𝑝𝜋p_{\pi}=500 MeV/c. Upwards pointing triangles denote the data from Ref. abaev , downwards represent the data from Ref. papp . Lower: Averaged π+superscript𝜋\pi^{+}-production cross sections as a function of beam energy. The curve shows the result of the fit with second order polynomial. See text for definition of the error bars.

The combined cross sections for π+superscript𝜋\pi^{+} production are shown in Fig. 2 (middle). In Ref. abaev a total systematic uncertainty of 6% is given, while the authors of Ref. papp indicate an overall systematic uncertainty of 20% and a relative systematic uncertainty between the individual data points of similar-to\sim10%. The mean value of the PNPI and LBL cross sections at Tp=1.0subscript𝑇𝑝1.0T_{p}=1.0 GeV of (76.9±4.6)μb/(srMeV/c)plus-or-minus76.94.6𝜇bsrMeVc(76.9\pm 4.6)\,\mathrm{\mu b/(sr\,MeV/c)} shown in Fig. 2 (lower) has been calculated according to the averaging method from PDG Particle for results of different experiments (i.e. for averaging and fitting the statistical and systematic errors are added in quadrature and this combined error is used later on). The cross sections from Ref. papp for Tp=1.05, 1.73, 2.1, 2.66, 3.5subscript𝑇𝑝1.051.732.12.663.5T_{p}=1.05,\,1.73,\,2.1,\,2.66,\,3.5 and 4.2 GeV have been scaled up in order to match the averaged value at Tp=1.0subscript𝑇𝑝1.0T_{p}=1.0 GeV (Fig. 2 (lower)). The total error of these points is the quadratic sum of the above mentioned relative systematic uncertainty and the error of the scaling factor.

In order to determine the π+superscript𝜋\pi^{+} cross section at any intermediate energy, the data have been fitted by a second-order polynomial. The error of the fit has to take into account a complete error matrix since the systematic uncertainties of the data are the main source of the errors. The result of this fitting procedure is presented in Fig. 2 (lower) and Table 1.

Table 1: π+superscript𝜋\pi^{+}-production cross sections for pπ+=500subscript𝑝superscript𝜋500p_{\pi^{+}}=500 MeV/c as a function of the beam energy calculated from the data in Refs. abaev ; papp . The errors include all statistical and systematic errors, as explained in the text.
Tpsubscript𝑇𝑝T_{p} (GeV) d2σdΩdpsuperscriptd2𝜎dΩd𝑝\frac{\mathrm{d}^{2}\sigma}{\mathrm{d}\Omega\mathrm{d}p} (μbsrMeV/c𝜇bsrMeVc\mathrm{\frac{\mu b}{sr\,MeV/c}})
1.0 78.1±4.6plus-or-minus78.14.678.1\pm 4.6
1.2 71.9±3.9plus-or-minus71.93.971.9\pm 3.9
1.5 64.4±3.5plus-or-minus64.43.564.4\pm 3.5
2.0 56.7±4.0plus-or-minus56.74.056.7\pm 4.0
2.3 55.0±4.2plus-or-minus55.04.255.0\pm 4.2

In the following the notation σd2σ/(dΩdp)𝜎superscriptd2𝜎dΩd𝑝\sigma\equiv\mathrm{d}^{2}\sigma/(\mathrm{d}\Omega\mathrm{d}p) is used for the differential kaon (pion) cross sections which can be calculated from NK+isuperscriptsubscript𝑁superscript𝐾𝑖N_{K^{+}}^{i} (Nπ+isuperscriptsubscript𝑁superscript𝜋𝑖N_{\pi^{+}}^{i}) as

σK+(Tp,pi)=NK+i(Tp)(ΔpΔΩ)K+i1K+(Tp)1ϵK+isubscript𝜎superscript𝐾subscript𝑇𝑝superscript𝑝𝑖superscriptsubscript𝑁superscript𝐾𝑖subscript𝑇𝑝superscriptsubscriptΔ𝑝ΔΩsuperscript𝐾𝑖1subscriptsuperscript𝐾subscript𝑇𝑝1superscriptsubscriptitalic-ϵsuperscript𝐾𝑖\sigma_{K^{+}}(T_{p},p^{i})=\frac{N_{K^{+}}^{i}(T_{p})}{(\mathrm{\Delta}p\,\mathrm{\Delta}\Omega)_{K^{+}}^{i}}\cdot\frac{1}{\mathcal{L}_{K^{+}}(T_{p})}\cdot\frac{1}{\epsilon_{K^{+}}^{i}} (2)
σπ+(Tp,pi)=Nπ+i(Tp)(ΔpΔΩ)π+i1π+(Tp)1ϵπ+i,subscript𝜎superscript𝜋subscript𝑇𝑝superscript𝑝𝑖superscriptsubscript𝑁superscript𝜋𝑖subscript𝑇𝑝superscriptsubscriptΔ𝑝ΔΩsuperscript𝜋𝑖1subscriptsuperscript𝜋subscript𝑇𝑝1superscriptsubscriptitalic-ϵsuperscript𝜋𝑖\sigma_{\pi^{+}}(T_{p},p^{i})=\frac{N_{\pi^{+}}^{i}(T_{p})}{(\mathrm{\Delta}p\,\mathrm{\Delta}\Omega)_{\pi^{+}}^{i}}\cdot\frac{1}{\mathcal{L}_{\pi^{+}}(T_{p})}\cdot\frac{1}{\epsilon_{\pi^{+}}^{i}}\ , (3)

where (ΔpΔΩ)isuperscriptΔ𝑝ΔΩ𝑖(\mathrm{\Delta}p\,\mathrm{\Delta}\Omega)^{i} are the angular-momentum bins covered by each telescope and K+subscriptsuperscript𝐾\mathcal{L}_{K^{+}} (π+subscriptsuperscript𝜋\mathcal{L}_{\pi^{+}}) denote the luminosities integrated over the corresponding data-taking runs. Similar to pions the kaon-identification efficiencies are given by

ϵK+i=ϵK+Tel.(i)ϵK+MWPC(i)ϵK+decay.superscriptsubscriptitalic-ϵsuperscript𝐾𝑖subscriptsuperscriptitalic-ϵformulae-sequenceTel𝑖superscript𝐾subscriptsuperscriptitalic-ϵMWPC𝑖superscript𝐾subscriptsuperscriptitalic-ϵdecaysuperscript𝐾\epsilon_{K^{+}}^{i}=\epsilon^{\mathrm{Tel.}(i)}_{K^{+}}\cdot\epsilon^{\mathrm{MWPC}(i)}_{K^{+}}\cdot\epsilon^{\mathrm{decay}}_{K^{+}}\ . (4)

The efficiencies of the individual telescopes are in the range ϵK+Tel.(i)1030similar-tosubscriptsuperscriptitalic-ϵformulae-sequenceTel𝑖superscript𝐾1030\epsilon^{\mathrm{Tel.}(i)}_{K^{+}}\sim 10-30%. They have been obtained from a dedicated calibration run at Tp=2.3subscript𝑇𝑝2.3T_{p}=2.3 GeV K_NIM . The MWPC efficiencies amount to ϵK+MWPC(i)=7193subscriptsuperscriptitalic-ϵMWPC𝑖superscript𝐾7193\epsilon^{\mathrm{MWPC}(i)}_{K^{+}}=71-93a+_PRL depending on the kaon momenta, i.e. the telescope number i𝑖i.

From the analysis outlined above the pion cross sections σπ+(Tp,pi)subscript𝜎superscript𝜋subscript𝑇𝑝superscript𝑝𝑖\sigma_{\pi^{+}}(T_{p},p^{i}) are available either as σπ+(1.0GeV,pi)subscript𝜎superscript𝜋1.0GeVsuperscript𝑝𝑖\sigma_{\pi^{+}}(1.0\,\mathrm{GeV},p^{i}) (spectra from Ref. abaev downscaled in order to match the average cross section at 1.0 GeV from Table 1) or as σπ+(Tp,500MeV/c)subscript𝜎superscript𝜋subscript𝑇𝑝500MeVc\sigma_{\pi^{+}}(T_{p},500\,\mathrm{MeV/c}) (values given in Table 1). As a consequence, two different normalisation methods have to be used for the two data sets (1.3 and 1.6 T modes): the 1.3 T data comprise the measurement at Tp=1.0subscript𝑇𝑝1.0T_{p}=1.0 GeV where the pion momentum spectrum is available in the full ANKE momentum range, whereas the 1.6 T data have been obtained at energies Tp1.2subscript𝑇𝑝1.2T_{p}\geq 1.2 GeV where only the cross sections at pπ+=500subscript𝑝superscript𝜋500p_{\pi^{+}}=500 MeV/c are known.

Normalisation of the 1.3 T data: The pion and kaon data have been obtained at identical settings of the spectrometer, thus (ΔpΔΩ)K+i=(ΔpΔΩ)π+isuperscriptsubscriptΔ𝑝ΔΩsuperscript𝐾𝑖superscriptsubscriptΔ𝑝ΔΩsuperscript𝜋𝑖(\mathrm{\Delta}p\,\mathrm{\Delta}\Omega)_{K^{+}}^{i}=(\mathrm{\Delta}p\,\mathrm{\Delta}\Omega)_{\pi^{+}}^{i}. These angular-momentum bins can be calculated from Eq. (3):

(ΔpΔΩ)isuperscriptΔ𝑝ΔΩ𝑖\displaystyle(\Delta p\Delta\Omega)^{i} =\displaystyle= Nπ+i(Tp)σπ+(Tp,pi)1π+(Tp)1ϵπ+isuperscriptsubscript𝑁superscript𝜋𝑖subscript𝑇𝑝subscript𝜎superscript𝜋subscript𝑇𝑝superscript𝑝𝑖1subscriptsuperscript𝜋subscript𝑇𝑝1superscriptsubscriptitalic-ϵsuperscript𝜋𝑖\displaystyle\frac{N_{\pi^{+}}^{i}(T_{p})}{\sigma_{\pi^{+}}(T_{p},p^{i})}\cdot\frac{1}{\mathcal{L}_{\pi^{+}}(T_{p})}\cdot\frac{1}{\epsilon_{\pi^{+}}^{i}} (5)
=\displaystyle= Nπ+i(1.0)σπ+(1.0,pi)1π+(1.0)1ϵπ+i.superscriptsubscript𝑁superscript𝜋𝑖1.0subscript𝜎superscript𝜋1.0superscript𝑝𝑖1subscriptsuperscript𝜋1.01superscriptsubscriptitalic-ϵsuperscript𝜋𝑖\displaystyle\frac{N_{\pi^{+}}^{i}(1.0)}{\sigma_{\pi^{+}}(1.0,p^{i})}\cdot\frac{1}{\mathcal{L}_{\pi^{+}}(1.0)}\cdot\frac{1}{\epsilon_{\pi^{+}}^{i}}\ .

Using Eq. (2) one obtains:

σK+(Tp,pi)subscript𝜎superscript𝐾subscript𝑇𝑝superscript𝑝𝑖\displaystyle\sigma_{K^{+}}(T_{p},p^{i}) =\displaystyle= NK+i(Tp)\displaystyle N_{K^{+}}^{i}(T_{p})\cdot (6)
σπ+(1.0,pi)Nπ+i(1.0)π+(1.0)K+(Tp)ϵπ+iϵK+i.subscript𝜎superscript𝜋1.0superscript𝑝𝑖superscriptsubscript𝑁superscript𝜋𝑖1.0subscriptsuperscript𝜋1.0subscriptsuperscript𝐾subscript𝑇𝑝superscriptsubscriptitalic-ϵsuperscript𝜋𝑖superscriptsubscriptitalic-ϵsuperscript𝐾𝑖\displaystyle\frac{\sigma_{\pi^{+}}(1.0,p^{i})}{N_{\pi^{+}}^{i}(1.0)}\cdot\frac{\mathcal{L}_{\pi^{+}}(1.0)}{\mathcal{L}_{K^{+}}(T_{p})}\cdot\frac{\epsilon_{\pi^{+}}^{i}}{\epsilon_{K^{+}}^{i}}\ .

The relative luminosity normalisation π+/K+(Tp)subscriptsuperscript𝜋subscriptsuperscript𝐾subscript𝑇𝑝\mathcal{L}_{\pi^{+}}/\mathcal{L}_{K^{+}}(T_{p}) has been obtained individually for each beam energy by monitoring the interaction of the proton beam with the target to an accuracy of 2% using stop counters 2–5 in four-fold coincidence. This selects ejectiles which are produced in the target by hadronic interactions and bypass the spectrometer dipole D2, see Fig. 1. The signal of these monitors has been corrected for the dead time of the data acquisition system. For the more general case of different beam energies, i.e. for the ratio π+(1.0)/K+(Tp)subscriptsuperscript𝜋1.0subscriptsuperscript𝐾subscript𝑇𝑝\mathcal{L}_{\pi^{+}}(1.0)/\mathcal{L}_{K^{+}}(T_{p}) in Eq. (6), one has to use

π+(1.0)K+(Tp)subscriptsuperscript𝜋1.0subscriptsuperscript𝐾subscript𝑇𝑝\displaystyle\frac{\mathcal{L}_{\pi^{+}}(1.0)}{\mathcal{L}_{K^{+}}(T_{p})} \displaystyle\equiv π+K+(Tp)π+(1.0)π+(Tp)subscriptsuperscript𝜋subscriptsuperscript𝐾subscript𝑇𝑝subscriptsuperscript𝜋1.0subscriptsuperscript𝜋subscript𝑇𝑝\displaystyle\frac{\mathcal{L}_{\pi^{+}}}{\mathcal{L}_{K^{+}}}(T_{p})\cdot\frac{\mathcal{L}_{\pi^{+}}(1.0)}{\mathcal{L}_{\pi^{+}}(T_{p})} (7)
=\displaystyle= π+K+(Tp)σπ+(Tp,pi)σπ+(1.0,pi)Nπ+i(1.0)Nπ+i(Tp).subscriptsuperscript𝜋subscriptsuperscript𝐾subscript𝑇𝑝subscript𝜎superscript𝜋subscript𝑇𝑝superscript𝑝𝑖subscript𝜎superscript𝜋1.0superscript𝑝𝑖superscriptsubscript𝑁superscript𝜋𝑖1.0superscriptsubscript𝑁superscript𝜋𝑖subscript𝑇𝑝\displaystyle\frac{\mathcal{L}_{\pi^{+}}}{\mathcal{L}_{K^{+}}}(T_{p})\cdot\frac{\sigma_{\pi^{+}}(T_{p},p^{i})}{\sigma_{\pi^{+}}(1.0,p^{i})}\cdot\frac{N_{\pi^{+}}^{i}(1.0)}{N_{\pi^{+}}^{i}(T_{p})}\ .

Since Eq. (7) is valid for any telescope i𝑖i (i.e. momentum p𝑝p) we choose i=15𝑖15i=15 since σπ+(Tp,pi)subscript𝜎superscript𝜋subscript𝑇𝑝superscript𝑝𝑖\sigma_{\pi^{+}}(T_{p},p^{i}) is only available for pi=15=500superscript𝑝𝑖15500p^{i=15}=500 MeV/c:

π+(1.0)K+(Tp)=π+K+(Tp)σπ+(Tp,500)σπ+(1.0,500)Nπ+15(1.0)Nπ+15(Tp).subscriptsuperscript𝜋1.0subscriptsuperscript𝐾subscript𝑇𝑝subscriptsuperscript𝜋subscriptsuperscript𝐾subscript𝑇𝑝subscript𝜎superscript𝜋subscript𝑇𝑝500subscript𝜎superscript𝜋1.0500superscriptsubscript𝑁superscript𝜋151.0superscriptsubscript𝑁superscript𝜋15subscript𝑇𝑝\frac{\mathcal{L}_{\pi^{+}}(1.0)}{\mathcal{L}_{K^{+}}(T_{p})}=\frac{\mathcal{L}_{\pi^{+}}}{\mathcal{L}_{K^{+}}}(T_{p})\cdot\frac{\sigma_{\pi^{+}}(T_{p},500)}{\sigma_{\pi^{+}}(1.0,500)}\cdot\frac{N_{\pi^{+}}^{15}(1.0)}{N_{\pi^{+}}^{15}(T_{p})}\ . (8)

Combining Eqs. (6) and (8) one finds the final formula for normalisation of the kaon cross sections:

σK+(Tp,pi)=NK+i(Tp)\displaystyle\sigma_{K^{+}}(T_{p},p^{i})=N_{K^{+}}^{i}(T_{p})\cdot
σπ+(1.0,pi)Nπ+i(1.0)π+K+(Tp)σπ+(Tp,500)σπ+(1.0,500)Nπ+15(1.0)Nπ+15(Tp)ϵπ+iϵK+i.subscript𝜎superscript𝜋1.0superscript𝑝𝑖superscriptsubscript𝑁superscript𝜋𝑖1.0subscriptsuperscript𝜋subscriptsuperscript𝐾subscript𝑇𝑝subscript𝜎superscript𝜋subscript𝑇𝑝500subscript𝜎superscript𝜋1.0500superscriptsubscript𝑁superscript𝜋151.0superscriptsubscript𝑁superscript𝜋15subscript𝑇𝑝superscriptsubscriptitalic-ϵsuperscript𝜋𝑖superscriptsubscriptitalic-ϵsuperscript𝐾𝑖\displaystyle\frac{\sigma_{\pi^{+}}(1.0,p^{i})}{N_{\pi^{+}}^{i}(1.0)}\cdot\frac{\mathcal{L}_{\pi^{+}}}{\mathcal{L}_{K^{+}}}(T_{p})\cdot\frac{\sigma_{\pi^{+}}(T_{p},500)}{\sigma_{\pi^{+}}(1.0,500)}\cdot\frac{N_{\pi^{+}}^{15}(1.0)}{N_{\pi^{+}}^{15}(T_{p})}\cdot\frac{\epsilon_{\pi^{+}}^{i}}{\epsilon_{K^{+}}^{i}}\ .

Normalisation of the 1.6 T data: For the higher field strength the spectra could not be measured at Tp=1.0subscript𝑇𝑝1.0T_{p}=1.0 GeV, since this energy would result in a too large beam deflection angle in the ANKE dipoles ANKE_NIM . Hence, Eq. (5) cannot be used and the 1.6 T data have been analysed applying identical cuts such that (ΔpΔΩ)isuperscriptΔ𝑝ΔΩ𝑖(\mathrm{\Delta}p\mathrm{\Delta}\Omega)^{i} is constant (with an accuracy of better than 5%) for all telescopes and beam energies. Emission angles of the analysed particles |θhor|<6subscript𝜃horsuperscript6|\theta_{\mathrm{hor}}|<6^{\circ} and |ϑvert|<3.5subscriptitalic-ϑvertsuperscript3.5|\vartheta_{\mathrm{vert}}|<3.5^{\circ} have been selected, the momentum acceptance of each telescope has been restricted to Δp<6Δ𝑝6\mathrm{\Delta}p<6 MeV/c. In the 1.6 T mode particles with p=500𝑝500p=500 MeV/c are detected in telescope 13, thus:

(ΔpΔΩ)isuperscriptΔ𝑝ΔΩ𝑖\displaystyle(\mathrm{\Delta}p\mathrm{\Delta}\Omega)^{i} =\displaystyle= (ΔpΔΩ)13=superscriptΔ𝑝ΔΩ13absent\displaystyle(\mathrm{\Delta}p\mathrm{\Delta}\Omega)^{13}= (9)
Nπ+13(Tp)σπ+(Tp,500)1π+(Tp)1ϵπ+13.superscriptsubscript𝑁superscript𝜋13subscript𝑇𝑝subscript𝜎superscript𝜋subscript𝑇𝑝5001subscriptsuperscript𝜋subscript𝑇𝑝1superscriptsubscriptitalic-ϵsuperscript𝜋13\displaystyle\frac{N_{\pi^{+}}^{13}(T_{p})}{\sigma_{\pi^{+}}\left(T_{p},500\right)}\cdot\frac{1}{\mathcal{L}_{\pi^{+}}(T_{p})}\cdot\frac{1}{\epsilon_{\pi^{+}}^{13}}\ .

Together with Eq. (2) this leads to:

σK+(Tp,pi)subscript𝜎superscript𝐾subscript𝑇𝑝subscript𝑝𝑖\displaystyle\sigma_{K^{+}}(T_{p},p_{i}) =\displaystyle= NK+i(Tp)\displaystyle N_{K^{+}}^{i}(T_{p})\cdot (10)
σπ+(Tp,500)Nπ+13(Tp)π+K+(Tp)ϵπ+13ϵK+i.subscript𝜎superscript𝜋subscript𝑇𝑝500superscriptsubscript𝑁superscript𝜋13subscript𝑇𝑝subscriptsuperscript𝜋subscriptsuperscript𝐾subscript𝑇𝑝superscriptsubscriptitalic-ϵsuperscript𝜋13superscriptsubscriptitalic-ϵsuperscript𝐾𝑖\displaystyle\frac{\sigma_{\pi^{+}}(T_{p},500)}{N_{\pi^{+}}^{13}(T_{p})}\cdot\frac{\mathcal{L}_{\pi^{+}}}{\mathcal{L}_{K^{+}}}(T_{p})\cdot\frac{\epsilon_{\pi^{+}}^{13}}{\epsilon_{K^{+}}^{i}}\ .

In principle, the (simpler) 1.6 T normalisation formula could also be applied to the 1.3 T data. However, the latter were generally measured with lower statistics which would be further reduced by the restriction of the accepted angles ΔΩΔΩ\mathrm{\Delta}\Omega and momenta ΔpΔ𝑝\mathrm{\Delta}p leading to significantly larger statistical uncertainties.

2.3 Target-mass dependence of the cross sections

The target-mass dependence of the K+superscript𝐾K^{+}-production cross sections has been determined using the formula:

R(A/C)σK+AσK+C(pi)=[NK+ANK+C]tel.(i)CA.𝑅𝐴Csubscriptsuperscript𝜎𝐴superscript𝐾subscriptsuperscript𝜎Csuperscript𝐾superscript𝑝𝑖subscriptdelimited-[]subscriptsuperscript𝑁𝐴superscript𝐾subscriptsuperscript𝑁Csuperscript𝐾formulae-sequencetel𝑖superscriptCsuperscript𝐴R(A/\mathrm{C})\equiv\frac{\sigma^{A}_{K^{+}}}{\sigma^{\mathrm{C}}_{K^{+}}}(p^{i})=\left[\frac{N^{A}_{K^{+}}}{N^{\mathrm{C}}_{K^{+}}}\right]_{\mathrm{tel.(\mathit{i})}}\cdot\frac{{\mathcal{L}}^{\mathrm{C}}}{{\mathcal{L}}^{A}}\ . (11)

Here the index “A𝐴A” stands for the copper, silver and gold targets, respectively, while “C” refers to carbon. NK+subscript𝑁superscript𝐾N_{K^{+}} is the number of identified kaons in each telescope i𝑖i after dead-time corrections. \mathcal{L} stands for the integrated luminosity during data taking for the particular target.

In principle, absolute production cross sections could have been determined also for the heavier targets using the normalisation procedure described in the previous paragraph. However, absolute cross sections for Cu, Ag and Au are not needed for the following analyses, but only the cross-section ratios R(A/C)𝑅𝐴CR(A/\mathrm{C}). These have the advantage of higher accuracy since many possible systematic errors, such as corrections for the detection efficiencies in the ANKE range telescopes, cancel out.

The luminosity ratio C/AsuperscriptCsuperscript𝐴{\mathcal{L}}^{\mathrm{C}}/{\mathcal{L}}^{A} in Eq. (11) can be deduced from the ratio of pion rates, measured under identical experimental conditions for each target during calibration runs using an on-line trigger optimised for π+superscript𝜋\pi^{+} detection:

CA=[Nπ+CNπ+A]tel.#13/15[σπ+Aσπ+C]p=500MeV/c.superscriptCsuperscript𝐴subscriptdelimited-[]subscriptsuperscript𝑁Csuperscript𝜋subscriptsuperscript𝑁𝐴superscript𝜋formulae-sequencetel#1315subscriptdelimited-[]subscriptsuperscript𝜎𝐴superscript𝜋subscriptsuperscript𝜎Csuperscript𝜋𝑝500MeVc\frac{{\mathcal{L}}^{\mathrm{C}}}{{\mathcal{L}}^{A}}=\left[\frac{N^{\mathrm{C}}_{\pi^{+}}}{N^{A}_{\pi^{+}}}\right]_{\mathrm{tel.\#13/15}}\cdot\left[\frac{\sigma^{A}_{\pi^{+}}}{\sigma^{\mathrm{C}}_{\pi^{+}}}\right]_{p=500\ \mathrm{MeV/c}}\ . (12)

Nπ+subscript𝑁superscript𝜋N_{\pi^{+}} is the number of pions detected by telescope #13 (which detects ejectiles with momenta of 500 MeV/c in the 1.6 T mode) or #15 (1.3 T mode), normalised to the proton-beam flux. For a momentum of 500 MeV/c the ratio of the pion-production cross sections σπ+subscript𝜎superscript𝜋\sigma_{\pi^{+}} can be extracted from experimental data abaev ; papp ; cochran taken in the energy range Tp=0.734.2subscript𝑇𝑝0.734.2T_{p}=0.73-4.2 GeV at emission angles of 0superscript00^{\circ}, 2.5superscript2.52.5^{\circ} and 15superscript1515^{\circ}. Figure 3 shows the cross-section ratios for Cu/C and Pb/C calculated from those data.

Refer to caption
Figure 3: Ratios of the π+superscript𝜋\pi^{+}-production cross sections for Cu/C and Pb/C at pπ+=500subscript𝑝superscript𝜋500p_{\pi^{+}}=500 MeV/c as a function of the projectile energy Tpsubscript𝑇𝑝T_{p}. The data were taken from Refs. cochran (triangles, Tp=0.73subscript𝑇𝑝0.73T_{p}=0.73 GeV, ϑπ+=15subscriptitalic-ϑsuperscript𝜋superscript15{\vartheta}_{\pi^{+}}=15^{\circ}), abaev (squares, Tp=1.0subscript𝑇𝑝1.0T_{p}=1.0 GeV, ϑπ+=0subscriptitalic-ϑsuperscript𝜋superscript0{\vartheta}_{\pi^{+}}=0^{\circ}) and papp (circles, Tp=1.054.2subscript𝑇𝑝1.054.2T_{p}=1.05-4.2 GeV, ϑπ+=2.5subscriptitalic-ϑsuperscript𝜋superscript2.5{\vartheta}_{\pi^{+}}=2.5^{\circ}). The lines are linear fits to the data points. The arrows indicate the uncertainties of the ratios at the minimum and maximum energy measured with ANKE.

From Fig. 3 one can deduce the π+superscript𝜋\pi^{+}-production ratios for Cu/C and Au/C. For Cu/C values of 1.81±0.05plus-or-minus1.810.051.81\pm 0.05 at Tp=1.0subscript𝑇𝑝1.0T_{p}=1.0 GeV and 1.88±0.18plus-or-minus1.880.181.88\pm 0.18 at Tp=2.3subscript𝑇𝑝2.3T_{p}=2.3 GeV are obtained. For Pb/C the ratios are 2.34±0.07plus-or-minus2.340.072.34\pm 0.07 and 2.80±0.29plus-or-minus2.800.292.80\pm 0.29, respectively. All values agree within 10% with ratios scaling as A1/3superscript𝐴13A^{1/3}, i.e. 1.74 and 2.58 for Cu/C and Pb/C, respectively. Thus, assuming an A1/3superscript𝐴13A^{1/3} dependence, it is possible to calculate from the ratios Pb/C those for Au/C. We use for the ratio Au/C values of 2.29±0.07plus-or-minus2.290.072.29\pm 0.07 at Tp=1.0subscript𝑇𝑝1.0T_{p}=1.0 GeV and 2.73±0.27plus-or-minus2.730.272.73\pm 0.27 at Tp=2.3subscript𝑇𝑝2.3T_{p}=2.3 GeV. The analysis of our π+superscript𝜋\pi^{+}-data shows that the cross-section ratios are to about 2% independent of the π+superscript𝜋\pi^{+}-emission angle within the ANKE angular acceptance.

3 Inclusive 𝑲+superscript𝑲K^{+}-momentum spectra for 𝑨𝟏𝟐𝑨12A\geq 12

3.1 Absolute cross sections for 𝒑𝟏𝟐𝐂𝑲+𝑿bold-→superscript𝒑12𝐂superscript𝑲𝑿p\,^{12}\mathrm{C}\to K^{+}X reactions

The measured cross sections for K+superscript𝐾K^{+} production in p𝑝p\,C interactions are shown in Fig. 4 and listed in Tables 4 and 5. The overall systematic uncertainties coming from the normalisation to pion data described in Sect. 2.2 (i.e. errors given in the right column of Table 1 plus 2% for the uncertainty of the beam monitoring) are ϵsyst=8, 7, 7, 9subscriptitalic-ϵsyst8779\epsilon_{\mathrm{syst}}=8,\,7,\,7,\,9 and 10% for Tp=1.0, 1.2, 1.5, 2.0subscript𝑇𝑝1.01.21.52.0T_{p}=1.0,\,1.2,\,1.5,\,2.0 and 2.3 GeV, respectively. The error bars of the individual data points include the uncertainties arising from the efficiency-correction factors of Eq. (1) and (4) but not the overall uncertainty from the pion normalisation. In both operation modes of D2, kaons could be identified in telescopes #3–15 whereas in the two closest telescopes the background from scattered particles turned out to be too large.
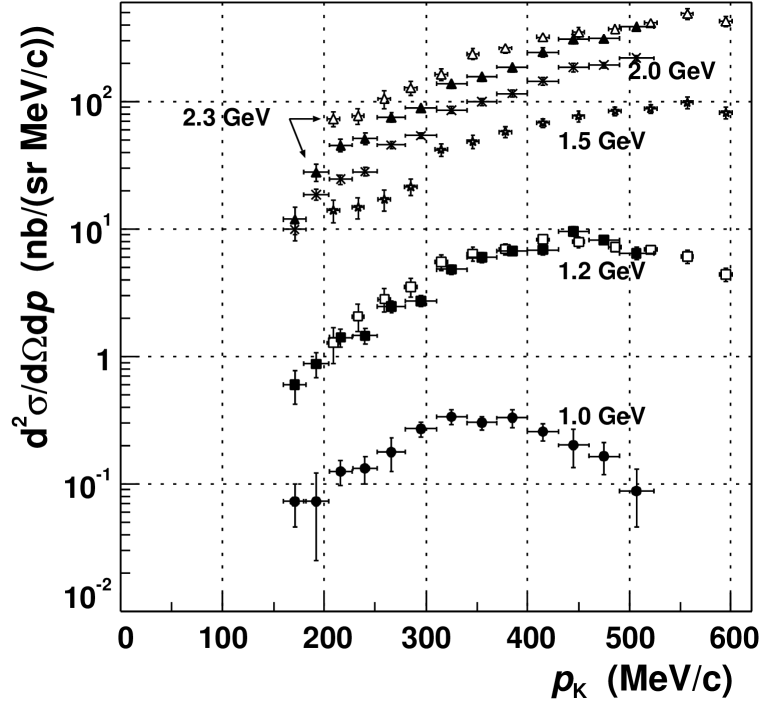
Refer to caption
Figure 4: Double differential p12CK+Xsuperscript𝑝12Csuperscript𝐾𝑋p^{12}\mathrm{C}\rightarrow K^{+}X cross sections measured at ANKE. The numerical values are reported in Tables 4 and 5. Black circles denote the cross sections measured at Tp=1.0subscript𝑇𝑝1.0T_{p}=1.0 GeV ANKE_1.0GeV , squares at Tp=1.2subscript𝑇𝑝1.2T_{p}=1.2 GeV, stars at Tp=1.5subscript𝑇𝑝1.5T_{p}=1.5 GeV, crosses at Tp=2.0subscript𝑇𝑝2.0T_{p}=2.0 GeV and triangles at Tp=2.3subscript𝑇𝑝2.3T_{p}=2.3 GeV. Closed symbols correspond to the measurements with B=1.3𝐵1.3B=1.3 T in the full ANKE acceptance, while open symbols to B=1.57𝐵1.57B=1.57 T and θhor<6subscript𝜃horsuperscript6\theta_{\mathrm{hor}}<6^{\circ}, ϑvert<3.5subscriptitalic-ϑvertsuperscript3.5\vartheta_{\mathrm{vert}}<3.5^{\circ}. The error bars do not include the systematic uncertainties from the normalisation to pion data.

At Tp=2.3subscript𝑇𝑝2.3T_{p}=2.3 GeV there are discrepancies between the two data sets for pK+450subscript𝑝superscript𝐾450p_{K^{+}}\leq 450 MeV/c, whereas at Tp=1.2subscript𝑇𝑝1.2T_{p}=1.2 GeV they coincide. This cannot be caused by the angular dependence of K+superscript𝐾K^{+} production because the cross sections evaluated in the even more restricted angular interval, |θhor|<4subscript𝜃horsuperscript4|\theta_{\mathrm{hor}}|<4^{\circ} and |ϑvert|<2.5subscriptitalic-ϑvertsuperscript2.5|\vartheta_{\mathrm{vert}}|<2.5^{\circ} are in agreement with those obtained for |θhor|<6subscript𝜃horsuperscript6|\theta_{\mathrm{hor}}|<6^{\circ} and |ϑvert|<3.5subscriptitalic-ϑvertsuperscript3.5|\vartheta_{\mathrm{vert}}|<3.5^{\circ}. Furthermore, the discrepancy is unlikely to be due to the K+superscript𝐾K^{+} identification procedure since, for this particular energy, different analysis algorithms were applied giving a difference in the cross sections smaller than 2%. We conclude that there is an unknown source of systematic errors, which may yield an additional uncertainty of up to 30% at the highest measured beam energy. These uncertainties vanish when one calculates the cross-section ratios for different target nuclei, see Sect. 3.2.

3.2 Target-mass dependence of 𝑹(𝑨/𝐂)𝑹𝑨𝐂R(A/\mathrm{C})

The cross section ratios R(A/C)𝑅𝐴CR(A/\mathrm{C}), measured with the two operation modes of D2, for beam energies Tp=1.0subscript𝑇𝑝1.0T_{p}=1.0, 1.5, 1.75 and 2.3 GeV are listed in Tables 6, 7, 8 and 9. These complement the published partial results ANKE_1.0GeV ; PLB . No data for targets heavier than carbon was taken for Tp=1.2subscript𝑇𝑝1.2T_{p}=1.2 and 2.0 GeV, whereas the absolute normalisation was not established at Tp=1.75subscript𝑇𝑝1.75T_{p}=1.75 GeV.

The measured ratios R𝑅R(Au/C) at all beam energies are shown in Fig. 5. For Tp1.5subscript𝑇𝑝1.5T_{p}\geq 1.5 GeV all data exhibit similar shapes, rising steadily with decreasing kaon momenta, passing a maximum and falling steeply at low momenta. The maxima around pmax245similar-tosubscript𝑝max245p_{\mathrm{max}}\sim 245 MeV/c coincide within 2 MeV/c, i.e. their positions do not depend on the proton beam energy. The independence of the peak positions from the beam energy Tpsubscript𝑇𝑝T_{p} suggests that the effect is due to FSI effects of the produced kaons, since the basic production mechanism may change from 1.5 to 2.3 GeV (see Sect. 4). The ratio data at Tp=1.0subscript𝑇𝑝1.0T_{p}=1.0 GeV is much less precise and does not extend below pK220similar-tosubscript𝑝𝐾220p_{K}\sim 220 MeV/c because of the large background at this low beam energy. Therefore, it is inconclusive with regard to the peak shape and position observed at the higher energies.

Refer to caption
Figure 5: Ratios of the K+superscript𝐾K^{+}-production cross sections R𝑅R(Au/C) measured at Tp=1.0, 1.5, 1.75subscript𝑇𝑝1.01.51.75T_{p}=1.0,\,1.5,\,1.75 and 2.3 GeV as a function of the laboratory kaon momentum pK+subscript𝑝superscript𝐾p_{K^{+}} (cf. Tables 69).

To ensure that the pronounced peak structure of R(A/C)𝑅𝐴CR(A/\mathrm{C}) is not an artefact of the ANKE detection system, the 2.3 GeV data were taken with both operation modes of D2, resulting in a change in the values of the momenta that are focused onto the individual range telescopes K_NIM . The data from Table 9 for R(A/C)𝑅𝐴CR(A/\mathrm{C}) at Tp=2.3subscript𝑇𝑝2.3T_{p}=2.3 GeV obtained with the 1.3 T and 1.6 T modes, show that these data sets agree, as illustrated in Fig. 6 for R𝑅R(Au/C). This also demonstrates that the 30% uncertainty of the absolute cross sections measured at Tp=2.3subscript𝑇𝑝2.3T_{p}=2.3 GeV cancels out for the ratios. In addition, the statistical errors are significantly smaller here. Consistent values for the ratios were also obtained when the polar K+superscript𝐾K^{+}-emission angles were restricted to ϑK+<3subscriptitalic-ϑsuperscript𝐾superscript3\vartheta_{K^{+}}<3^{\circ}, as shown in Fig. 6.

Refer to caption
Refer to caption
Figure 6: Upper: Ratios of the K+superscript𝐾K^{+}-production cross sections R𝑅R(Au/C) measured at Tp=2.3subscript𝑇𝑝2.3T_{p}=2.3 GeV and different operation modes of D2 (cf. Table 9). Lower: Same ratios measured in the full ANKE acceptance and restricted to angles ϑK+<3subscriptitalic-ϑsuperscript𝐾superscript3\vartheta_{K^{+}}<3^{\circ}.

The ratios of kaon-production cross sections R𝑅R(Cu/C), R𝑅R(Ag/C) and R𝑅R(Au/C) measured at 2.3 GeV are presented in Fig. 7. The position of the maximum of R𝑅R(A/C) varies with nucleus; a fit to the data results in pmax=211±6subscript𝑝maxplus-or-minus2116p_{\mathrm{max}}=211\pm 6, 232±6plus-or-minus2326232\pm 6 and 245±5plus-or-minus2455245\pm 5 MeV/c for Cu, Ag and Au, respectively PLB .

Refer to caption
Refer to caption
Figure 7: Upper: Ratios of the K+superscript𝐾K^{+}-production cross sections R𝑅R(Cu/C) (1.3 T), R𝑅R(Ag/C) (1.3 T), R𝑅R(Au/C) (1.6 T) measured at Tp=2.3subscript𝑇𝑝2.3T_{p}=2.3 GeV as a function of the laboratory kaon momentum (cf. Table 9). Lower: Result of model calculations with the CBUU transport code rudy for R𝑅R(Au/C) showing the effect of K+superscript𝐾K^{+} rescattering, the Coulomb and nuclear K+superscript𝐾K^{+} potentials (dotted line: no rescattering and no potentials; dashed: only rescattering, no potentials; dashed-dotted: rescattering plus Coulomb; solid: full calculation taking into account rescattering, Coulomb and different nuclear potentials). The arrow indicates the position of the maximum of the measured ratio R𝑅R(Au/C).

In an earlier publication PLB we showed that from the cross section ratios R𝑅R(A/C) the nuclear K+superscript𝐾K^{+}-potential for normal nuclear density can be derived with high accuracy. This is illustrated in Fig. 7, where the results of model calculations for R𝑅R(Au/C) within the CBUU transport code wolf ; rudy are plotted. Without any FSI the ratio R𝑅R(Au/C) is almost independent of the kaon momentum, and the average ratio R(Au/C)9similar-to𝑅AuC9R\mathrm{(Au/C)}\sim 9 corresponds to an A𝐴A-dependence σAαproportional-to𝜎superscript𝐴𝛼\sigma\propto A^{\alpha} with α0.79similar-to𝛼0.79\alpha\sim 0.79.

It has frequently been argued that the A𝐴A-dependence of the K+superscript𝐾K^{+}-production cross section is sensitive to the dominant production mechanism. In a naive model for direct K+superscript𝐾K^{+}-production in a collision of the beam proton with a single target nucleon the A𝐴A-dependence is given by the inelastic scattering cross section of the incident proton which can be parameterised as Aαsuperscript𝐴𝛼A^{\alpha} with α0.60.7similar-to𝛼0.60.7\alpha\sim 0.6-0.7 (see Ref. syst and references therein). Nuclear effects, like the intrinsic momenta of the participating nucleons or Pauli blocking should not depend on the target mass. Therefore, one expects that the K+superscript𝐾K^{+}-production cross section is proportional to A0.60.7similar-toabsentsuperscript𝐴0.60.7{\sim}A^{0.6-0.7} if the kaons are dominantly produced via the direct mechanism. K+superscript𝐾K^{+}-mesons can also be produced in two-step processes with intermediate pion production (pN1πX𝑝subscript𝑁1𝜋𝑋pN_{1}{\to}\pi X) and subsequent πN2K+X𝜋subscript𝑁2superscript𝐾𝑋\pi N_{2}{\to}K^{+}X reactions on a second target nucleon rudy ; pnpi ; cassing ; roc ; sibirtsev ; paryev ; cassing99 . Since two nucleons are needed in this case, a stronger A𝐴A-dependence with α1greater-than-or-equivalent-to𝛼1\alpha\gtrsim 1 is expected. However, the analysis of K+superscript𝐾K^{+}-production data in Ref. syst shows that it is not possible to draw unambiguous conclusions about the underlying reaction mechanisms from the A𝐴A-dependence of differential K+superscript𝐾K^{+} cross sections. The reason for this is that FSI effects change the shape of the kaon spectra and, as a result, the A𝐴A-dependence may vary with the kaon momenta and emission angles covered by the particular experiment. For example, rescattering processes tend to slow down the produced kaons leading to a steadily rising ratio R(Au/C)𝑅AuCR\mathrm{(Au/C)} with decreasing K+superscript𝐾K^{+} momenta, see dashed line in Fig. 7.

In a purely classical picture, kaons produced at some radius R𝑅R in a nucleus acquire an additional momentum of pmin=2mKVC(R)subscript𝑝min2subscript𝑚𝐾subscript𝑉𝐶𝑅p_{\mathrm{min}}=\sqrt{2m_{K}V_{C}(R)} in the repulsive Coulomb potential. This corresponds to a minimum momentum of pK130similar-tosubscript𝑝𝐾130p_{K}\sim 130 MeV/c for an Au nucleus. Thus R𝑅R(Au/C) should drop to zero for smaller kaon momenta. This is well reproduced by the calculations presented in Fig. 7 and results in the pronounced peak structure of the cross-section ratios. From this peak position, which can be determined with high accuracy both in the data and the calculated spectra, the nuclear K+superscript𝐾K^{+}-potential can be determined with high accuracy PLB .

The repulsive nuclear K+superscript𝐾K^{+}-potential, which is expected to be of strength VK=22±5subscript𝑉𝐾plus-or-minus225V_{K}=22\pm 5 MeV sibirtsev98 , independent of the target mass A𝐴A, shifts the kaon momenta, and thus the peak positions, to higher values. In Fig. 7 we illustrate this effect for VK=0subscript𝑉𝐾0V_{K}=0, 20 and 40 MeV. The best agreement between the measured and calculated peak positions is obtained for VK=20subscript𝑉𝐾20V_{K}=20 MeV with an estimated uncertainty of about ±3plus-or-minus3\pm 3 MeV. We expect that an even higher precision in VKsubscript𝑉𝐾V_{K} could be obtained from refined model calculations for the full data set (all beam energies and target nuclei) which not only reproduce the peak positions of R𝑅R(A/C) but also the shape of all measured distributions, in particular at low kaon momenta rudy_tbp .

4 Systematics of available 𝒑𝒑p\,C cross sections

Table 2 lists the available data on K+superscript𝐾K^{+} production in pA𝑝𝐴pA collisions from ANKE and elsewhere in the literature. The different data sets were obtained for non-overlapping kinematical parameters (i.e. beam energies, kaon emission angles and momenta) which prevents a direct comparison with the results from ANKE and, e.g., a test of the overall normalisations.

Table 2: Data on K+superscript𝐾K^{+}-production in pA𝑝𝐴pA collisions (ordered by the year of publication) at various beam energies Tpsubscript𝑇𝑝T_{p}, kaon momenta pKsubscript𝑝𝐾p_{K} and emission angles ϑKsubscriptitalic-ϑ𝐾\vartheta_{K}.
Tpsubscript𝑇𝑝T_{p} (GeV) Targets pKsubscript𝑝𝐾p_{K} (MeV/c) ϑKsubscriptitalic-ϑ𝐾\vartheta_{K} () Measured at
0.842–0.99 Be…Pb total cross sections PNPI pnpi
2.1 NaF, Pb 350–750 15–80 LBL schnetzer
1.2, 1.5, 2.5 C, Pb 500–700 40 SATURNE debowski
1.2 C 165–255 90 CELSIUS badala
1.65–2.91 Be, Al, Cu, Ta 1280 10.5 ITEP akindinov
2.9 Be 545 17 ITEP buescher
1.0 C, Cu, Au 171–507 12absent12\leq 12 ANKE ANKE_1.0GeV
1.6 C, Au 275–1075 40–64 KaoS scheinast
1.6 Ni 275–1075 40 KaoS scheinast
2.5, 3.5 C, Au 275–1075 32–64 KaoS scheinast
2.5, 3.5 Ni 275–1075 40 KaoS scheinast
1.0, 1.2, 1.5, 2.0, 2.3 C,Cu,Ag,Au 171–595 12absent12\leq 12 ANKE

In Ref. syst it was shown that the measured invariant cross sections Ed3σ/d3p𝐸superscriptd3𝜎superscriptd3𝑝E\,\mathrm{d}^{3}\sigma/\mathrm{d}^{3}p follow an exponential scaling behaviour when plotted as a function of the four-momentum transfer t𝑡t, as illustrated in Fig. 8.

Refer to caption
Refer to caption
Figure 8: Upper: Invariant p12CK+Xsuperscript𝑝12Csuperscript𝐾𝑋p^{12}\textrm{C}\rightarrow K^{+}X cross sections as a function of the four-momentum transfer t𝑡t between the beam proton and the outgoing kaon. The dashed line indicates the average t𝑡t dependence, obtained from a global fit to all data sets using Eq. (14) (b0=2.2GeV2subscript𝑏02.2superscriptGeV2b_{0}=2.2\,\mathrm{GeV}^{-2}). Lower: Scaled invariant p12CK+Xsuperscript𝑝12Csuperscript𝐾𝑋p^{12}\textrm{C}\rightarrow K^{+}X cross sections as a function of the excitation energy ΔmΔ𝑚\Delta m of the target nucleus. The data from LBL schnetzer and ITEP akindinov ; buescher were measured with NaF (Be) targets and were corrected for the target-mass dependence according to Ref. syst . The beam energies of the ANKE data sets (filled stars) are indicated; for Tp=2.3subscript𝑇𝑝2.3T_{p}=2.3 GeV the data obtained with B=1.3𝐵1.3B=1.3 T (closed triangles in Fig. 4) were used.

Apart from the data taken with ANKE at Tp=1.0subscript𝑇𝑝1.0T_{p}=1.0 and 1.2 GeV, all spectra cover the range of negative t𝑡t. The sharp fall-off of the cross sections from ANKE towards positive values of t𝑡t was explained in Ref. syst by the fact that the data were taken very close to the kinematical limit for hypernucleus formation at t=0.145GeV2𝑡0.145superscriptGeV2t=0.145\ \mathrm{GeV}^{2} (Tp=1.0subscript𝑇𝑝1.0T_{p}=1.0 GeV) which is usually accompanied by very small cross sections. For t<0𝑡0t<0 the individual data sets i𝑖i show exponential dependences of the form Ed3σ/d3p=c0iexp[b0it]𝐸superscriptd3𝜎superscriptd3𝑝superscriptsubscript𝑐0𝑖superscriptsubscript𝑏0𝑖𝑡E\,\mathrm{d}^{3}\sigma/\mathrm{d}^{3}p=c_{0}^{i}\exp{[b_{0}^{i}t]}, with parameters c0isuperscriptsubscript𝑐0𝑖c_{0}^{i} and b0isuperscriptsubscript𝑏0𝑖b_{0}^{i} being given in Ref. syst . It has been speculated in Ref. syst that the differing slope parameters b0isuperscriptsubscript𝑏0𝑖b_{0}^{i}, as well as deviations from the exponential behaviour (see, e.g., the data from KaoS scheinast in Fig. 8), reflect a dependence on the available squared CM energy s𝑠s and the excitation energy of the target nucleus, Δm=mXmAΔ𝑚subscript𝑚𝑋subscript𝑚𝐴\Delta m=m_{X}-m_{A}, where mXsubscript𝑚𝑋m_{X} and mAsubscript𝑚𝐴m_{A} denote the masses of the target nucleus before and after the reaction process, respectively. Based on Regge phenomenology regge the following formula has been suggested as a parameterisation of the invariant cross section:

Ed3σd3pf(t,mX2)exp[b0tln(s/s0)].proportional-to𝐸superscriptd3𝜎superscriptd3𝑝𝑓𝑡superscriptsubscript𝑚𝑋2subscript𝑏0𝑡𝑠subscript𝑠0E\,\frac{\mathrm{d}^{3}\sigma}{\mathrm{d}^{3}p}\propto f(t,m_{X}^{2})\exp{[b_{0}t\cdot\ln{(s/s_{0})}]}\ . (13)

It is shown in the following that an explicit treatment of the s𝑠s and ΔmΔ𝑚\Delta m dependences based on Eq. (13) allows one to describe all data sets with a single parameter b0subscript𝑏0b_{0}, expressing the average t𝑡t dependence of the invariant K+superscript𝐾K^{+}-production cross section in pA𝑝𝐴pA interactions (see dashed line in Fig. 8 which has been calculated for an arbitrary value of c0subscript𝑐0c_{0}).

Figure 8 shows the invariant cross sections, divided by the factor exp[b0tln(s/s0)]subscript𝑏0𝑡𝑠subscript𝑠0\exp{[b_{0}t\cdot\ln{(s/s_{0})}]} using b0=2.2GeV2subscript𝑏02.2superscriptGeV2b_{0}=2.2\ \mathrm{GeV}^{-2} and s0=100GeV2subscript𝑠0100superscriptGeV2s_{0}=100\ \mathrm{GeV}^{2}, as a function of the excitation energy ΔmΔ𝑚\Delta m. The two solid lines correspond to a parameterisation of the invariant cross sections in p12superscript𝑝12p^{12}C interactions

Ed3σd3p𝐸superscriptd3𝜎superscriptd3𝑝\displaystyle E\,\frac{\mathrm{d}^{3}\sigma}{\mathrm{d}^{3}p} =\displaystyle= σ0ΔmN0exp[b0tln(s/s0)]subscript𝜎0Δsuperscript𝑚subscript𝑁0subscript𝑏0𝑡𝑠subscript𝑠0\displaystyle\sigma_{0}\cdot\Delta m^{N_{0}}\cdot\exp{[b_{0}t\cdot\ln{(s/s_{0})}]} (14)
=\displaystyle= σ0ΔmN0(s/s0)b0t,subscript𝜎0Δsuperscript𝑚subscript𝑁0superscript𝑠subscript𝑠0subscript𝑏0𝑡\displaystyle\sigma_{0}\cdot\Delta m^{N_{0}}\cdot(s/s_{0})^{b_{0}t}\ ,

with fitted parameters as summarised in Table 3. The term ΔmN0Δsuperscript𝑚subscript𝑁0\Delta m^{N_{0}} reflects a phase-space behaviour σΔmN0=Δm(3n5)/2proportional-to𝜎Δsuperscript𝑚subscript𝑁0Δsuperscript𝑚3𝑛52\sigma\propto\Delta m^{N_{0}}=\Delta m^{(3n-5)/2} with n𝑛n particles in the final state.

As can be seen from Fig. 8, the parameterisation from Eq. (14) can describe all available data on K+superscript𝐾K^{+} production in pA𝑝𝐴pA reactions, obtained at various detection angles and in different momentum domains, within a factor 23similar-toabsent23\sim 2-3. Within this uncertainty the cross sections from ANKE are in agreement with those from other experiments. Furthermore, the parameterisation given by Eq. (14) supplies a Lorentz-invariant description of all available data which is independent of the choice of the reference system, pp𝑝𝑝pp or pA𝑝𝐴pA.

Table 3: Parameters obtained from a fit with Eq. (14).
Tpsubscript𝑇𝑝T_{p} σ0subscript𝜎0\sigma_{0} N0subscript𝑁0N_{0} (n)𝑛(n) b0subscript𝑏0b_{0} s0subscript𝑠0s_{0}
(GeV) (nbGeV2c3sr1nbsuperscriptGeV2superscriptc3superscriptsr1\mathrm{nb}\ \mathrm{GeV}^{-2}\mathrm{c}^{3}\mathrm{sr}^{-1}) (GeV-2) (GeV2)
<1.58absent1.58{<}1.58 25 17 (13)
2.2 100
>1.58absent1.58{>}1.58 1000 9.5 (8)

The fitted parameters together with Fig. 8 reveal the following kinematical features of K+superscript𝐾K^{+}-production processes in nuclei:

  • The kinematical limit for the production of K+superscript𝐾K^{+}-mesons in a pA𝑝𝐴pA reaction is at Δmmin=mΛ=1.116Δsubscript𝑚minsubscript𝑚Λ1.116\Delta m_{\mathrm{min}}=m_{\Lambda}=1.116 GeV/c2. In this limiting case only a ΛΛ\Lambda-Hyperon is produced and no energy can be transferred to excite the target nucleus or knock out target nucleons. The initial target nucleus must take part in the reaction as a whole such that the effective target mass is 12mN12subscript𝑚𝑁12\cdot m_{N}. There are only two particles, K+superscript𝐾K^{+}-meson and hypernucleus, in the final state (corresponding to n=2𝑛2n=2).

  • For excitation energies ΔmΔ𝑚\Delta m between 1.173 GeV/c2 (i.e. data point from ANKE at Tp=1.0subscript𝑇𝑝1.0T_{p}=1.0 GeV and pK+=507subscript𝑝superscript𝐾507p_{K^{+}}=507 MeV/c) and 1.7similar-toabsent1.7\sim 1.7 GeV/c2 (beam energies below TNN=1.58subscript𝑇𝑁𝑁1.58T_{NN}=1.58 GeV) the production cross sections steeply rise. Within the phase-space treatment of the data (N0=17subscript𝑁017N_{0}=17, n=13𝑛13n=13) this indicates that all 12 nucleons plus the ΛΛ\Lambda-hyperon should carry away energy in the final state.

  • At higher excitation energies Δm2.0greater-than-or-equivalent-toΔ𝑚2.0\Delta m\gtrsim 2.0 GeV/c2 (Tp>1.58subscript𝑇𝑝1.58T_{p}>1.58 GeV) the rise of the cross sections becomes less steep (N0=9.5subscript𝑁09.5N_{0}=9.5, n=8𝑛8n=8).

These kinematical features can be linked to the mechanisms leading to K+superscript𝐾K^{+} production in pA𝑝𝐴pA interactions:

  1. 1.

    The 1.0 GeV ANKE data were obtained very close to the kinematical limit at Δmmin=mΛ=1.116Δsubscript𝑚minsubscript𝑚Λ1.116\Delta m_{\mathrm{min}}=m_{\Lambda}=1.116 GeV/c2. If the measurements were extended to even larger kaon momenta or to smaller beam energies (i.e. closer to the kinematical limit) the steep drop of the cross sections (n=13𝑛13n=13) would end in the regime of hypernucleus production where n=2𝑛2n=2 is expected.

  2. 2.

    The simple phase-space description of the final state with n=13𝑛13n=13 indicates that below threshold the K+superscript𝐾K^{+}-production mechanisms have to transfer energy to all 12 target nucleons and the produced hyperon. However, this approach neglects collective effects in the initial target nucleus. Thus the steep drop of the cross sections might also reflect the fact that more and more nucleons must take part in the kaon-production process when approaching the kinematical limit (up to 12mN12subscript𝑚𝑁12\cdot m_{N}). In fact, the ANKE data at 1.0 GeV reveal a high degree of collectivity in the target nucleus (see Ref. ANKE_1.0GeV ). For example, if the kaons are produced in a collision of the 1.0 GeV beam proton with a single target nucleon, internal momenta of at least 550similar-toabsent550\sim 550 MeV/c are needed in order to produce kaons in the forward direction with momenta of pK+500similar-tosubscript𝑝superscript𝐾500p_{K^{+}}\sim 500 MeV/c. Such high momentum components are essentially due to many-body correlations in the nucleus. Within a very simple phase-space approximation (which neglects the intrinsic motion of the target nucleons) it can be shown that the number of participating target nucleons must be 56similar-toabsent56\sim 5-6 ANKE_1.0GeV . It has been suggested rudy ; pnpi ; cassing ; roc ; sibirtsev ; paryev ; cassing99 that such effects can be described in terms of multi-step mechanisms or high-momentum components in the nuclear wave function.

  3. 3.

    The different slope parameters below and above the free NN𝑁𝑁NN threshold indicate a change of the K+superscript𝐾K^{+}-production mechanism. This has been proposed long ago in Ref. pnpi and is confirmed by microscopical model calculations rudy ; cassing ; roc ; sibirtsev ; paryev ; cassing99 and recent K+dsuperscript𝐾𝑑K^{+}d coincidence measurements with ANKE correlation_paper . These suggest that below threshold the kaons are dominantly produced in two-step reactions with intermediate pion formation, whereas at higher energies direct K+superscript𝐾K^{+} production on a single nucleon prevails.

5 Inclusive 𝑲+superscript𝑲K^{+} cross sections from 𝒑𝒑p\,D interactions

K+superscript𝐾K^{+}-production in p𝑝p\,D interactions was measured at two beam energies, Tp=1.83subscript𝑇𝑝1.83T_{p}=1.83 and 2.02 GeV. ANKE was operated in the 1.45 T and 1.6 T modes and the vertical and horizontal kaon detection angles were restricted to ϑ<4italic-ϑsuperscript4\vartheta<4^{\circ}. For absolute normalisation of the cross sections the luminosity \mathcal{L} has been determined with the help of events from pd𝑝𝑑pd elastic scattering. These have been measured with the ANKE spectator-detection system; details of the detectors and the normalisation procedure are described in Ref. Spectator . The overall systematic uncertainty in the absolute normalisation is 20%. All other analysis procedures are in accord with those for the heavier targets described in Sect. 2.1.

Figure 9 shows the K+superscript𝐾K^{+}-momentum spectra measured at beam energies Tp=1.83subscript𝑇𝑝1.83T_{p}=1.83 GeV and 2.02 GeV on the deuteron target and at 2.0 GeV on carbon. The difference between the p𝑝p\,D cross sections can be attributed to the fact that the lower energy is significantly closer to the free nucleon-nucleon threshold. The different p𝑝p\,D and p𝑝p\,C cross sections at Tp=2.0subscript𝑇𝑝2.0T_{p}=2.0 GeV can be explained in the framework of the Glauber model Glauber . In this model, beam protons effectively “sees” 7.3 nucleons in a carbon target rudy ; pnpi . Thus the ratio of the p𝑝p\,C and p𝑝p\,D cross sections should be about 3.5, which is confirmed by the data. This finding suggests that at Tp=2.0subscript𝑇𝑝2.0T_{p}=2.0 GeV kaons are produced on individual nucleons both in deuteron and carbon targets. There is no indication for any collective target behaviour. Furthermore, shadowing effects in the deuteron are smaller than 5% Chiavassa . Therefore, for the following analysis, which is carried out in a simple phase-space approach, we assume σD=σp+σnsubscript𝜎𝐷subscript𝜎𝑝subscript𝜎𝑛\sigma_{D}=\sigma_{p}+\sigma_{n}, with σn/σpsubscript𝜎𝑛subscript𝜎𝑝\sigma_{n}/\sigma_{p} being a free parameter.

Refer to caption
Figure 9: Double differential cross sections for K+superscript𝐾K^{+} production on a deuteron target measured at Tp=1.83subscript𝑇𝑝1.83T_{p}=1.83 and 2.02 GeV (c.f. Table 10) and on a carbon target at 2.0 GeV (c.f. Table 4).

Following the analysis in Ref. Tsushima of different inclusive reactions giving rise to K+superscript𝐾K^{+}-production, six main reaction channels lead to kaon production on the deuteron at our beam energies. They are listed in Table 11 together with the corresponding cross sections which have been calculated using the parameterisations given in Ref. Tsushima . The calculated value for σ(pppK+Λ)𝜎𝑝𝑝𝑝superscript𝐾Λ\sigma(pp\to pK^{+}\Lambda) at 2.0 GeV is in agreement with the experimental result from Ref. Baldini . For the simulation of phase-space distributed pDK+X𝑝Dsuperscript𝐾𝑋p\mathrm{D}\to K^{+}X events, the PLUTO package PLUTO , which takes into account the intrinsic motion of the nucleons in the deuteron, has been used. The events have been generated for each reaction channel and weighted according to the total cross sections from Table 11. Each event subsequently has been tracked through the spectrometer dipole and all detection efficiencies have been taken into account. A comparison of the simulated spectra with the data is shown in Fig. 10 (curve labelled by “σn=2σpsubscript𝜎𝑛2subscript𝜎𝑝\sigma_{n}=2\sigma_{p}”).

Refer to caption
Figure 10: Double differential pDK+X𝑝Dsuperscript𝐾𝑋p\mathrm{D}\to K^{+}X cross section at 1.83 GeV and at 2.02 GeV in comparison with our model calculations using different ratios σn/σpsubscript𝜎𝑛subscript𝜎𝑝\sigma_{n}/\sigma_{p} (lines).

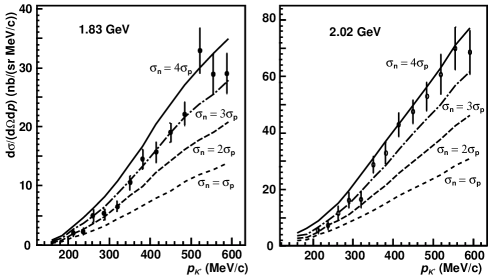
The apparent difference between the calculated and measured cross sections can be due to the following reasons: our simple approach does not take into account the dynamics of the interaction in the different states (such as initial- and final-state interactions) and the ratio σn/σpsubscript𝜎𝑛subscript𝜎𝑝\sigma_{n}/\sigma_{p} might be different from that suggested in Ref. Tsushima . Thus we repeated the simulations keeping the relative weights of the three pp𝑝𝑝pp and pn𝑝𝑛pn channels constant (as given in Table 11) while treating the ratio of the sum of these two contributions, i.e. σn/σpsubscript𝜎𝑛subscript𝜎𝑝\sigma_{n}/\sigma_{p}, as a free parameter. The result of the simulations with different ratios σn/σpsubscript𝜎𝑛subscript𝜎𝑝\sigma_{n}/\sigma_{p} is also shown in Fig. 10. The best agreement between data and calculations is obtained for σn/σp3similar-tosubscript𝜎𝑛subscript𝜎𝑝3\sigma_{n}/\sigma_{p}\sim 3 at 1.83 GeV and σn/σp4similar-tosubscript𝜎𝑛subscript𝜎𝑝4\sigma_{n}/\sigma_{p}\sim 4 at 2.02 GeV.

6 Summary and outlook

In this paper we present the full set of inclusive data on pAK+X𝑝𝐴superscript𝐾𝑋pA\to K^{+}X reactions measured at forward angles with the ANKE spectrometer at COSY-Jülich. Far below the free nucleon-nucleon threshold there must be a strong collective behaviour of the target nuclei, whereas a change of the reaction mechanism is observed at higher energies. For a better understanding of the reaction mechanisms further microscopical model calculations should be performed. Such calculations are also needed to extract the precise value of the in-medium nuclear K+superscript𝐾K^{+}-potential from the cross-section ratios R𝑅R(A𝐴A/C) measured at ANKE.

The inclusive K+superscript𝐾K^{+} cross sections from ANKE are compatible with those obtained at other facilities. All data sets together now cover a wide kinematical range, i.e. beam energies, kaon momenta and emission angles. We currently do not foresee further inclusive measurements since we regard the existing data sets — in particular with recent results from the KaoS collaboration obtained at larger kaon-emission angles scheinast — as being largely sufficient. However, we expect that significant progress for the understanding of the K+superscript𝐾K^{+}-production mechanisms will come from correlation data, where the produced kaons are measured in coincidence with protons, deuterons and other light fragments. A first step in this direction has already been made at ANKE. Data on the reaction pCK+dX𝑝Csuperscript𝐾𝑑𝑋p\mathrm{C}\to K^{+}dX at 1.2 GeV provide the first direct indication for kaon production in the particular two-step reaction pN1πd𝑝subscript𝑁1𝜋𝑑pN_{1}\to\pi d, πN2K+Λ𝜋subscript𝑁2superscript𝐾Λ\pi N_{2}\to K^{+}\Lambda with formation of intermediate pions in the target nucleus correlation_paper . The data also hint on processes involving p(2N)K+dΛ𝑝2𝑁superscript𝐾𝑑Λp(2N)\to K^{+}d\Lambda reactions on two-nucleon clusters.

First correlation measurements have also been performed using deuteron targets. A preliminary analysis of the proton-momentum spectra from pDK+pX𝑝Dsuperscript𝐾𝑝𝑋p\mathrm{D}\to K^{+}pX events confirm our present conclusion from the inclusive data that the K+superscript𝐾K^{+}-production cross section on neutrons is significantly larger than on protons mazurian . This finding should be taken into account in future model calculations, especially of K+superscript𝐾K^{+} production in heavy ion reactions.

It is also planned to measure at ANKE the production of K+Ksuperscript𝐾superscript𝐾K^{+}K^{-} pairs in pA𝑝𝐴pA collisions. It can be expected that the measurement of low-momentum kaons offers the unique possibility to determine the nuclear Ksuperscript𝐾K^{-}-potential for normal nuclear density with similar accuracy to that of the K+superscript𝐾K^{+}-mesons.

Acknowledgements

This work profitted significantly from discussions with members of the ANKE collaboration, in particular W. Cassing, A. Sibirtsev and C. Wilkin. We are also grateful to R. Schleichert as the technical coordinator of ANKE and to C. Wilkin for carefully reading the manuscript. Financial support from the following funding agencies was of indispensable help for building ANKE, its detectors and DAQ: Germany (BMBF: grants WTZ-RUS-649-96, WTZ-RUS-666-97, WTZ-RUS-685-99, WTZ-POL-007-99, WTZ-POL-015-01, WTZ-POL-041-01; DFG: 436 RUS 113/ 337, 436 RUS 113/444, 436 RUS 113/561, State of North-Rhine Westfalia), Poland (Polish State Committee for Scientific Research: 2 P03B 101 19), Russia (Russian Ministry of Science: FNP-125.03, Russian Academy of Science: 99-02-04034, 99-02-18179a) and European Community (INTAS-98-500).

References

  • (1) S. Barsov et al., Nucl. Instr. Methods Phys. Res., Sect. A 462, 364 (2001).
  • (2) V. Koptev et al., Phys. Rev. Lett. 87, 022301 (2001).
  • (3) M. Nekipelov et al., Phys. Lett. B 540, 207 (2002).
  • (4) G. Wolf et al., Nucl. Phys. A 552, 549 (1993).
  • (5) Z. Rudy et al., Eur. Phys. J. A 15, 303 (2002).
  • (6) P.A. Piroué and A. J. S. Smith, Phys. Rev. 148, 1315 (1966).
  • (7) K. Tsushima et al., Phys. Rev. C, 59, 369 (1999).
  • (8) G. Fäldt and C. Wilkin, Z. Phys. A 357, 241 (1997).
  • (9) R. Maier, Nucl. Instr. Methods Phys. Res., Sect. A 390, 1 (1997).
  • (10) H. Dombrowski et al., Nucl. Instr. Methods Phys. Res.  Sect. A 386, 228 (1997); A. Khoukaz et al., Eur. Phys. J. D 5, 275 (1999).
  • (11) I. Lehmann, Ph.D. thesis, Universität zu Köln (2003); I. Lehmann et al., Nucl. Instr. Methods Phys. Res., Sect. A (in preparation).
  • (12) M. Büscher et al., Nucl. Instr. Methods Phys. Res., Sect. A 481, 378 (2002).
  • (13) V. Koptev et al., JETP 67, 2177 (1988).
  • (14) V.V. Abaev et al., J. Phys. G 14, 903 (1988).
  • (15) J. Papp et al., Phys. Rev. Lett. 34, 601 (1975).
  • (16) K. Hagiwara et al. (Particle Data Group), Phys. Rev. D 66, 010001 (2002).
  • (17) V. Kleber et al., Phys. Rev. Lett. 91, 172304 (2003).
  • (18) D.R.F. Cochran et al., Phys. Rev. D 6, 3085 (1972).
  • (19) M. Büscher et al., Phys. Rev. C 65, 014603 (2001).
  • (20) W. Cassing et al., Phys. Lett. B 238, 25 (1990).
  • (21) H. Müller and K. Sistemich, Z. Phys. A 344, 197 (1992).
  • (22) A.A. Sibirtsev and M. Büscher, Z. Phys. A 347, 191 (1994).
  • (23) E.Ya. Paryev, Eur. Phys. J. A 5, 307 (1999).
  • (24) W. Cassing and E. Bratkovskaya, Phys. Rep. 308, 65 (1999).
  • (25) A. Sibirtsev and W. Cassing, Nucl. Phys. A 641, 476 (1998).
  • (26) Z. Rudy et al., (in preparation).
  • (27) S. Schnetzer et al., Phys. Rev. C 40, 640 (1989).
  • (28) M. Debowski et al., Z. Phys. A 356, 313 (1996).
  • (29) A. Badalà et al., Phys. Rev. Lett. 80, 4863 (1998).
  • (30) A.V. Akindinov et al., JETP Lett. 72, 150 (2000).
  • (31) M. Büscher et al., Z. Phys. A 355, 93 (1996).
  • (32) W. Scheinast, KaoS Collaboration, Proc. 7thsuperscript7th7^{\mathrm{th}} Int. Workshop on Meson Production, Properties and Interaction MESON2002, 24 – 28 May 2002, Cracow, Poland; World Scientific Publishing, ISBN 981-238-160-0, L. Jarczyk, A. Magiera, C. Guaraldo, H. Machner, (editors), p. 493 (2003); and private communication.
  • (33) A.B. Kaidalov and L.A. Kondratyuk, Nucl. Phys. B 57, 100 (1973); A.B. Kaidalov, Phys. Rep. 50, 157 (1979).
  • (34) V. Koptev et al., Eur. Phys. J. A 17, 235 (2003).
  • (35) V. Franco and R.J. Glauber, Phys. Rev. 142, 1195 (1966).
  • (36) E. Chiavassa et al., Phys. Lett. B, 337, 192 (1994).
  • (37) A. Baldini et al., Total Cross Sections of High Energy Particles, Vol.12 of Landolt-Börnstein, Numerical Data and Functional Relationships in Science and Technology, edited by H. Schopper (Springer-Verlag, Berlin, 1988).
  • (38) http://www-hades.gsi.de/computing/pluto/html/PlutoIndex.htm.
  • (39) M. Büscher, Proc. XXVIII Mazurian Lakes Conference on Physics, Atomic Nucleus as a Laboratory for Fundamental Processes, 31 August – 7 September 2003, Krzyze, Poland; Acta Physica Polonica, in print; arXiv:nucl-ex/0311018.

Appendix

Table 4: Double differential cross sections for p12CK+Xsuperscript𝑝12Csuperscript𝐾𝑋p^{12}\mathrm{C}\rightarrow K^{+}X reactions obtained with the 1.3 T mode. The errors do not include the systematic uncertainties from the normalisation to pion data.
pK+subscript𝑝superscript𝐾p_{K^{+}} d2σ/dΩdpsuperscriptd2𝜎dΩd𝑝\mathrm{d}^{2}\sigma/\mathrm{d}\Omega\mathrm{d}p (nb/(sr MeV/c))
(MeV/c) Tp=1.0subscript𝑇𝑝1.0T_{p}{=}1.0 GeV 1.2 GeV 2.0 GeV 2.3 GeV
171±11plus-or-minus17111171\pm 11 0.073±0.027plus-or-minus0.0730.0270.073\pm 0.027 0.60±0.18plus-or-minus0.600.180.60\pm 0.18 9.9±1.8plus-or-minus9.91.89.9\pm 1.8 11.9±2.9plus-or-minus11.92.911.9\pm 2.9
192±12plus-or-minus19212192\pm 12 0.073±0.048plus-or-minus0.0730.0480.073\pm 0.048 0.88±0.19plus-or-minus0.880.190.88\pm 0.19 18.6±1.8plus-or-minus18.61.818.6\pm 1.8 27.9±4.3plus-or-minus27.94.327.9\pm 4.3
216±11plus-or-minus21611216\pm 11 0.125±0.028plus-or-minus0.1250.0280.125\pm 0.028 1.41±0.23plus-or-minus1.410.231.41\pm 0.23 24.7±2.1plus-or-minus24.72.124.7\pm 2.1 45.6±5.1plus-or-minus45.65.145.6\pm 5.1
240±12plus-or-minus24012240\pm 12 0.132±0.032plus-or-minus0.1320.0320.132\pm 0.032 1.46±0.21plus-or-minus1.460.211.46\pm 0.21 28.3±2.3plus-or-minus28.32.328.3\pm 2.3 51.4±5.4plus-or-minus51.45.451.4\pm 5.4
266±14plus-or-minus26614266\pm 14 0.178±0.052plus-or-minus0.1780.0520.178\pm 0.052 2.47±0.26plus-or-minus2.470.262.47\pm 0.26 45.7±2.9plus-or-minus45.72.945.7\pm 2.9 75.5±6.8plus-or-minus75.56.875.5\pm 6.8
295±15plus-or-minus29515295\pm 15 0.270±0.036plus-or-minus0.2700.0360.270\pm 0.036 2.73±0.28plus-or-minus2.730.282.73\pm 0.28 54.1±3.0plus-or-minus54.13.054.1\pm 3.0 89.9±6.7plus-or-minus89.96.789.9\pm 6.7
325±15plus-or-minus32515325\pm 15 0.337±0.045plus-or-minus0.3370.0450.337\pm 0.045 4.82±0.41plus-or-minus4.820.414.82\pm 0.41 86.0±5.4plus-or-minus86.05.486.0\pm 5.4 138±12plus-or-minus13812138\pm 12
355±15plus-or-minus35515355\pm 15 0.302±0.036plus-or-minus0.3020.0360.302\pm 0.036 6.02±0.54plus-or-minus6.020.546.02\pm 0.54 99.8±6.8plus-or-minus99.86.899.8\pm 6.8 158±13plus-or-minus15813158\pm 13
385±15plus-or-minus38515385\pm 15 0.330±0.053plus-or-minus0.3300.0530.330\pm 0.053 6.76±0.52plus-or-minus6.760.526.76\pm 0.52 115.9±7.5plus-or-minus115.97.5115.9\pm 7.5 188±15plus-or-minus18815188\pm 15
415±15plus-or-minus41515415\pm 15 0.257±0.038plus-or-minus0.2570.0380.257\pm 0.038 6.89±0.61plus-or-minus6.890.616.89\pm 0.61 145±11plus-or-minus14511145\pm 11 245±22plus-or-minus24522245\pm 22
445±15plus-or-minus44515445\pm 15 0.201±0.066plus-or-minus0.2010.0660.201\pm 0.066 9.61±0.85plus-or-minus9.610.859.61\pm 0.85 186±14plus-or-minus18614186\pm 14 310±28plus-or-minus31028310\pm 28
475±15plus-or-minus47515475\pm 15 0.165±0.047plus-or-minus0.1650.0470.165\pm 0.047 8.21±0.61plus-or-minus8.210.618.21\pm 0.61 194.4±9.5plus-or-minus194.49.5194.4\pm 9.5 313±23plus-or-minus31323313\pm 23
507±17plus-or-minus50717507\pm 17 0.088±0.042plus-or-minus0.0880.0420.088\pm 0.042 6.44±0.73plus-or-minus6.440.736.44\pm 0.73 220±12plus-or-minus22012220\pm 12 389±30plus-or-minus38930389\pm 30
Table 5: Double differential cross sections for p12CK+Xsuperscript𝑝12Csuperscript𝐾𝑋p^{12}\mathrm{C}\rightarrow K^{+}X reactions obtained with the 1.6 T mode. The errors do not include the systematic uncertainties from the normalisation to pion data.
pK+subscript𝑝superscript𝐾p_{K^{+}} d2σ/dΩdpsuperscriptd2𝜎dΩd𝑝\mathrm{d}^{2}\sigma/\mathrm{d}\Omega\mathrm{d}p (nb/(sr MeV/c))
(MeV/c) Tp=1.2subscript𝑇𝑝1.2T_{p}=1.2 GeV 1.5 GeV 2.3 GeV
209±6plus-or-minus2096209\pm 6 1.28±0.40plus-or-minus1.280.401.28\pm 0.40 14.0±2.9plus-or-minus14.02.914.0\pm 2.9 73.2±9.7plus-or-minus73.29.773.2\pm 9.7
233±6plus-or-minus2336233\pm 6 2.07±0.50plus-or-minus2.070.502.07\pm 0.50 14.8±2.7plus-or-minus14.82.714.8\pm 2.7 78±11plus-or-minus781178\pm 11
259±6plus-or-minus2596259\pm 6 2.82±0.58plus-or-minus2.820.582.82\pm 0.58 17.1±3.3plus-or-minus17.13.317.1\pm 3.3 105±17plus-or-minus10517105\pm 17
285±6plus-or-minus2856285\pm 6 3.51±0.58plus-or-minus3.510.583.51\pm 0.58 21.5±3.2plus-or-minus21.53.221.5\pm 3.2 128±16plus-or-minus12816128\pm 16
315±6plus-or-minus3156315\pm 6 5.52±0.77plus-or-minus5.520.775.52\pm 0.77 42.0±5.0plus-or-minus42.05.042.0\pm 5.0 164±17plus-or-minus16417164\pm 17
346±6plus-or-minus3466346\pm 6 6.41±0.81plus-or-minus6.410.816.41\pm 0.81 48.5±5.6plus-or-minus48.55.648.5\pm 5.6 238±24plus-or-minus23824238\pm 24
378±6plus-or-minus3786378\pm 6 6.96±0.70plus-or-minus6.960.706.96\pm 0.70 58.0±5.5plus-or-minus58.05.558.0\pm 5.5 264±22plus-or-minus26422264\pm 22
415±6plus-or-minus4156415\pm 6 8.29±0.70plus-or-minus8.290.708.29\pm 0.70 68.2±5.6plus-or-minus68.25.668.2\pm 5.6 321±23plus-or-minus32123321\pm 23
450±6plus-or-minus4506450\pm 6 7.94±0.79plus-or-minus7.940.797.94\pm 0.79 77.1±7.4plus-or-minus77.17.477.1\pm 7.4 351±31plus-or-minus35131351\pm 31
486±6plus-or-minus4866486\pm 6 7.24±0.59plus-or-minus7.240.597.24\pm 0.59 84.4±6.7plus-or-minus84.46.784.4\pm 6.7 373±27plus-or-minus37327373\pm 27
521±6plus-or-minus5216521\pm 6 6.88±0.53plus-or-minus6.880.536.88\pm 0.53 87.8±6.5plus-or-minus87.86.587.8\pm 6.5 416±26plus-or-minus41626416\pm 26
557±6plus-or-minus5576557\pm 6 6.09±0.73plus-or-minus6.090.736.09\pm 0.73 99±11plus-or-minus991199\pm 11 491±48plus-or-minus49148491\pm 48
595±6plus-or-minus5956595\pm 6 4.40±0.55plus-or-minus4.400.554.40\pm 0.55 82.2±8.4plus-or-minus82.28.482.2\pm 8.4 428±38plus-or-minus42838428\pm 38
Table 6: Cross section ratios A𝐴A/C measured at Tp=1.0subscript𝑇𝑝1.0T_{p}=1.0 GeV with the 1.3 T mode. The error bars include the statistical and systematic uncertainties.
pK+subscript𝑝superscript𝐾p_{K^{+}} (MeV/c) Ratio
Cu/C Au/C
216±11plus-or-minus21611216\pm 11 2.05±1.30plus-or-minus2.051.302.05\pm 1.30 4.65±3.60plus-or-minus4.653.604.65\pm 3.60
240±12plus-or-minus24012240\pm 12 3.60±1.25plus-or-minus3.601.253.60\pm 1.25 5.70±3.30plus-or-minus5.703.305.70\pm 3.30
266±14plus-or-minus26614266\pm 14 3.40±1.10plus-or-minus3.401.103.40\pm 1.10 5.35±2.55plus-or-minus5.352.555.35\pm 2.55
295±15plus-or-minus29515295\pm 15 3.95±0.85plus-or-minus3.950.853.95\pm 0.85 6.20±1.90plus-or-minus6.201.906.20\pm 1.90
325±15plus-or-minus32515325\pm 15 3.85±1.00plus-or-minus3.851.003.85\pm 1.00 6.20±2.05plus-or-minus6.202.056.20\pm 2.05
355±15plus-or-minus35515355\pm 15 4.10±0.95plus-or-minus4.100.954.10\pm 0.95 7.40±2.05plus-or-minus7.402.057.40\pm 2.05
385±15plus-or-minus38515385\pm 15 4.65±0.95plus-or-minus4.650.954.65\pm 0.95 8.25±2.10plus-or-minus8.252.108.25\pm 2.10
415±15plus-or-minus41515415\pm 15 4.95±0.95plus-or-minus4.950.954.95\pm 0.95 9.10±2.30plus-or-minus9.102.309.10\pm 2.30
445±15plus-or-minus44515445\pm 15 5.15±1.50plus-or-minus5.151.505.15\pm 1.50 7.40±3.20plus-or-minus7.403.207.40\pm 3.20
475±15plus-or-minus47515475\pm 15 4.10±1.30plus-or-minus4.101.304.10\pm 1.30 5.50±2.55plus-or-minus5.502.555.50\pm 2.55
507±17plus-or-minus50717507\pm 17 4.70±2.10plus-or-minus4.702.104.70\pm 2.10 10.55±7.15plus-or-minus10.557.1510.55\pm 7.15
Table 7: Cross section ratios Au/C measured at Tp=1.5subscript𝑇𝑝1.5T_{p}=1.5 GeV with the 1.6 T mode. The error bars include the statistical and systematic uncertainties.
pK+subscript𝑝superscript𝐾p_{K^{+}} (MeV/c) Ratio
Au/C
184±8plus-or-minus1848184\pm 8 3.18±0.94plus-or-minus3.180.943.18\pm 0.94
209±11plus-or-minus20911209\pm 11 4.75±0.71plus-or-minus4.750.714.75\pm 0.71
233±11plus-or-minus23311233\pm 11 6.71±0.61plus-or-minus6.710.616.71\pm 0.61
260±12plus-or-minus26012260\pm 12 6.40±0.39plus-or-minus6.400.396.40\pm 0.39
285±13plus-or-minus28513285\pm 13 5.68±0.36plus-or-minus5.680.365.68\pm 0.36
315±14plus-or-minus31514315\pm 14 4.76±0.27plus-or-minus4.760.274.76\pm 0.27
347±14plus-or-minus34714347\pm 14 4.96±0.22plus-or-minus4.960.224.96\pm 0.22
378±14plus-or-minus37814378\pm 14 4.42±0.18plus-or-minus4.420.184.42\pm 0.18
412±14plus-or-minus41214412\pm 14 4.33±0.17plus-or-minus4.330.174.33\pm 0.17
448±14plus-or-minus44814448\pm 14 4.11±0.16plus-or-minus4.110.164.11\pm 0.16
485±15plus-or-minus48515485\pm 15 3.82±0.15plus-or-minus3.820.153.82\pm 0.15
522±15plus-or-minus52215522\pm 15 3.70±0.18plus-or-minus3.700.183.70\pm 0.18
560±16plus-or-minus56016560\pm 16 3.74±0.23plus-or-minus3.740.233.74\pm 0.23
596±16plus-or-minus59616596\pm 16 3.88±0.27plus-or-minus3.880.273.88\pm 0.27
Table 8: Cross section ratios Au/C measured at Tp=1.75subscript𝑇𝑝1.75T_{p}=1.75 GeV with the 1.6 T mode. The error bars include the statistical and systematic uncertainties.
pK+subscript𝑝superscript𝐾p_{K^{+}} (MeV/c) Ratio
Au/C
158±8plus-or-minus1588158\pm 8 1.96±2.00plus-or-minus1.962.001.96\pm 2.00
184±8plus-or-minus1848184\pm 8 4.00±1.41plus-or-minus4.001.414.00\pm 1.41
209±11plus-or-minus20911209\pm 11 6.24±0.73plus-or-minus6.240.736.24\pm 0.73
233±11plus-or-minus23311233\pm 11 9.61±1.02plus-or-minus9.611.029.61\pm 1.02
260±12plus-or-minus26012260\pm 12 8.15±0.49plus-or-minus8.150.498.15\pm 0.49
285±12plus-or-minus28512285\pm 12 7.01±0.42plus-or-minus7.010.427.01\pm 0.42
315±13plus-or-minus31513315\pm 13 6.23±0.33plus-or-minus6.230.336.23\pm 0.33
347±14plus-or-minus34714347\pm 14 5.38±0.24plus-or-minus5.380.245.38\pm 0.24
378±14plus-or-minus37814378\pm 14 4.83±0.20plus-or-minus4.830.204.83\pm 0.20
412±14plus-or-minus41214412\pm 14 4.65±0.18plus-or-minus4.650.184.65\pm 0.18
448±15plus-or-minus44815448\pm 15 4.64±0.18plus-or-minus4.640.184.64\pm 0.18
485±15plus-or-minus48515485\pm 15 4.19±0.16plus-or-minus4.190.164.19\pm 0.16
522±15plus-or-minus52215522\pm 15 4.12±0.18plus-or-minus4.120.184.12\pm 0.18
560±16plus-or-minus56016560\pm 16 3.85±0.21plus-or-minus3.850.213.85\pm 0.21
596±16plus-or-minus59616596\pm 16 3.76±0.24plus-or-minus3.760.243.76\pm 0.24
Table 9: Cross section ratios A𝐴A/C measured at Tp=2.3subscript𝑇𝑝2.3T_{p}=2.3 GeV and different D2 operation modes. The error bars include the statistical and systematic uncertainties.
pK+subscript𝑝superscript𝐾p_{K^{+}} (MeV/c) Ratio
B=1.3𝐵1.3B=1.3 T 1.6 T Cu/C Ag/C Au/C
153±9plus-or-minus1539153\pm 9 2.54±0.30plus-or-minus2.540.302.54\pm 0.30 2.62±0.33plus-or-minus2.620.332.62\pm 0.33
158±8plus-or-minus1588158\pm 8 3.62±1.11plus-or-minus3.621.113.62\pm 1.11 2.98±0.82plus-or-minus2.980.822.98\pm 0.82
175±11plus-or-minus17511175\pm 11 3.63±0.28plus-or-minus3.630.283.63\pm 0.28 4.21±0.29plus-or-minus4.210.294.21\pm 0.29 5.40±2.25plus-or-minus5.402.255.40\pm 2.25
182±8plus-or-minus1828182\pm 8 5.53±0.53plus-or-minus5.530.535.53\pm 0.53 4.96±0.45plus-or-minus4.960.454.96\pm 0.45
196±11plus-or-minus19611196\pm 11 3.86±0.17plus-or-minus3.860.173.86\pm 0.17 5.03±0.22plus-or-minus5.030.225.03\pm 0.22 7.44±0.89plus-or-minus7.440.897.44\pm 0.89
208±11plus-or-minus20811208\pm 11 6.17±0.31plus-or-minus6.170.316.17\pm 0.31 8.24±0.38plus-or-minus8.240.388.24\pm 0.38
218±11plus-or-minus21811218\pm 11 4.16±0.14plus-or-minus4.160.144.16\pm 0.14 6.04±0.20plus-or-minus6.040.206.04\pm 0.20 9.14±0.72plus-or-minus9.140.729.14\pm 0.72
233±11plus-or-minus23311233\pm 11 5.76±0.25plus-or-minus5.760.255.76\pm 0.25 9.95±0.40plus-or-minus9.950.409.95\pm 0.40
239±11plus-or-minus23911239\pm 11 3.86±0.13plus-or-minus3.860.133.86\pm 0.13 6.07±0.20plus-or-minus6.070.206.07\pm 0.20 10.84±0.72plus-or-minus10.840.7210.84\pm 0.72
259±12plus-or-minus25912259\pm 12 5.77±0.19plus-or-minus5.770.195.77\pm 0.19 10.05±0.34plus-or-minus10.050.3410.05\pm 0.34
264±12plus-or-minus26412264\pm 12 3.71±0.12plus-or-minus3.710.123.71\pm 0.12 5.67±0.18plus-or-minus5.670.185.67\pm 0.18 9.31±0.60plus-or-minus9.310.609.31\pm 0.60
285±12plus-or-minus28512285\pm 12 5.25±0.18plus-or-minus5.250.185.25\pm 0.18 8.57±0.29plus-or-minus8.570.298.57\pm 0.29
293±14plus-or-minus29314293\pm 14 3.57±0.10plus-or-minus3.570.103.57\pm 0.10 5.14±0.14plus-or-minus5.140.145.14\pm 0.14 7.91±0.47plus-or-minus7.910.477.91\pm 0.47
315±13plus-or-minus31513315\pm 13 4.59±0.15plus-or-minus4.590.154.59\pm 0.15 7.62±0.25plus-or-minus7.620.257.62\pm 0.25
317±14plus-or-minus31714317\pm 14 3.228±0.084plus-or-minus3.2280.0843.228\pm 0.084 4.51±0.12plus-or-minus4.510.124.51\pm 0.12 7.18±0.43plus-or-minus7.180.437.18\pm 0.43
345±15plus-or-minus34515345\pm 15 3.155±0.083plus-or-minus3.1550.0833.155\pm 0.083 4.28±0.12plus-or-minus4.280.124.28\pm 0.12 6.29±0.34plus-or-minus6.290.346.29\pm 0.34
350±14plus-or-minus35014350\pm 14 4.54±0.13plus-or-minus4.540.134.54\pm 0.13 6.75±0.20plus-or-minus6.750.206.75\pm 0.20
376±15plus-or-minus37615376\pm 15 3.032±0.076plus-or-minus3.0320.0763.032\pm 0.076 4.14±0.11plus-or-minus4.140.114.14\pm 0.11 6.16±0.34plus-or-minus6.160.346.16\pm 0.34
380±14plus-or-minus38014380\pm 14 4.20±0.11plus-or-minus4.200.114.20\pm 0.11 6.31±0.18plus-or-minus6.310.186.31\pm 0.18
407±15plus-or-minus40715407\pm 15 3.010±0.080plus-or-minus3.0100.0803.010\pm 0.080 3.94±0.11plus-or-minus3.940.113.94\pm 0.11 5.27±0.30plus-or-minus5.270.305.27\pm 0.30
413±14plus-or-minus41314413\pm 14 4.00±0.10plus-or-minus4.000.104.00\pm 0.10 5.74±0.16plus-or-minus5.740.165.74\pm 0.16
438±15plus-or-minus43815438\pm 15 2.702±0.079plus-or-minus2.7020.0792.702\pm 0.079 3.70±0.11plus-or-minus3.700.113.70\pm 0.11 4.59±0.34plus-or-minus4.590.344.59\pm 0.34
450±14plus-or-minus45014450\pm 14 3.73±0.10plus-or-minus3.730.103.73\pm 0.10 5.43±0.15plus-or-minus5.430.155.43\pm 0.15
468±15plus-or-minus46815468\pm 15 2.73±0.10plus-or-minus2.730.102.73\pm 0.10 3.60±0.13plus-or-minus3.600.133.60\pm 0.13 5.06±0.34plus-or-minus5.060.345.06\pm 0.34
487±15plus-or-minus48715487\pm 15 3.54±0.09plus-or-minus3.540.093.54\pm 0.09 4.97±0.14plus-or-minus4.970.144.97\pm 0.14
499±17plus-or-minus49917499\pm 17 2.49±0.11plus-or-minus2.490.112.49\pm 0.11 3.48±0.15plus-or-minus3.480.153.48\pm 0.15 4.63±0.34plus-or-minus4.630.344.63\pm 0.34
525±15plus-or-minus52515525\pm 15 3.45±0.10plus-or-minus3.450.103.45\pm 0.10 4.68±0.14plus-or-minus4.680.144.68\pm 0.14
560±16plus-or-minus56016560\pm 16 3.17±0.10plus-or-minus3.170.103.17\pm 0.10 4.50±0.14plus-or-minus4.500.144.50\pm 0.14
595±16plus-or-minus59516595\pm 16 3.26±0.11plus-or-minus3.260.113.26\pm 0.11 4.45±0.15plus-or-minus4.450.154.45\pm 0.15
Table 10: Double differential cross section for pDK+X𝑝Dsuperscript𝐾𝑋p\mathrm{D}\rightarrow K^{+}X reactions measured at 1.83 and 2.02 GeV with the 1.45 T and 1.6  T modes, respectively. The errors do not include the overall 20% systematic uncertainty from the determination of the luminosity.
pK+subscript𝑝superscript𝐾p_{K^{+}} (MeV/c) d2σ/dΩdpsuperscriptd2𝜎dΩd𝑝\mathrm{d}^{2}\sigma/\mathrm{d}\Omega\mathrm{d}p (nb/(sr MeV/c))
B=1.45𝐵1.45B=1.45 T 1.6 T Tp=1.83subscript𝑇𝑝1.83T_{p}=1.83 GeV 2.02 GeV
212±plus-or-minus\pm12 2.01±plus-or-minus\pm0.56
212±plus-or-minus\pm12 5.4±plus-or-minus\pm1.2
236±plus-or-minus\pm16 2.34±plus-or-minus\pm0.56
237±plus-or-minus\pm12 7.2±plus-or-minus\pm1.4
261±plus-or-minus\pm16 5.0±plus-or-minus\pm1.1
262±plus-or-minus\pm12 11.6±plus-or-minus\pm2.5
287±plus-or-minus\pm12 5.21±plus-or-minus\pm0.96
289±plus-or-minus\pm13 16.2±plus-or-minus\pm2.7
319±plus-or-minus\pm15 6.49±plus-or-minus\pm0.87
319±plus-or-minus\pm15 16.4±plus-or-minus\pm2.9
349±plus-or-minus\pm17 10.5±plus-or-minus\pm1.2
350±plus-or-minus\pm16 28.8±plus-or-minus\pm2.8
382±plus-or-minus\pm14 14.5±plus-or-minus\pm1.7
381±plus-or-minus\pm15 32.9±plus-or-minus\pm3.9
415±plus-or-minus\pm15 15.8±plus-or-minus\pm1.7
413±plus-or-minus\pm15 42.9±plus-or-minus\pm4.2
449±plus-or-minus\pm17 19.1±plus-or-minus\pm1.7
449±plus-or-minus\pm17 47.5±plus-or-minus\pm4.1
485±plus-or-minus\pm17 22.2±plus-or-minus\pm1.9
484±plus-or-minus\pm17 52.9±plus-or-minus\pm5.0
521±plus-or-minus\pm18 33.0±plus-or-minus\pm3.9
519±plus-or-minus\pm17 60.8±plus-or-minus\pm7.0
554±plus-or-minus\pm12 29.0±plus-or-minus\pm3.4
555±plus-or-minus\pm18 70.0±plus-or-minus\pm7.5
587±plus-or-minus\pm15 29.1±plus-or-minus\pm3.4
591±plus-or-minus\pm18 68.6±plus-or-minus\pm7.8
Table 11: Relevant reaction channels for K+superscript𝐾K^{+} production on deuterons and the corresponding total cross sections calculated according to the parameterisation taken from Ref. Tsushima .
σ𝜎\sigma (μ𝜇\mub)   
Reaction Tp=1.83subscript𝑇𝑝1.83T_{p}=1.83 GeV 2.02 GeV
ppΛK+p𝑝𝑝Λsuperscript𝐾𝑝pp\to\Lambda K^{+}p 3.85 10.9
pnΛK+n𝑝𝑛Λsuperscript𝐾𝑛pn\to\Lambda K^{+}n 7.12 19.4
ppΣ0K+p𝑝𝑝superscriptΣ0superscript𝐾𝑝pp\to\Sigma^{0}K^{+}p 0.005 1.36
pnΣ0K+n𝑝𝑛superscriptΣ0superscript𝐾𝑛pn\to\Sigma^{0}K^{+}n 0.008 1.68
ppΣ+K+n𝑝𝑝superscriptΣsuperscript𝐾𝑛pp\to\Sigma^{+}K^{+}n 0.001 0.52
npΣK+p𝑛𝑝superscriptΣsuperscript𝐾𝑝np\to\Sigma^{-}K^{+}p 0.010 2.78