Analysis of charged particle emission sources and coalescence in E/A = 61 MeV 36Ar + 27Al, 112Sn and 124Sn collisions
Abstract
Single-particle kinetic energy spectra and two-particle small angle correlations of protons (), deuterons () and tritons () have been measured simultaneously in 61A MeV 36Ar + 27Al, 112Sn and 124Sn collisions. Characteristics of the emission sources have been derived from a “source identification plot” (– plot), constructed from the single-particle invariant spectra, and compared to the complementary results from two-particle correlation functions. Furthermore, the source identification plot has been used to determine the conditions when the coalescence mechanism can be applied for composite particles. In our data, this is the case only for the Ar + Al reaction, where , and are found to originate from a common source of emission (from the overlap region between target and projectile). In this case, the coalescence model parameter, – the radius of the complex particle emission source in momentum space, has been analyzed.
PACS number(s): 24.10.-i,25.70.Pq, 29.30.Hs
Keywords: Light charged particles; emission sources; coalescence.
1Corresponding authors.
Department of Physics, University of Lund.
Box 118, S-22100 Lund, Sweden. Tel. +46-046-2227647.
E-mail address: vladimir.avdeichikov@nuclear.lu.se,
roberta.ghetti@nuclear.lu.se
1 Introduction
A large body of studies, both experimental [1, 2, 3, 4, 5, 6, 7, 8] and theoretical [9, 10, 11, 12, 13, 14, 15, 16, 17], has demonstrated that intermediate energy heavy ion collisions proceed through a complicated reaction mechanism. For a wide range of impact parameters, ranging from peripheral to near central, the mechanism is dominated by dissipative binary collisions, with early dynamical emission followed by statistical evaporation. In particular, at E/A 60 MeV, the emission of light particles originates from (at least) three sources [2, 18], a quasi-projectile source (QP), a quasi-target source (QT), and an intermediate velocity source (IS). The IS accounts for dynamical emission, described by early nucleon-nucleon collisions and by other preequilibrium processes, such as emission from a low density neck region [18, 19, 20, 21, 22, 23, 24, 25, 26, 27, 28, 29, 30]. Since the particles emitted from these sources overlap in angle, energy and emission time, it is not possible, on a particle-by-particle basis, to identify which source each particle came from.
A powerful experimental procedure to gain insight into the reaction mechanism is two-particle interferometry, used to determine the space-time extension of the particle emitting sources [31, 32], and to extract the emission time sequence of neutrons, protons and their composites [33]. Our recent interferometry analysis of Ref. [34] on the 61 MeV/nucleon 36Ar + 27Al reaction, has confirmed a dissipative binary reaction scenario with an important dynamical emission component from the IS created in the overlap zone. In particular, an angular dependence of the correlation function has emerged. The stronger correlation observed at backward angles, indicates emission from a shorter lived source. This has been interpreted as an enhancement of the early dynamical emission component seen at backward angles. The average emission time of deuterons from this source has been found to fall in-between those of neutrons and protons, as expected if deuterons are formed mainly by coalescence [35].
To complete and complement the interferometry analysis, the information contained in the single-particle energy spectra is explored in this paper. In particular, we investigate the structure of light particle emission sources as it follows from the kinematic features of the single-particle (p, d, t) energy spectra. A common approach to study single-particle energy spectra, is to fit the data to a moving source parameterization, using multiple sources to describe preequilibrium and evaporation sources. Contribution from three sources is normally assumed: a QP, an IS and a QT [18, 36, 37, 38, 39]. While such a phenomenological approach can give a reasonably good description of double differential particle cross sections, the dynamics of the nuclear interaction and the mechanism of particle production remains hidden in the large number of fitted parameters. This description is further complicated by the fact that the three-sources relative yields vary with impact parameter, so that the parameters utilized in the description only represent average values. In this paper we investigate an alternative approach to the fitting procedure with three moving sources. This approach is feasible when a high-precision energy calibration is available, as is the case in the present data set [40]. In this approach, we construct a – plot from the invariant energy spectra. Here, is the source velocity in units of , and is the particle energy in the source frame. Inspection of this plot reveals a continuum of source velocities, in accordance with the expected trends for a dissipative binary collision mechanism of heavy ions. For the Ar + Al reaction, the continuum of source velocities is found to be common for , and charged particles, and therefore we can proceed to apply a coalescence mechanism, which is proved to be the dominant process of d and t emission from the overlap region between target and projectile. The coalescence model parameter, – the radius of complex particle emission source in momentum space, is analyzed, which provides valuable complementary information to the two-particle correlation size measurement.
The paper is organized as follows. Sec. 2 presents the details of the experiment. Sec. 3 presents the source analysis for the 36Ar + 27Al reaction. The angular dependence of , and single-particle energy spectra is presented in Sec. 3.1; the comparison with results from Firestreak model calculations highlights some simple physics behind the emission mechanism. Sec. 3.2 introduces the – plot, and discusses the wealth of information it contains on the multiple source reaction scenario. In Sec. 4, the information extracted from the – plot is compared with the results from our previous interferometry analysis [34]. Coalescence analysis of the and spectra is performed and discussed in Sec. 5. Sec. 6 extends the – source analysis to 61A MeV 36Ar + 112,124Sn collisions. A summary can be found in Sec. 7. Appendix A describes the details of the Firestreak model calculations. Appendix B describes the details of the construction and interpretation of the – plot.
2 Experimental details
The experiment was performed at the AGOR cyclotron of KVI (Groningen). The E/A = 61 MeV 36Ar14+ pulsed beam ( 0.5 1.0 nA) impinged on targets of 27Al, 112Sn and 124Sn (1.8 mg/cm2 thick). The beam intensity was monitored by a Faraday cup. The experiment measured simultaneously single-particle energy spectra and small angle two-particle correlations, in coincidence with forward emitted fragments. The requirement of at least one fragment detected in the forward direction biases our collected data towards semi-peripheral collisions [41].
The particles were detected using three complementary multidetector systems: the EMRIC charged particle detector array [40, 42], the EDEN neutron detector array [43, 44], and the KVI Forward Wall (FW) phoswich detector [45]. The experimental data were collected in two modes. In the first mode, both EMRIC and EDEN registered inclusive particle spectra in coincidence with the FW. In the second mode, coincidence events between EMRIC, EDEN and EMRIC*EDEN elements were collected in coincidence with the FW.
The EMRIC charged particle detector array consisted of 16 CsI(Tl) elements, each one subtending a solid angle of 3.6 or 5.1 msr. The detector modules were arranged in two groups, consisting of single elements and triple elements. The complete geometry, optimized for the interferometry requirements, is presented in Ref. [44]. All detectors were operated in air, outside a scattering chamber of (3 mm thick) stainless steel and 28 cm in radius. 100 m thick Capton foil windows were installed in front of the EMRIC elements. One extra element, equipped with a 241Am -source and placed at 30o was used to monitor the shift in the -peak position caused by the variation of beam intensity and, consequently, the -background, detected by all EMRIC elements. Temperature monitoring of the CsI(Tl) elements was also applied [40]. The detectors and measuring technique are described in details in Ref. [40]. The 1,2,3H isotopes were identified via the pulse-shape analysis method. An accuracy 1% was achieved in the energy calibration for each of the 100 mm long crystals by using the E(Si)–E(CsI(Tl))/PMT method. The validity of the calibration was checked by comparing the particle spectra measured by detectors located at the same polar angle. Isotopic resolution was obtained for =1 starting from energy threshold 8, 11 and 14 MeV, for p, d and t, respectively.
Two important corrections, both energy dependent, were introduced in the measured particle spectra. These corrections are quite common for experiments with long scintillators. First, the correction on the loss of charged particles due to their inelastic interaction with the scintillator material. Experimental data and calculations [46] may be approximated with a good precision by the equation,
| (1) |
where is the particle kinetic energy in MeV, is a fitting parameter.
Second, the correction on the change in real solid angle, , of the scintillator along its length,
| (2) |
Here is the solid angle defined by the front face active area of the scintillator, (cm) is the distance from the target to the scintillator front face, and is a fitting coefficient, extracted from the energy-range relation for particle () in CsI crystal [47]111The coefficients and are equal to 0.0014, 0.00090, 0.00066 and 0.00140, 0.00155, 0.00115 for p, d, t, respectively.. The measured spectra have been corrected by the factor , i.e. . As an example, the total correction factor for protons is calculated to 1.76 for =200 MeV.
3 Source analysis for E/A = 61 MeV 36Ar + 27Al collisions
3.1 Single-particle energy spectra
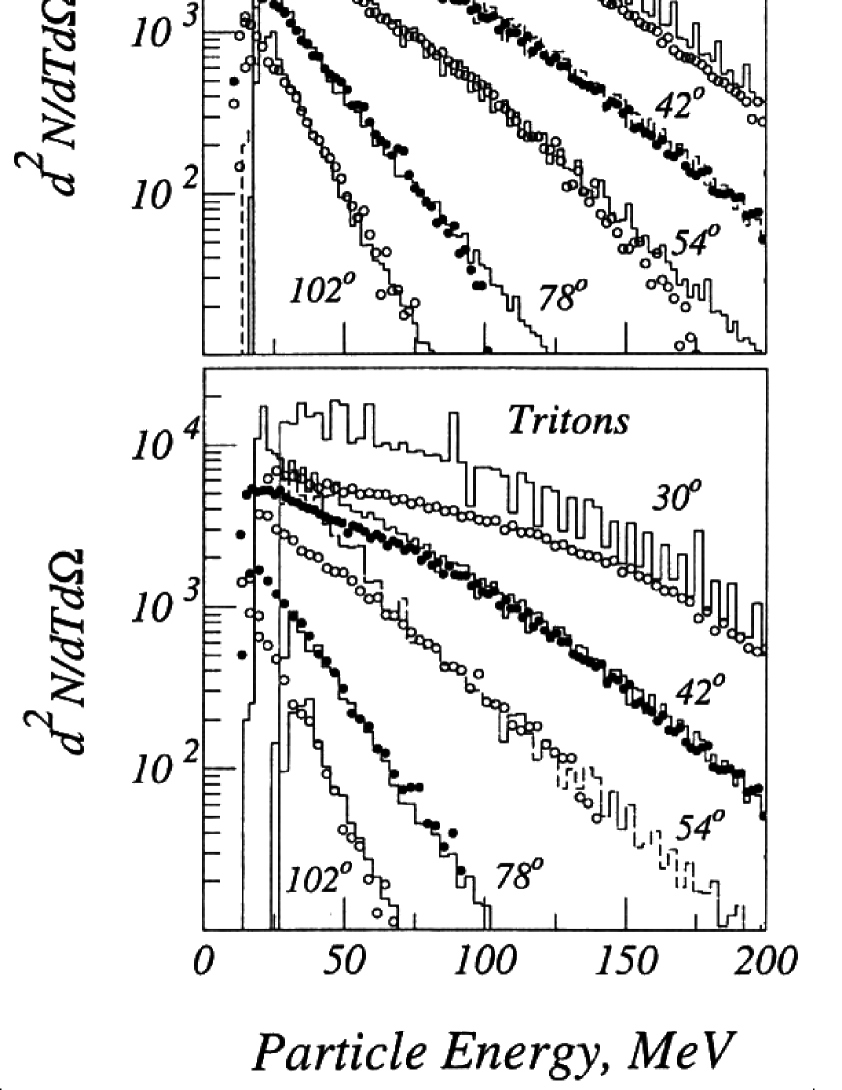
Proton, deuteron and triton energy spectra, produced in 61 MeV/nucleon 36Ar + 27Al collisions, were measured in the energy intervals 8(11)(14)–250 MeV for 8 angles in the polar angle region 30o–114o. Fig. 1 presents proton (upper panel), deuteron (middle panel) and triton (bottom panel) data for some laboratory angles, as listed in each panel.
We have compared the proton data (Fig. 1, upper panel) to the results of a Firestreak model calculation (histograms) and normalized to the data at 78o. The basic assumptions of the Firestreak model are reviewed in Appendix A. This model uses a quite drastic approximation of the geometry and treats the overlap region of the target and projectile as created in a totally inelastic process. Yet, a reasonably good description of the angular and energy distributions of the protons is achieved. It should be stressed that only one parameter - the maximum source temperature, =13.2 MeV is introduced. The quite good agreement with the experimental data shows that the nature of the binary dissipative collisions is closely related to the participant-spectator picture of the interaction (see also Sec. 3.2).
3.2 Source identification, – plot
The simplest way to describe the particle spectra is to adopt the participant-spectator description and assume emission from three thermal moving sources. For each emitting source, the velocity, , source temperature, , Coulomb barrier, , and one normalization constant are treated as free parameters. At least 12 parameters must be determined by a simultaneous fit to the particle spectra at the measured angles. To overcome the problem of coupling between the parameters, some of them must be kept fixed. Such a parametrization gives a reasonably good description of the particle spectra and angular distributions [18, 36, 37, 38, 39].
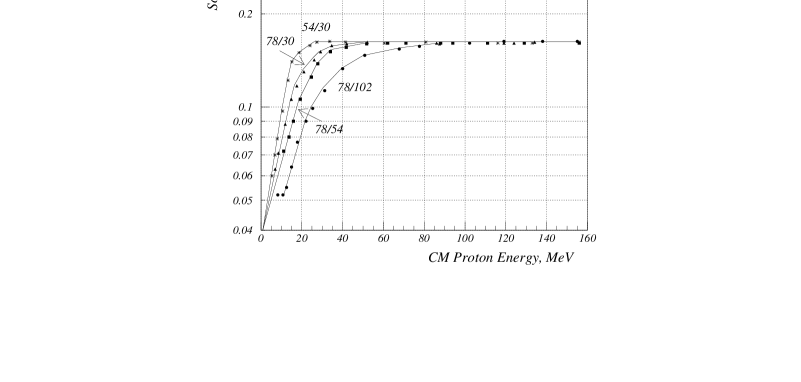
As an alternative way we construct a “source identification plot” from invariant cross sections. We obtain the source velocity, , and the kinetic energy of the particles in the source frame, , from invariant cross sections, using different lab energies and different angular combinations. In this way, we construct a – plot as if only one source was responsible for emission of particles. When several sources are present, the extracted value of represents an effective average source. However, and this is an important point, the effective source will have different characteristics, depending on the angles of the chosen detector pairs. By careful analysis of the source identification plot, the properties of the contributing sources may be revealed to a certain extent. In Appendix B we discuss the derivation and properties of such – plots further. Fig. 2 presents the results from the – method with data from 36Ar + 27Al collisions. Protons (full symbols), deuterons (big open symbols) and tritons (small open symbols) have been studied. The results are shown for some representative pairs of angles (selected for their highest statistics, taken with the triple EMRIC detectors). The value of is plotted in MeV/nucleon. The solid lines are drawn to guide the eye. Values of the source velocity corresponding to total fusion ( = 0.205) and to the projectile velocity ( = 0.361) are marked by the arrows on the -axis.
This plot contains various types of information, which we now proceed to discuss.
1) A main feature is that, in the intermediate region of , there is a clear spreading of values of . This is due to the contribution from different sources (QT, QP and IS) and to the broad impact parameter range of our apparatus, leading to a continuum of source velocities, covering the region 0.07 0.22 (common to all charged particles). This is in accordance with the expected trends for a dissipative binary collision of heavy ions. The observed continuum of emission sources is quite naturally reproduced in the nuclear Firestreak model description discussed in Sec. 3.1 and in Appendix A (Fig. 4).
2) One can identify a limiting region at high , where the source velocity converges towards the value 0.21. This indicates that the particles emitted at different angles, with the highest kinetic energy, originate from a source (IS) with a well defined velocity.
3) Another limiting region can be identified at low and backward angles. Here the different lines tend to converge towards the QT velocity. These low kinetic energy particles may be identified as emitted by the QT source (compare with Fig. 5).
4) The “bump” observed for low and forward angles (the 30o/54o pair), represents a third limiting region. This “bump” indicates that particles with a quite low kinetic energy are emitted by a source with a high velocity. These particles may be identified as emitted by the QP source (compare with Fig. 5). This region is not completely explored by our experimental apparatus, due to the limited coverage at forward angles. Notice that the QP “bump” disappears if the source identification plot is constructed for particles detected in coincidence with 4 or more fragments in the FW, a condition that biases the collected events towards less peripheral collisions.
5) The p, d, t particles are emitted by common sources (i.e. the corresponding points lie on the same line in the plot). This is a key point that justifies the application of the coalescence mechanism of d and t production (see Sec. 5) and, maybe, a unique lifetime for their emission.
4 Comparison with interferometry results for E/A = 61 MeV 36Ar + 27Al collisions
The source characterization from the study, can be compared with the interferometry analysis carried out in Ref. [34]. There it was found that the correlation strength of pairs measured in the “forward” angular region (54o/30o) is smaller than the correlation strength measured backwards. This indicates a larger space-time dimension of the effective source that emits protons in the forward direction. This is in agreement with the result that detectors at “forward” angles, 54o/30o, register particles originating from a superposition of two sources, the IS and the QP source [11]. The QP decay reveals itself as the “bump” at 25 MeV/nucleon.
In contrast, an effective source of smaller space-time size was deduced from the stronger correlation function measured at backward angles [34]. This result seems to be in contrast with the source identification plot in Fig. 2, where at backward angles (78o/102o) a QT can be identified at low energies. However, one should notice that in the correlation function, the yield from the different sources (an information not seen in the plot) plays an important role. Since the measured yield from the QT source is low, the dominating contribution to the correlation function actually comes from the region of high energies in the source identification plot, dominated by the IS.
Finally, also the results of the correlation functions with a high total momentum cut ( 450 MeV/c) are in agreement with the information derived from the – plot. In Ref. [34] it was found that the high total momentum gated correlation functions are enhanced and similar in size at backward and forward angles, indicating emission from an IS of small space-time dimension. The correlation function measured forward is more substantially enhanced. This is because the momentum gate at forward angles effectively corresponds to suppressing the contribution from the QP source, leaving the IS at high (high ) as the dominating source. At backward angles, on the other hand, the effect of the high total momentum gate is only a small enhancement, since the contribution from the QT source was already small (see discussion above).
5 Coalescence analysis for E/A = 61 MeV 36Ar + 27Al collisions
The common sources for d and t emission, Fig. 2, suggest their common origin, f.e., through the coalescence mechanism. Calescence models are reviewed in Ref. [35].
An empirical nucleon coalescence model assumes a simultaneous emission of protons and neutrons (whose relative momentum is less than a certain value ) by the source to form a complex particle (). Indeed, our study of the particle emission time sequence via two-particle correlation functions [34] is consistent with this assumption (as discussed in Sec. 1). The invariant momentum spectrum (or momentum space density) of the composite particle can be expressed through the neutron and proton invariant spectra,
| (3) |
Here =App,n. , and are the proton, neutron and composite particle total energies222 Because of experimental restrictions, the spectra of protons and neutrons were registered by our apparatus at slightly different angles. Therefore, in the coalescence analysis we assume that they are equivalent for a given angle, but scaled by a factor , corresponding to the ratio of neutron to proton numbers in the projectile and target.. The “coalescence factor” is given in the classical approximation as:
| (4) |
Here is the nucleon mass, is the spin of the particle, is the “hot zone” formation cross section, and is the “coalescence radius” in momentum space. The value of cannot be defined unambiguously. Usually, it is taken as the geometrical reaction cross section. The choice of influences the extracted value.
If chemical and thermal equilibrium are achieved in the “hot zone” volume [48], can be related to the volume within which the nucleons coalesce to form a composite particle,
| (5) |
For the dissipative binary type of collisions studied here, charged particles are emitted mostly in preequilibrium processes (with emission time 50 fm/c [11, 34]). Thus we take only as a parameter of the coalescence model.
Coalescence model calculations of d and t spectra are presented in Fig. 1 for some representative angles. The histograms drawn for d (middle panel) and (bottom panel) represent the calculation in coalescence model with = 100 and 135 MeV/c for d and t, respectively. Agreement between the model calculation and the data is very good, with the exception of the 30o angle, where the low-energy part of the spectrum comes from the QP decay. (It should be noted here that the coalescence analysis must be restricted to the kinematical region for which particle emission from the QP and QT sources is negligible).
Quantum mechanical treatment of the coalescence mechanism [49] assumes that the momentum distributions of the emitted particles can be described by density matrices. The coalescence volume is related to the internal wave function of the composite particle and of the spatial (Gaussian) distribution of nucleons in the source. Notice that the model does not impose thermal or chemical equilibrium. The coalescence radius is expressed as:
| (6) |
where and are the radii of the composite particle and of the emitting source, respectively. The source radius extracted by applying the density matrix coalescence model is 3.5 fm, both for deuterons and tritons.
6 Source analysis for E/A = 61 MeV 36Ar + 112,124Sn collisions
Fig. 3 presents the source identification plot – constructed from the invariant spectra of protons, deuterons and tritons emitted in 61A MeV 36Ar + 112Sn (upper panel) and 36Ar + 124Sn (lower panel) collisions.
Inspection of the plots reveals that:
1) A source velocity continuosly varying with is again extracted (as for the Ar + Al system), in the region of 0.03 0.2.
2) The results for the two Sn targets are very similar, which indicates very little isospin dependence in the source velocities. A somewhat larger contribution of the target residue is noticeable at backward angles in the Ar + 124Sn system.
3) The Ar + Sn results do not show a QP limiting region. As compared to the Ar + Al plot, the “bump” observed in the – dependence for low , forward angles, is absent in Ar + Sn. This indicates that our experimental apparatus misses the QP component in the direct kinematics Ar + Sn reactions, due to lack of forward angle coverage.
4) The sources are common for , and at high energies ( 30 MeV/nucleon). In the low range, instead, protons deviate from deuterons and tritons. Inspection of this deviation reveals that the QT component is more sizable for proton emission. This implies that a coalescence model analysis of the deuteron and triton production is not feasible in Ar + Sn, since, as it was pointed out in Sec. 5, the coalescence analysis must be restricted to the kinematical region for which particle emission from the QP and QT sources is negligible.
7 Summary
We have proposed a novel and simple method to analyze single-particle energy spectra. This method allows to characterize the multiple sources of particle emission that are present in dissipative binary, intermediate energy heavy ion reactions. The method consists in constructing a source identification plot -. If the accuracy of the energy calibration is sufficiently high, this plot can be generated using the invariant cross section measured at different laboratory angles.
Inspection of this plot suggests that 61 MeV/nucleon Ar + Al, Sn collisions are characterized by sources with continuously varying velocities, that tend to converge towards a well defined source velocity for particles emitted with high . Thus, this analysis supports a dissipative binary reaction scenario, with an important contribution from an intermediate velocity source.
The results from the Ar + Al collisions have been compared with the two-particle correlation function analysis performed for coincidence data from the same experiment [34]. A connection between the apparent source size (containing space-time contributions from different sources) extracted from the correlation functions and the results from the - plot has been established.
The - plot also allows to compare
the origin of emission of particles of different types, and
to reliably establish whether a common origin, necessary
condition for the applicability of a coalescence mechanism,
is met. In our data, we have found that this is the case for
the Ar + Al collisions, but not for Ar + Sn.
Application of the coalescence model to the Ar + Al data,
has allowed to extract a coalescence radius, common for
deuterons and tritons.
ACKNOWLEDGEMENTS
The authors wish to thank the European Commission support in the framework of the Transnational Access Program under contract HPRI-CT-1999-00109. Financial support from the Swedish Research Council under contracts F 620-149-2001 (RG) and 621-2001-1782 (BJ) is also acknowledged.
APPENDIX A : Firestreak Model
The Firestreak model introduces a possibility to describe the fluctuations in souce size and excitation energy of the strongly interacting fireball. In our approach we follow essentially the prescription given in Ref. [50]. A nuclear density distribution is incorporated for both colliding nuclei. The collision is treated as a totally inelastic process in the overlap region of the target and projectile. The interaction proceeds via collinear streaks of nuclear matter of both nuclei. Each of the streaks is characterized by the value of “projectile fraction”,
| (7) |
where is the number of contributing nucleons from the projectile (target). The local value of source velocity,
| (8) |
and the internal energy per nucleon,
| (9) |
are both expressed through the value of . Here is the velocity of the projectile, and tbeam is the kinetic energy per nucleon of the projectile. The geometrical aspects of the interaction (in units of cross section) are contained in the “yield function”, Y().
Fig. 4 presents the results of our numerical calculation for 36Ar + 27Al collisions at 61A MeV. We used a three-parameter Fermi-type nuclear density distribution for both colliding nuclei. The parameters are taken as compiled in Ref. [51]. A parabolic interpolation was used to get parameters for the nuclei of interest in this work. The bins of Y() near 0 correspond to contributions from the target spectator, with quite low internal (excitation) energy and source velocity. The bins of Y() near 1 correspond to contributions from the projectile spectator, with quite low internal energy but with high source velocity.
The Lab momentum space density for particle of type j is given by the expression,
| (10) |
where J is the Jakobian transformation from the CM to Lab frame, and is the CM frame momentum distribution for protons. Since we apply here only a phenomenological description of the proton spectra, the choice of is quite arbitrary. Furthermore, we do need the assumption that particles in the local source have come to thermal equilibrium in their CM frame. So we accept a classical Maxwell momentum distribution in the CM frame of the emitting system,
| (11) |
with a surface proton emission. The Coulomb barrier is taken in
the source frame, =2.0 MeV. Results from the calculations are
presented in Fig. 1 (protons). To get consistency with data,
the “effective” temperature, , is increased by
factor =1.32.
If one postulates, as in the hydrodynamical approach [52],
that the nuclear fluid is viscous, then friction arises over
the region of overlap of the target-projectile. Work done
against this friction force is transformend into a thermal energy,
which essentially
increases the participant and spectators excitation energy
[50] and this motivates the -factor.
APPENDIX B: Source velocity
reconstruction by the – method
To facilitate the reconstruction of the sources we use different detector combinations to extract source velocity, , and particle energy in the source frame, , from the invariant spectrum. If there is only one unique emission source from a reaction, the invariant cross sections at different angles can be used to determine the source velocity. The Lab energies and of particles emitted at different angles with equal invariant cross sections should thus coincide in energy () after a transformation to the source system, moving with in the laboratory. This allows to extract the value of and from the shift in particle kinetic energy, , for each pair of Lab angles and using two equations,
| (12) |
| (13) |
Here =m/2 is the Lab kinetic energy of particle m, having the velocity . In fact, the described procedure means extracting and by restoring the hypothetical invariant cross section in the source frame by using Eqs. (12, 13). It should be noticed that for this method to yield reliable results, the energy calibration must be known with a high accuracy. For example, an accuracy in the energy yields approximately error in the extracted .
By combining detectors at different laboratory angles and using particles emitted with different energies a number of different combinations of – can be obtained. The method described above assumes only one source present. When several sources are present, the extracted values of and represent an effective or average source.
To correctly interprete the and obtained for our experimental data, we construct a and from a known input. For this purpose we use the three source fit by G. Lanzanò et al. [18], which has been obtained from the double differential cross sections for protons emitted in E/A = 60 MeV 36Ar + 27Al collisions measured in the angular range 12.5o–112.5o. A standard way to describe the proton spectra and their angular dependence has been applied, by assuming particle emission from three thermal moving sources. In the source reference frame, particle evaporation is described as a volume emission of Maxwell-Boltzmann type. For each source, the values of , Tsource (MeV), Vc (MeV) and a normalization constant, (in barn), are treated as free parameters. The corresponding fit parameters for 3 types of moving sources, QT, IS (denoted QF in [18] and in Fig. 5) and QP are determined by a simultaneous fit to the proton spectra at the 13 measured angles. The fit parameters, as deduced by the authors [18], are listed in Fig. 5.
We used these parameters to calculate the invariant proton spectra. We then applied the procedure described to reconstruct . The results are presented in Fig. 5. The upper panel presents the results when particle emission from one single source is assumed (QP, IS and QT are illustrated in the same plot). The figure shows that the reconstructed is in general equal to the input values, and the small deviations of some points illustrates the accuracay of the method. Another important obeservation is the range of energies populated by the different sources. Because of kinematical reasons the fast moving QP cannot populate low energies333Low and high energy cutoffs in the values are defined by the possibility to extract simultaneously , from the invariant spectra for the chosen pair of angles.. This is important to have in mind to correctly interprete the “effective averaging” when several sources are present as in the middle and lower panels of Fig. 5.
The middle panel assumes particle emission from two sources (QT and IS). It is useful to compare this plot with those of Fig. 3. One can see that, indeed, particle measured in the Ar + Sn reactions can be attributed to the contribution of two main sources, a QT and an IS.
Finally, the bottom panel assumes particle emission from all three sources (QT, QP and IS) as parameterized in [18]. Comparing this plot with the Ar + Al data in Fig. 2 one can notice that:
1) The QP limiting region is much more defined in Fig. 5 as compared to the experimental data (Fig. 2). This is due to the inclusion of more forward angles in Fig. 5.
2) The lines in Fig. 5 converge much earlier to a common value of , as is increased, while the experimental data (Fig. 2) present a much larger spreading in the intermediate region. Thus, a broad range of impact parameters leads to a “continuum” of sources, while the standard three-moving sources parameterization performs an averaging over several sources.
References
- [1] W.U. Schroder, Nucl. Phys. A538 (1992) 439c .
- [2] J. Petér, et al., Nucl. Phys. A593 (1995) 95.
- [3] R. Bougault, et al., Nucl. Phys. A587 (1995) 499.
- [4] Y. Larochelle, et al., Phys. Lett. B 352 (1995) 8.
- [5] M.F. Rivet, et al., Phys. Lett. B 388 (1996) 219.
- [6] J.F. Lecolley, et al., Phys. Lett. B 387 (1996) 460.
- [7] W. Skulski, et al., Phys. Rev. C 53 (1996) R2594.
- [8] O. Dorvaux, et al., Nucl. Phys. A651 (1999) 225.
- [9] L. Sobotka, Phys. Rev. C 50 (1994) R1270.
- [10] L. Sobotka, et al., Phys. Rev. C 55 (1997) 2109.
- [11] Ph. Eudes, et al., Phys. Rev. C 56 (1997) 2003.
- [12] M. Colonna, et al., Prog. Part. Nucl. Phys. 30 (1992) 17.
- [13] M. Colonna, et al., Nucl. Phys. A 589 (1995) 160.
- [14] M. Colonna, et al., Nucl. Phys. A 583 (1995) 525c.
- [15] M. Colonna, et al., Nucl. Phys. A 642 (1998) 449.
- [16] G. Fabbri, et al., Phys. Rev. C 58 (1998) 3508.
- [17] M. Colonna et al., Phys. Rev. C 57 (1998) 1410.
- [18] G. Lanzanò et al., Phys. Rev. C 58 (1998) 281.
- [19] C.P. Montoya, et al., Phys. Rev. Lett. 73 (1994) 3070.
- [20] J. Tõke, et al., Phys. Rev. Lett. 75 (1995) 2920.
- [21] Y. Larochelle, et al., Phys. Rev. C 55 (1997) 1869.
- [22] J. Łukasik, et al., Phys. Rev. C 55 (1997) 1906.
- [23] P. Pawloswki, et al., Phys. Rev. C 57(1998) 1771.
- [24] Y. Larochelle, et al., Phys. Rev. C 59(1999) R565.
- [25] E. Plagnol, et al., Phys. Rev. C 61 (1999) 014606.
- [26] D. Doré, et al., Phys. Lett. B 491 (2000) 15.
- [27] P.M. Milazzo, et al., Nucl. Phys. A 703 (2002) 466.
- [28] T. Lefort, et al., Nucl. Phys. A662 (2000) 397.
- [29] G. Lanzanò, et al., Nucl. Phys. A683 (2001) 566.
- [30] J. Łukasik, et al., Phys. Lett. B 566 (2003) 76.
- [31] D.H. Boal, et al., Rev. Modern Phys. 62 (1990) 553.
- [32] D. Ardouin, Int. Journ. Mod. Phys. E 6 (1997) 391.
- [33] R. Ghetti, et al., Phys. Rev. Lett. 87 (2001) 102701.
- [34] R. Ghetti, et al., Phys. Rev. Lett. 91 (2003) 092701.
- [35] W.J. Llope, et al., Phys. Rev. C 52 (1995) 2004.
- [36] B.V. Jacak, et al., Phys. Rev. C 35 (1987) 1751.
- [37] R. Wada, et al., Phys. Rev. C 39 (1989) 497.
- [38] D.K. Agnihotri et al., Adv. Nucl. Dyn. 3 (1997) 67.
- [39] D. Prindle, et al., Phys. Rev. C 57 (1998) 1305.
- [40] V. Avdeichikov et al., Nucl. Inst. Meth. A501 (2003) 505.
- [41] R. Ghetti et al., Nucl. Phys. A674 (2000) 277.
- [42] F. Merchez, et al., Nucl. Inst. and Meth. A 275 (1989) 133.
- [43] H. Laurent, et al., Nucl. Inst. Meth. A 326 (1993) 517.
- [44] R. Ghetti, et al., Nucl. Inst. Meth. A 516 (2004) 492.
- [45] H.K. Leegte, et al., Nucl. Inst. Meth. A 313 (1992) 26.
- [46] V. Avdeichikov et al., Nucl. Inst. Meth. A437 (1999) 424.
- [47] J.F. Ziegler, TRIM Code V. 95.4, IBM Research, 1995.
-
[48]
A.Z. Mekjian, Phys. Rev. C 17 (1978) 1051;
S. Das Gupta, A.Z. Mekjian, Phys. Rep. 72 (1981) 72. - [49] H. Sato and K. Jazaki, Phys. Lett. 98B (1981) 153.
- [50] V.V. Avdeichikov, Phys. Lett. B201 (1988) 432.
- [51] S. Barshay, et al., Phys. Rev. C 11 (1975) 360.
- [52] R. Beckmann, et al., Phys. Lett. B105 (1981) 411.