Systematic study of the 87Sr clock transition in an optical lattice
Abstract
With ultracold 87Sr confined in a magic wavelength optical lattice, we present the most precise study (2.8 Hz statistical uncertainty) to-date of the - optical clock transition with a detailed analysis of systematic shifts (20 Hz uncertainty) in the absolute frequency measurement of 429 228 004 229 867 Hz. The high resolution permits an investigation of the optical lattice motional sideband structure. The local oscillator for this optical atomic clock is a stable diode laser with its Hz-level linewidth characterized across the optical spectrum using a femtosecond frequency comb.
pacs:
42.62.Eh; 32.80.-t; 32.80.Qk; 42.62.FiIn recent years, optical atomic clocks have become increasingly competitive in performance with their microwave counterparts. The overall accuracy of single trapped ion based optical standards closely approaches that of the state-of-the-art cesium fountain standards Diddams1 ; Margolis1 . Large ensembles of ultracold alkaline earth atoms have provided impressive clock stability for short averaging times, surpassing that of single-ion based systems. So far, interrogation of neutral atom based optical standards has been carried out primarily in free space, unavoidably including atomic motional effects that typically limit the overall system accuracy Oates1 ; Sterr1 ; Ido1 . An alternative approach is to explore the ultranarrow optical transitions of atoms held in an optical lattice Takamoto1 ; Porsev1 ; santra . The atoms are tightly localized so that Doppler and photon-recoil related effects on the transition frequency are eliminated Ido2 . Meanwhile, the trapping potential is created by laser light at a carefully chosen wavelength () such that it has essentially no effect on the internal clock transition frequency. Additionally, the increased atom-probe laser interaction time enabled by the lattice confinement permits a full utilization of the narrow natural linewidth. This optical lattice approach using neutral atoms may provide the best possible combination of clock stability and accuracy. Such a proposal has been under intensive investigation in the case of the doubly forbidden - transition in the fermionic Sr isotope, 87Sr Courtillot1 ; Takamoto1 . Similar work in Yb is also in progress fortson ; chad .
The first high precision absolute frequency measurement was recently reported for the 87Sr - clock transition using a GPS-based frequency reference Takamoto1 . However, establishing a new standard demands that different groups study potential systematic errors. In this Letter, we present the most precise study to-date of this ultranarrow clock transition in a magic wavelength optical lattice, with a direct reference to the NIST F1 Cs fountain clock. We have investigated systematic frequency shifts including those originating from atomic density, wavelength and intensity of the optical lattice, residual magnetic field, and probing laser intensity. We determined the absolute frequency of the 87Sr clock transition to be 429, 228, 004, 229, 867 20 (sys) 2.8 (stat) Hz. Furthermore, we apply this optical clock resolution towards a study of ultracold atomic motion in an anharmonic optical potential.
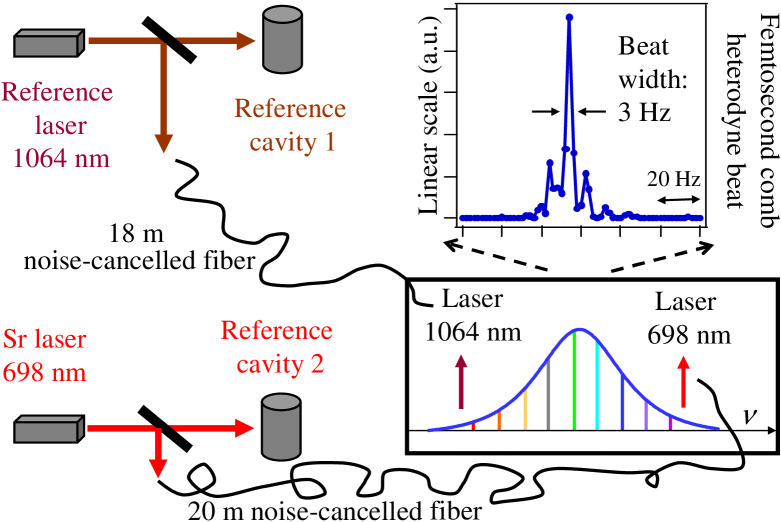
To exploit the long coherence time provided by the ultranarrow (transition linewidth 1 mHz) - clock transition, we have developed a cavity stabilized diode laser at 698 nm. The laser is locked to an isolated, passive reference cavity with finesse of 250,000 and cavity linewidth of 20 kHz. This reference cavity is mounted vertically and supported symmetrically with respect to the cavity length, which minimizes the length sensitivity to environmental vibrations Notcutt1 . The entire system is relatively simple and compact, occupying less than 1 m3. To characterize this laser, we compare it to a highly stabilized Nd:YAG CW laser (in an adjacent laboratory) which has consistently demonstrated a sub-Hz linewidth. This comparison was made possible with a phase-stabilized femtosecond frequency comb. The repetition rate (100 MHz) of the octave spanning, self-referenced Ti:Sapphire fs comb was tightly locked to the cavity stabilized 698 nm diode laser, coherently transferring the diode laser stability to each of the 106 modes of the fs frequency comb. A heterodyne beat signal between the sub-Hz Nd:YAG reference laser and a corresponding fs comb mode at 1064 nm, shown in Fig. 1, revealed a linewidth of less than 5 Hz for the 698 nm diode laser and demonstrates optical coherence transfer at the level between remotely located lasers of different colors. Additionally, the final stability of the 698 nm laser system was confirmed to be limited by thermal-mechanical noise of the mirror substrates in the Zerodur reference cavity Notcutt2 and will be improved with new mirrors. The frequency drift caused by the material creep of the cavity spacer was carefully compensated via measurement of the optical frequency relative to a Cs fountain-calibrated hydrogen maser using the same fs comb.
Preceding the - spectroscopy, 87Sr atoms undergo two stages of laser cooling (using the - and then the - transitions - see Fig. 2) to prepare approximately atoms at K temperatures Loftus1 ; Mukaiyama1 ; Xu1 . Loading of atoms from the MOT to a 1-D optical lattice operating at 813 nm allows simultaneous cooling and trapping on the - transition so that spatial mode matching between the MOT and lattice is not critical. 10% of the atoms ( ) are loaded from the red MOT to the lattice, which has a lifetime of 1 s.
Inside the lattice, the axial trap oscillation frequency is kHz, corresponding to a Lamb-Dicke parameter of . Here , is the probe wavelength, is Planck’s constant, and is the atomic mass. In this regime, spectroscopy of the clock transition can be performed nearly free of any Doppler or photon recoil shifts. To avoid residual transverse Doppler effects (transverse oscillation frequency is 500 Hz), the probing laser is carefully aligned to co-propagate with the lattice laser (Fig. 2), with both lasers being focused to a 70 m beam diameter at the trap. The probing laser is operated with optical powers near 5 nW. Spectroscopy typically consists of a probing time of 10-40 ms followed by a 2 ms illumination of the atoms by 679 nm light, which pumps the excited state population to the state for shelving to the state after spontaneous decay (Fig. 2). Because of spatial inhomogeneity in the Rabi excitation frequency, we repeat the iteration of probe and pump pulses approximately 20 times to enhance the signal size. Finally, we detect the ground state population by resonantly exciting the strong - transition at 461 nm and counting fluorescence.

The resolution of lattice spectroscopy enables us to investigate the motional states of atomic Sr along the longitudinal axis of the 1-D lattice. A deep lattice potential (where the populated motional quantum states are well below the energy barrier between adjacent sites) can be well approximated by harmonic confinement leading to equally spaced motional states. These motional states allow inelastic excitations which are red and blue detuned from the elastic, purely electronic - excitation, with amplitudes suppressed by in the Lamb-Dicke regime. A measure of the amplitudes of the red and blue sidebands directly gives the relative population of the ground and first excited motional state in and thus the atomic ensemble temperature Wineland1 ; Bergquist1 . As shown in Fig. 3(a), this measure yields an atomic temperature of 5 K, in good agreement with time of flight temperature measurements. Since the lattice trap depth is only 20 K, the harmonic approximation deteriorates for excited motional states ( 1, where is the motional quantum number). One consequence of the anharmonicity of the optical confinement is the decreasing energy spacing between different motional states, spreading the inelastic sidebands into the individual transitions. This anharmonic spreading partly explains the broad sidebands shown in Fig. 3(a). By knowing the trap depth and the energy of the =0 =1 transition, we solve for the exact eigenenergies of the cos dependent longitudinal lattice potential Jauregui , where is the lattice wave vector. The resulting eigenenergies, in units of lattice photon recoil energy, are shown in Fig. 3(b) as the lattice band structure. Knowing the relative frequency of each transition, we fit the blue sideband of Fig. 3(a) with multiple Lorentzians to yield the amplitudes (assumed to be Boltzmann-distributed) and the widths of these transitions. The relative amplitudes among the various blue sidebands offer a more accurate measure of the atomic population of various longitudinal motional states and hence the sample temperature. This result, also 5 K, is consistent with measurements based on the relative blue and red sideband amplitudes. The individual transition linewidths are very broad compared to the elastic carrier transition. Although some intrinsic broadening is introduced by the band structure of the motional eigenstates (1 Hz for lower states, kHz for upper states), major linewidth contributions arise from externally induced dissipations among motional states and radial variations of . Possible external dissipation includes motional transitions induced by lattice phase and intensity noise, two-body atomic collisions, and the blackbody radiation. Unlike typical ion trapping experiments where individual motional states are indistinguishable due to deep harmonic trapping, the scenario described here permits detailed studies of level-specific dissipation dynamics.

Spectroscopy of the - elastic carrier transition of 87Sr in an optical lattice has the potential to yield one of the highest optical resolutions ever measured Rafac1 . Of course, a number of potential relaxation mechanisms can limit the achievable coherence time. A narrow spectrum of the carrier transition is shown in Fig. 3(d). The 200 Hz full width at half maximum linewidth allows for relatively rapid averaging of multiple spectra to achieve statistical uncertainties of the transition center frequency below the 5 Hz level, typically limited by the hydrogen maser stability used for frequency counting. Our efforts to reduce the broadening mechanisms were made in several different areas. To eliminate linewidth broadening of the fiber-optic-transferred probe laser (100 Hz) caused by fiber phase noise, we implemented fiber noise cancellation to sub-Hz precision Ma1 . Lack of perfect overlap between the probe and lattice lasers can introduce Doppler broadening along the weakly confined transverse axes of the 1-D lattice. For this reason, we ensured that the well overlapped lattice and probe lasers had strong back coupling into both fibers from the retroreflecting lattice mirror. Additionally, the finite size of the probe beam creates a Heisenberg limited spread of which samples some of the transverse motion. This effect is below 50 Hz. In future work, these broadening mechanisms will be circumvented by implementation of a 3-D optical lattice. State preparation of the atomic population in ground state sublevels was not attempted, making inhomogenous Zeeman broadening possible because of the differential shift of 100 Hz/G between and states due to the latter’s hyperfine mixing Peik1 . We used Helmholtz coil pairs to minimize residual magnetic fields. If not operated at , the lattice laser can introduce large inhomogenous AC Stark broadening. By varying the lattice power and wavelength around , we ensured linewidth contributions were below 30 Hz. Also, dissipation processes in the higher motional states can cause broadening in the elastic transition. By sideband cooling the population to the ground motional state, this effect could be reduced Diedrich1 . To date, we have not observed any effect of atomic density in the lattice on the measured linewidth.
| Contributor | Correction (Hz) | Uncertainty (Hz) |
| AC Stark shift (lattice) | -17 | 8.3 |
| AC Stark shift (probe) | 7.0 | 0.9 |
| Blackbody shift | 2.2 | 0.02 |
| Zeeman shift | 0 | 12 |
| Recoil/Doppler shift | 0 | 1.9 |
| Density shift | -2.0 | 13 |
| Gravitational shift | -0.66 | 0.14 |
| Cs-maser calibration | 46.8 | 0.5 |
| Systematic total | 36 | 20 |
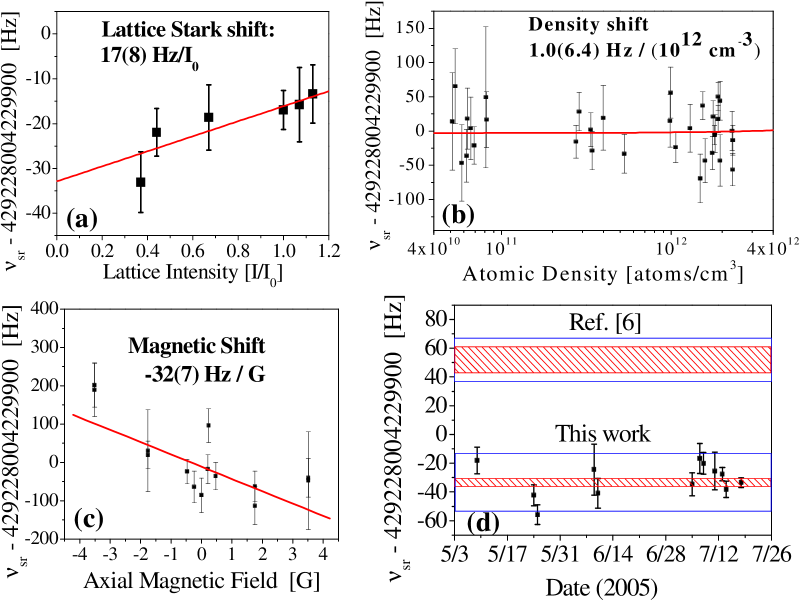
Figure 4 summarizes the measurement of the - transition frequency within three months. Limited by a statistical uncertainty of 2.8 Hz, we have performed a detailed study of systematic shifts and their corresponding uncertainties, which are listed in Table 1. The most basic systematic error associated with spectroscopy in an optical lattice is the AC Stark shift of the clock transition due to the confining optical potential. To experimentally determine the magnitude and uncertainty of this shift, we varied the lattice intensity around our typical operating intensity of = 35 kW/cm2 at wavelengths below, above, and near . At our typical operating wavelength of 813.437 nm, Fig. 4(a) shows the frequency shift as a function of intensity. The slope of this shift yields an overall correction of 17(8.3) Hz at the typical lattice intensity of . We have also experimentally determined that for the lattice intensity of , the induced frequency shift is 2 mHz for a lattice frequency deviation of 1 MHz from the magic wavelength. Combining this with our measurement of the lattice AC stark shift of 17 Hz at 813.437 nm yields = 813.418(10) nm, in agreement with Takamoto1 .
With potentially high atomic densities in an optical lattice, characterization of density shifts is important. We have 400 lattice sites with typically 250 atoms per site, yielding densities of atoms/cm3. Varying the atomic density by a factor of 50 (Fig. 4(b)), we find the density shift at our typical operating density of atoms/cm3 to be 2(13) Hz. Asymmetric population distributions among ground state sublevels can lead to Zeeman shifts of the transition frequency. We measured a shift of 32 Hz/G (Fig. 4(c)). By keeping the magnetic field 400 mG during spectroscopy, the Zeeman shift uncertainty is 12 Hz. The probe beam itself can induce a frequency shift through two different physical mechanisms. The first is the AC Stark shift of the and levels due to their couplings to other states by the probe laser. For our investigation, the AC Stark shift due to the probe laser was exacerbated by using an electro-optic (EO) modulator to probe the atoms with a weak sideband while retaining an off resonant carrier for use in our fiber noise cancellation signal. The second frequency shift mechanism arises from the posssibility of a small probe beam misalignment with respect to the lattice laser, permitting photon recoil shifts in the transverse direction of the optical trap. We could separate these power-dependent effects by either varying the total 698 nm light intensity incident on the atoms or changing the relative carrier-sideband amplitude through the EO modulation index. We determined each of these effects within 2 Hz uncertainty.
The frequency reference used for the optical measurement was a hydrogen maser directly calibrated by the NIST F1 Cs fountain clock, available to us by an optical fiber link from NIST to JILA ye03 . The approximate 14 m lower elevation of our JILA Sr experiment relative to the NIST fountain clock introduced a 1 Hz gravitational shift. Including all systematic effects discussed above, the total uncertainty (added in quadrature) is 20 Hz. The final number we report for the 87Sr - transition frequency is 429, 228, 004, 229, 867 20(sys) 2.8(stat) Hz. We note this result disagrees by three standard deviations with that of Ref. Takamoto1 measured with a GPS-calibrated reference.
We have presented the most precise spectroscopic measurement of the 87Sr - transition frequency in an optical lattice with extensive studies of systematic uncertainties. We apply this high resolution spectroscopy to investigating motional properties of lattice trapped Sr atoms. This work demonstrates the strength of the system for an optical atomic clock. Future work will improve further upon the reported precision and accuracy.
We thank J. Hall, T. Loftus, C. Greene, and M. Holland for helpful interactions and S. Diddams, T. Parker, and L. Hollberg for the maser signal transfer. This work is funded by ONR, NSF, NASA, and NIST.
References
- (1) S. A. Diddams et al., Science 306, 1318 (2004).
- (2) H. S. Margolis et al., Science 306, 1355 (2004).
- (3) C. W. Oates, E. A. Curtis, and L. Hollberg, Opt. Lett. 25 21, 1603 (2000).
- (4) U. Sterr et al., Comptes Rendus Physique 5, 845 (2004).
- (5) T. Ido et al., Phys. Rev. Lett. 94, 153001 (2005).
- (6) M. Takamoto et al., Nature 435, 321 (2005).
- (7) S. G. Porsev and A. Derevianko, Phys. Rev. A 69, 042506 (2004).
- (8) R. Santra et al., Phys. Rev. A 69, 042510 (2004).
- (9) T. Ido and H. Katori, Phys. Rev. Lett. 91, 053001 (2003).
- (10) I. Courtillot et al., Phys. Rev. A 68, 030501(R) (2003).
- (11) T. Hong et al., physics/0504216 (2005).
- (12) C. W. Hoyt et al., physics/0503240 (2005).
- (13) M. Notcutt et al., Opt. Lett. 30 14, 1815 (2005).
- (14) M. Notcutt et al., Phys. Rev. Lett. (submitted).
- (15) T. H. Loftus et al., Phys. Rev. Lett. 93, 073003 (2004); ibid. Phys. Rev. A 70, 063413 (2004).
- (16) T. Mukaiyama et al., Phys. Rev. Lett. 90, 113002 (2003).
- (17) X. Xu et al., Phys. Rev. Lett. 90, 193002 (2003).
- (18) D. J. Wineland and W. M. Itano, Phys. Rev. A 20 4, 1521 (1979).
- (19) J. C. Bergquist, Wayne M. Itano, and D. J. Wineland, Phys. Rev. A 36, 428 (1987).
- (20) R. Jáuregui et al., Phys. Rev. A 64, 033403 (2001).
- (21) R. J. Rafac et al., Phys. Rev. Lett. 85, 2462 (2001).
- (22) L. S. Ma et al., Opt. Lett. 19 21, 1777 (1994).
- (23) E. Peik, G. Hollemann, and H. Walther, Phys. Rev. A 49, 402 (1994).
- (24) F. Diedrich et al., Phys. Rev. Lett. 62, 403 (1989).
- (25) J. Ye et al., J. Opt. Soc. Am. B-Opt. Phys. 20, 1459 (2003).