Light forces in ultracold photoassociation
Abstract
We study the time-resolved photoassociation of ultracold sodium in an optical dipole trap. The photoassociation laser excites pairs of atoms to molecular states of large total angular momentum at high intensities (above 20 kW/cm2). Such transitions are generally suppressed at ultracold temperatures by the centrifugal barriers for high partial waves. Time-resolved ionization measurements reveal that the atoms are accelerated by the dipole potential of the photoassociation beam. We change the collision energy by varying the potential depth, and observe a strong variation of the photoassociation rate. These results demonstrate the important role of light forces in cw photoassociation at high intensities.
pacs:
42.50.Vk, 33.20.-t, 33.70.-wI Introduction
Photoassociation spectroscopy is a flexible and precise tool for determining molecular level structures Tiesinga et al. (2005) and binding energies Jones et al. (1996), as well as atomic lifetimes McAlexander et al. (1996) and scattering lengths Gardner et al. (1995). In photoassociation (PA) a photon excites a pair of colliding atoms into a bound molecular level. The frequency of the excitation laser determines the vibrational and rotational level of the molecule produced. Typically, photoassociation spectroscopy of ultracold atoms is performed at intensities on the order of the saturation intensity. Studies of photoassociation at higher intensities have focused on PA rate limits Prodan et al. (2003); McKenzie et al. (2002); Kraft et al. (2005), rather than the photoassociation spectrum.
We present a spectroscopic study of high-intensity photoassociation in trapped, ultracold sodium atoms. The spectra reveal excitation to molecular states of unexpectedly large angular momentum, given the initial temperature of the atoms. These spectral features persist even in a Bose-Einstein condensate, for which all but -wave collisions are ordinarily suppressed. At first glance, the excitation of these high rotational states seems to be at odds with conservation of angular momentum. We show that the excitation to states of large angular momentum is explained by atoms accelerating in the attractive dipole potential created by the photoassociation beam.
Photoassociative production of molecules into states carrying nominally forbidden angular momenta has previously been observed and explained by an array of causes. An experiment in a cesium magneto-optical trap used the trapping laser to excite quasimolecules at long range. There the resonant dipole-dipole interaction provided sufficient kinetic energy to produce eight rotational lines Fioretti et al. (1999). A similar experiment in sodium observed up to 22 lines arising from the same interaction Shaffer et al. (1999). In two-photon, “ladder-type” photoassociation in potassium, a forbidden excitation to a doubly excited high-rotational state proceeded off-resonance through a nearby rotational state Stwalley and Wang (1999). As expected for such off-resonant processes, the states of large angular momentum appeared only at fairly high intensity ( 200 W/cm2). In contrast to the above results, the present work demonstrates the production of surprisingly high angular momenta arising from a single laser frequency at the photoassociation transition.
We obtain PA spectra showing the rotational series for a nearly forbidden transition to a molecular level dissociating to the Na asymptote. At low photoassociation intensities, the rotational spectra comprise transitions to molecular states of low total angular momentum, as expected for the temperature of the atomic sample. Increasing the PA intensity causes spectral features corresponding to states of high angular momentum to appear. Measuring the time-dependent PA rate with 1 s resolution reveals oscillations in the PA signal, as well as a prompt step in the signal that depends on the rotational quantum number. We compare the signal to a Monte Carlo model of atomic dynamics in the Gaussian dipole potential of the PA beam. The comparison shows that mechanical effects induced by the photoassociation laser produce the high-angular-momentum peaks in the spectrum.
II Experimental setup
We capture 23Na atoms in a crossed dipole trap as described previously Dumke et al. (2006). We start with a dark-spot magneto-optical trap (MOT) at 300 K, loaded by a Zeeman slower, and transfer the atoms into the dipole trap. A 100 W ytterbium fiber laser focused to a waist of 60 m captures the atoms in a crossed beam configuration. After 10 seconds of MOT loading, we switch on the dipole trap beams at full power for 50 ms and then apply optical molasses for an additional 30 ms to improve the loading into the dipole trap. We load 3 106 atoms into the crossed dipole trap at a temperature of 50 K and a density of 1014 cm-3. Ramping down the fiber laser power produces a Bose-Einstein condensate (BEC) of 150 000 atoms after 9 seconds. At all stages the atoms are mostly unpolarized in the hyperfine state.
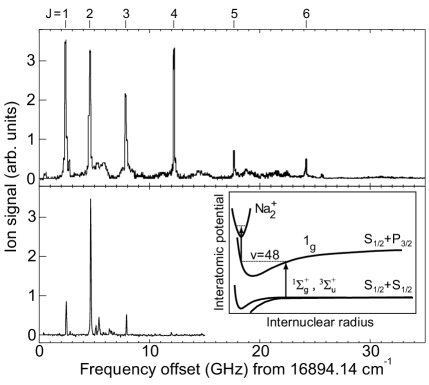
A photoassociation laser beam is focused through the atoms and produces an ion signal. Most of the data presented here was obtained from thermal atoms in the dipole trap, with some additional results obtained from the MOT and BEC stages. The PA laser excites the atoms to the rotational levels of the vibrational level of a 1g potential. At short internuclear separations, this 1g potential correlates to the Na2 Born-Oppenheimer potential, and at large separations to the Na 2S + Na 2P3/2 atomic limit. A second photon from the same laser ionizes the molecule produced (see inset to Fig. 1). The experiment occurs in a metal vacuum chamber and a microchannel plate operating at a potential of kV detects the ions produced, with a time resolution better than 1 s. The PA transition to the 1g level is weakly allowed by singlet-triplet mixing, but it still presents a relatively strong one-color ionization signal. This level has been the subject of many previous photoassociation studies Lett et al. (1993); Ratliff et al. (1994); Napolitano et al. (1994); Jones et al. (2000, 1997). The use of a weak transition allows the resolution of rotational levels at high intensities, which otherwise might be unresolved due to power broadening and state mixing.
We tightly focus the single-mode, fiber-coupled PA laser to radii between 14 and 22 m and use PA powers up to 370 mW, giving peak intensities as high as kW/cm2. For comparison, previous high-intensity cw photoassociation studies have made use of beam intensities up to 1 kW/cm2 Schlöder et al. (2002); McKenzie et al. (2002); Prodan et al. (2003); Kraft et al. (2005). The Gaussian PA laser beam creates a dipole potential with a depth of 6 mK at the maximum intensity. As we describe later, we determine the beam waist both from the motion of the atoms in the PA laser potential, and directly using a beam profiler.
III Rotational spectrum
Figure 1 shows the ion signal spectra from photoassociation in the crossed dipole trap. We scan the frequency of the PA laser and at each frequency apply a 10 ms pulse of PA light to atoms initially at a temperature of 50 K. The upper spectrum, taken at a PA intensity of 26 kW/cm2, shows a clear rotational sequence up to , with energy , where MHz is the rotational constant and is the magnitude of the angular momentum. At these temperatures, only the first three peaks are clearly visible in the lower spectrum, which was taken at 1 kW/cm2.
The incoming scattering state in the photoassociation process is described by its collision energy and its partial wave , the magnitude of the orbital angular momentum of the atom pair . For the excited molecules, the angular momentum is given by , where is the total electron orbital angular momentum and is the total electron spin. Electric-dipole transitions satisfy the selection rule ; hence, the scattering state can only be excited to rotational levels satisfying
| (1) |
We now consider the appropriate values for and .
For individual atoms, the electronic orbital angular momentum is a good quantum number. In molecules with well-separated electron clouds, as in the current case, the total electronic orbital angular momentum is given by the magnitude of the vector sum of the atomic components. Thus for the excited molecule dissociating to the S + P limit.
The potential in question is a mixture of singlet () and triplet () character. In fact, the =48 vibrational level of this potential has about 99.5% 1 character Movre and Pichler (1977); Napolitano et al. (1994). The remaining 0.5% is divided between the 1 and 1 Born-Oppenheimer states.
The electronic part of the scattering wavefunction is a linear superposition of the X and a electronic ground states. The precise linear superposition is determined by the hyperfine state of the atoms. Selection rules for electric-dipole transitions also require that only and transitions are allowed. Consequently, the vibrational level can only be accessed through the a component of the scattering state, giving in Eq. 1. The triplet character of the state is small, making the transition only weakly allowed. The natural line width of the transition is 70 kHz Jones et al. (2000), and the observed width is limited by hyperfine structure (unresolved in the current experiment) to 30 MHz Jones et al. (2000).
Inserting and into Eq. 1 gives the partial wave contributions for each rotational level . The lowest partial wave contributions for =1, 2, 3, 4, 5, and 6 are , , , , , and , respectively. At low collision energies, the largest contribution to the transition comes from the lowest allowed partial wave.
The height of the centrifugal barrier for and waves in sodium is 1.0 mK and 5.3 mK respectively Jones et al. (2006), much bigger than the 50 K temperature of the atoms in the dipole trap. The outer vibrational turning point of the =48 state lies inside the centrifugal barrier. Classically, this would preclude photoassociation to this state for all but wave scattering. Barrier tunnelling predicts that and waves should contribute significantly to the signal at the temperature of the atoms in the dipole trap (as shown in the lower spectrum of Fig. 1), but the upper spectrum in Fig. 1 shows a clear signal even for ( wave collisions). In fact, unusually high rotational levels are observed even for a Bose-Einstein condensate, in which only -wave contributions are expected. If we initiate forced evaporation in the crossed dipole trap to produce a condensate Dumke et al. (2006) and then apply the PA laser, we see a signal up to ( waves). Acquisition of a full spectrum in the BEC was not attempted due to the much lower repetition rate. The presence of high partial waves depends strongly on the PA intensity; they are not visible at low intensities.
The two-step, one-color ion signal described above depends in principle on both the photoassociation and ionization steps (see inset to Fig. 1). However, the ionization step acts only as a saturated probe of the excited state population. The results presented here are not sensitive to modest power broadening or structure in the ionization step.
The effect of the photoassociation and ionization step can be separated using two-color photoassociation. In this case, the beams from two independently tunable lasers are overlapped to form the PA beam. We fix the frequency of one laser and scan the frequency of the second laser across a rotational peak (), with a scan range of 1.6 GHz. We repeat the scan for different frequencies of the first laser, varying its frequency over a range of 600 MHz centered on the transition. The scan shows a signal only when either laser is on resonance with the transition to the rotational level. The absence of additional structure is consistent with the ionization step acting only as a probe, and with the absence of significant multiphoton processes leading to high angular momenta.
IV Time dependence of the ion signal
To determine the mechanism responsible for the appearance of high- features in the spectrum, we study the time dependence of the ion signal for different rotational levels. We capture the atoms in the crossed dipole trap and monitor the ion signal as a function of time after we turn on the PA laser. Figure 2 shows the time dependence observed for different rotational levels, each averaged over several trap loading cycles. The general structure has an initial step, a prompt signal, which is present only for low values, followed by several oscillations. At long times (greater than 250 s), the oscillations damp and the PA rate becomes constant. The spectrum in Fig. 1 reflects integration over this long-time rate. The time of flight of the ions to the microchannel plate is below 1 s, as confirmed by the short delay between PA turn-on and the initial step in the ion signal for the and traces. Each of the rotational lines has between 10 and 16 hyperfine components, which are essentially unresolved due to inhomogeneous energy broadening. The visibility of the ion signal oscillations is higher when the PA laser is tuned to the blue of the center of this hyperfine manifold, and lower when tuned to the red. The ion signals shown in Fig. 2 were obtained with the PA laser tuned to produce the highest integrated ion signal.
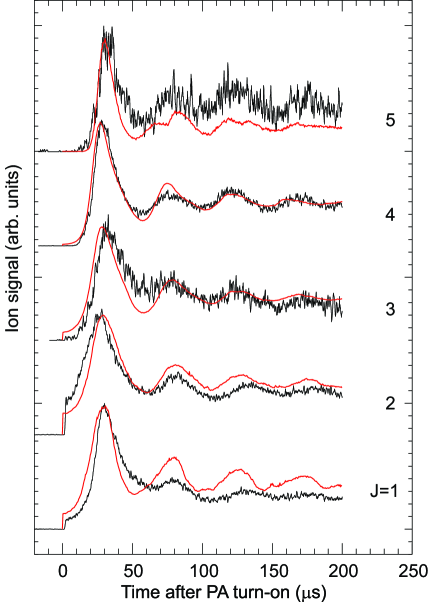
The oscillatory signal of Fig. 2 suggests that the photoassociation laser influences the motion of the atoms, which in turn affects the photoassociation rate. As the PA laser is detuned red of the sodium D lines, it forms an attractive dipole “PA potential”. Following the turn-on of the PA beam, this PA potential accelerates atoms towards the beam center. Consequently, both the relative collision energy and the atomic density increase rapidly at short times and then oscillate. The oscillation period is close to , where is the period of a single atom in the harmonic part of the potential. The period observed is consistent with a value of calculated from the atomic polarizability, and measured values of the PA beam waist and power. The PA rate increases with both collision energy and density, and the two effects combine to give a maximum PA rate after a time of roughly .
The initial step in the ion signal (at in Fig. 2) is not related to the oscillations described, but rather reflects the initial temperature and density of atoms in the crossed dipole trap. The initial step is clearly visible for and 2 (due to wave collisions), is barely visible for ( waves), and is absent for ( waves) and 5 ( waves). This is consistent with the initial ultracold temperatures in the crossed dipole trap. We observe that the height of the initial step of the peak is linear in the PA laser intensity, indicating that the ionization transition is a saturated probe of the PA rate.
The loss of visibility in the oscillations after a few periods is due to dephasing in the anharmonic PA potential. The PA laser has a Gaussian transverse profile and many atoms are far from the center where the harmonic approximation holds. The signal also decays slowly for long times as the atoms are lost from the dipole potential either due to mechanical effects or photoassociation.
The observed oscillations are much faster than the characteristic time for thermalization of the atom cloud Mudrich et al. (2002). In any case, no oscillations are expected for a sample remaining in thermal equilibrium as it evolves from one temperature to another. Furthermore, increasing the temperature in a harmonic trap would reduce the density of atoms; by contrast, we infer an initial increase in density. Density oscillations due to the sudden addition of a deep dimple potential were studied theoretically in Ref. Proukakis et al. (2006) in the context of atoms near condensation in a one-dimensional gas. Despite having a thermal cloud, we infer similar density oscillations from our photoassociation signal.
We also study the ion signals in the MOT in the absence of the crossed dipole trap. The MOT is optimized for dipole trap loading, with lower temperatures and lower densities than in our previous MOT PA experiments Fatemi et al. (2002). Spectra taken in the MOT reveal a rotational series similar to that measured in the crossed dipole trap (Fig. 1), with peaks up to , despite the sub-millikelvin MOT temperatures. Furthermore, no signal appears when the PA beam illuminates the MOT for durations less than 1 ms. This is the case even for the low rotational peaks and . However, for longer durations an ion signal does appear, reaching a steady state after 30 ms. This cw signal is comparable in strength to that in the crossed dipole trap, despite the initial density in the MOT being of order cm-3.
Apparently, atoms from the MOT are trapped in the PA potential over time, reaching sufficient density to produce a visible PA signal only after a few milliseconds delay. We test this interpretation by keeping the PA laser on continuously, but detuned 40 MHz from the PA resonance, to achieve steady-state trapping in the PA potential. As expected, no ion signal is observed while the PA beam is off-resonance. If the frequency of the PA beam is suddenly shifted onto resonance, a steady ion signal appears instantly. No oscillations similar to those in Fig. 2 are observed.
If, in the above test, we suddenly double the PA beam power as we shift the frequency onto resonance, the ion signal does exhibit oscillations on a time scale similar to those in Fig. 2. Atoms already trapped in the PA potential suddenly gain kinetic energy, leading to the oscillating signal. This shows that the mechanism responsible for high angular momentum peaks in our MOT PA spectrum is the same as for the dipole trap experiments.
The advantage of working with the crossed dipole trap is that it provides a high-density sample in which an ion signal appears immediately after we turn on the PA beam. In this way we have good control over the density and temperature of the sample before we introduce the PA laser. Furthermore, the range of oscillation frequencies of the atoms is smaller than in the MOT because the crossed dipole trap is contained within one Rayleigh length of the PA laser beam. Hence, the visibility of the oscillations in the dipole trap is higher than in the MOT.
V Monte Carlo simulation of the ion signal
We perform a classical Monte Carlo simulation of the ion signal as a function of time. The key components of the simulation are a description of the initial atomic positions and velocities; a calculation of the motion of the atoms; and a model for the ion signal, which makes use of the collisional energy dependence of the PA rate.
We initialize the atoms with the position and velocity distributions for the crossed dipole trap. We then introduce the PA potential and calculate the resulting classical motion of the atoms. A typical potential depth is around 2 mK, which is much larger than the temperature of the atoms. The simulation exploits the cylindrical symmetry of the experiment, and considers only the motion in the plane perpendicular to the PA beam propagation direction. Motion along the PA beam axis is neglected, as the dipole force is small in this direction. We divide the radial coordinate into 100 bins and collect all the atoms that fall into each bin as a function of time. We obtain the relative velocity between all possible pairs of atoms , in a particular bin to calculate the collision energy , with the reduced mass. The simulated ion signal at a given time step in the simulation is given by Napolitano et al. (1994)
| (2) |
where , , and are the density, atom number, and PA laser intensity respectively for the bin . The average runs over all pairs of atoms in bin . corresponds to the intensity-normalized stimulated width for a collisional energy and can be well approximated by the Wigner threshold law at low energies. is the total width, with the natural width. is the frequency of the laser, and is the shift from the unperturbed resonant frequency for the transition due to the collisional energy and the light shift . The signal is linear in at low intensities, due to the saturation of the ionization transition.
The input parameters for the simulation are the initial distributions of atoms in the dipole trap (determined by the dipole trap waist, depth and the initial temperature), the power of the PA laser beam, its beam waist and the light shift. We obtain the waist from the measured PA laser power and the frequency of the oscillating ion signal. The waist obtained this way is consistent with the one measured directly with a scanning knife-edge beam profiler. We measure the -wave light shift with short PA pulse durations on the peak, and use this experimentally-determined light shift for all rotational peaks.
VI Discussion
The simulations confirm that the oscillations observed in the ion signal are due to the motion of the atoms in the PA potential. This motion causes a periodic modulation of the density at the bottom of the potential, which is mainly responsible for the signal. There is also an energy modulation, since the atoms gain a maximum kinetic energy when they reach the bottom of the potential. The energy increase is what makes it possible to see high rotational levels in Fig. 1, which would otherwise be absent due to the centrifugal barrier.
In an initial simulation, we assume Wigner threshold law behavior and include only the lowest partial wave allowed for the rotational peak in question. This simple model reproduces the essential structure of the oscillation, characterized by a strong initial peak followed by further oscillations of diminishing amplitude. Quantitative agreement is not, however, achieved and the height of the prompt ion signal is not reproduced accurately.
To obtain quantitative agreement with the data we extended the simulation to include the full hyperfine structure of each rotational peak. In this extended model, the ion signal at each time step is found by summing Eq. 2 over the hyperfine substates of the rotational state in question,
| (3) |
Here is the unperturbed resonant frequency of each hyperfine transition. A different function must be used for the intensity-normalized stimulated width of each hyperfine transition. This stimulated width is a sum over all contributing partial waves and Zeeman sublevels of the colliding atoms Tiesinga et al. (2005); Samuelis et al. (2001).
The simulated ion signal is shown in Fig. 2 superimposed on the experimental signal. The amplitude of the simulated signal is normalized to the experiment. To accurately reproduce the experimental procedure, the simulation was performed for a range of laser tunings , and the tuning yielding the greatest integrated ion signal was selected. Because our lasers have a nominal 5 MHz stability, the simulated signal is a weighted sum of the time series over an appropriate range of detunings.
The simulation reproduces the oscillations, and also shows a prompt ion signal due to and wave photoassociation. This prompt signal is reproduced for , 2 and 3, with the largest prompt signal for . The agreement between simulation and experiment is best for , possibly because the signal is dominated by a single partial wave (-wave). Lower rotational peaks have significant contributions from two or more partial waves, and consequently are more sensitive to the molecular structure model. The effect of the dominant partial wave in each time series is manifest as the initial peak becomes progressively steeper for angular momenta above .
We also found that the simulation consistently showed reduced visibility of the oscillations when the simulated laser frequency was set red of the transition center, and enhanced visibility when set to the blue.
In a further series of experiments, we explore different energy regimes by repeating the measurement at various PA potential depths. We increase the depth up to 6 mK by changing the laser power. As we increase the depth of the potential, we observe an increase in the oscillation frequency of the ion signal. The oscillation frequency scales as the potential depth raised to the power , consistent with the square-root dependence expected for oscillation in a Gaussian potential.
We study the dependence of the magnitude of the ion signal on the potential depth. Figure 3 shows the integrated ion signal as a function of the PA laser power for the (circles) and (squares) peaks. The signal is considerably weaker and for low powers it is buried in the noise. The signal follows approximately a power law. At high powers we observe a saturation of the signal that happens at a lower power for than for .
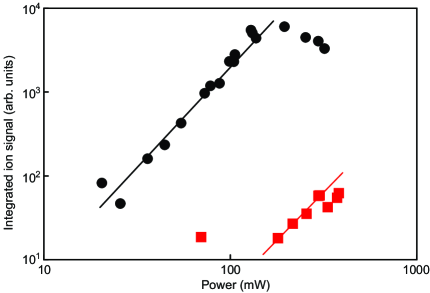
The PA lineshape suffers considerable modifications at high powers. The observed shifts become larger than the line width at low powers, and the spectrum is power broadened. This suggests that the saturation of the signal in Fig. 3 is a consequence of the line shape modifications, which affect the denominator of Eq. 2.
Simulations support the hypothesis that this saturation is due to power broadening of the PA transition, with simulated ion signals saturating as power broadening becomes significant. Further, in simulations this saturation occurs at higher intensities for than for , as expected from the behaviour of the stimulated width function . The simulation produces a power-law dependence, but with a different exponent to that observed experimentally. The accuracy of the molecular structure input is much more important for the power dependence than it is for the time dependence of the signal.
VII Conclusion
In summary, we study the mechanical effects present in high intensity photoassociation. The time resolution of the ion signal provides clear evidence for oscillations of the atoms inside the PA laser potential. We present a simulation that closely reproduces the experimental results. The PA potential gives the atoms enough energy to excite higher rotational levels, an excitation which is strongly forbidden by centrifugal barriers in an unperturbed thermal gas at the dipole trap temperature. In particular, when we start with a Bose-Einstein condensate, we observe partial wave contributions up to waves. The potential created by the PA laser imparts collision energy to the atoms in a controlled, albeit non-monochromatic way. The present results additionally demonstrate the use of time-resolved photoassociation to study rapid density dynamics in an atomic cloud Proukakis et al. (2006). The understanding of mechanical effects will play an important role in future studies of ultracold photoassociation at high intensities.
We thank Fredrik Fatemi for providing his earlier observations of high rotational levels at high intensity.
References
- Tiesinga et al. (2005) E. Tiesinga, K. M. Jones, P. D. Lett, U. Volz, C. J. Williams, and P. S. Julienne, Phys. Rev. A 71, 052703 (2005).
- Jones et al. (1996) K. M. Jones, S. Maleki, S. Bize, P. D. Lett, C. J. Williams, H. Richling, H. Knöckel, E. Tiemann, H. Wang, P. L. Gould, et al., Phys. Rev. A 54, R1006 (1996).
- McAlexander et al. (1996) W. I. McAlexander, E. R. I. Abraham, and R. G. Hulet, Phys. Rev. A 54, R5 (1996).
- Gardner et al. (1995) J. R. Gardner, R. A. Cline, J. D. Miller, D. J. Heinzen, H. M. J. M. Boesten, and B. J. Verhaar, Phys. Rev. Lett. 74, 3764 (1995).
- Prodan et al. (2003) I. D. Prodan, M. Pichler, M. Junker, R. G. Hulet, and J. L. Bohn, Phys. Rev. Lett. 91, 080402 (2003).
- McKenzie et al. (2002) C. McKenzie, J. H. Denschlag, H. Häffner, A. Browaeys, L. E. E. de Araujo, F. K. Fatemi, K. M. Jones, J. E. Simsarian, D. Cho, A. Simoni, et al., Phys. Rev. Lett. 88, 120403 (2002).
- Kraft et al. (2005) S. D. Kraft, M. Mudrich, M. U. Staudt, J. Lange, O. Dulieu, R. Wester, and M. Weidemüller, Phys. Rev. A 71, 013417 (2005).
- Fioretti et al. (1999) A. Fioretti, D. Comparat, C. Drag, T. F. Gallagher, and P. Pillet, Phys. Rev. Lett. 82, 1839 (1999).
- Shaffer et al. (1999) J. P. Shaffer, W. Chalupczak, and N. P. Bigelow, Phys. Rev. Lett. 83, 3621 (1999).
- Stwalley and Wang (1999) W. C. Stwalley and H. Wang, J. Mol. Spectrosc. 195, 194 (1999).
- Dumke et al. (2006) R. Dumke, M. Johanning, E. Gomez, J. D. Weinstein, K. M. Jones, and P. D. Lett, New J. Phys. 8, 64 (2006).
- Lett et al. (1993) P. D. Lett, K. Helmerson, W. D. Phillips, L. P. Ratliff, S. L. Rolston, and M. E. Wagshul, Phys. Rev. Lett. 71, 2200 (1993).
- Ratliff et al. (1994) L. P. Ratliff, M. E. Wagshul, P. D. Lett, S. L. Rolston, and W. D. Phillips, J. Chem. Phys 101, 2638 (1994).
- Napolitano et al. (1994) R. Napolitano, J. Weiner, C. J. Williams, and P. S. Julienne, Phys. Rev. Lett. 73, 1352 (1994).
- Jones et al. (2000) K. M. Jones, P. D. Lett, E. Tiesinga, and P. S. Julienne, Phys. Rev. A 61, 012501 (1999).
- Jones et al. (1997) K. M. Jones, S. Maleki, L. P. Ratliff, and P. D. Lett, J. Phys. B 30, 289 (1997).
- Schlöder et al. (2002) U. Schlöder, C. Silber, T. Deuschle, and C. Zimmermann, Phys. Rev. A 66, 061403(R) (2002).
- Movre and Pichler (1977) M. Movre and G. Pichler, J. Phys. B 10, 2631 (1977).
- Jones et al. (2006) K. M. Jones, E. Tiesinga, P. D. Lett, and P. S. Julienne, Rev. Mod. Phys. 78, 483 (2006).
- Mudrich et al. (2002) M. Mudrich, S. Kraft, K. Singer, R. Grimm, A. Mosk, and M. Weidemüller, Phys. Rev. Lett. 88, 253001 (2002).
- Proukakis et al. (2006) N. P. Proukakis, J. Schmiedmayer, and H. T. C. Stoof, Phys. Rev. A 73, 053603 (2006).
- Fatemi et al. (2002) F. K. Fatemi, K. M. Jones, P. D. Lett, and E. Tiesinga, Phys. Rev. A 66, 053401 (2002).
- Samuelis et al. (2001) C. Samuelis, E. Tiesinga, T. Laue, M. Elbs, H. Knöckel, and E. Tiemann, Phys. Rev. A 63, 012710 (2001).