Network effects in service usage
Abstract
While there is ample evidence that social and communication networks play a key role during the spread of new ideas, products, or services, network effects are expected to have diminished influence in the stationary state, when all users are aware of the innovation, and its usage pattern is determined mainly by its utility to the user. Here we study four mobile phone-based services available to over six million subscribers, allowing us to simultaneously monitor the communication network between individuals and the time-resolved service usage patterns. We find that usage highly correlates with the structure of the communication network, and demonstrate the coexistence on the same social network of two distinct usage classes, network effects being responsible for the quantifiable differences between them. To test the predictive power of our theory, we demonstrate that traditional marketing techniques are ineffective in permanently boosting service adoption, and propose a hub-based incentive mechanism that has the potential to enhance usage for one of the two service classes.
Thanks to electronic communications that offer virtually instantaneous information access, awareness of some products and services, such as iPod, MySpace, RAZR, and ringtones, have swept the population within a few months, resulting in millions of active users. Innovation diffusion studies offer a rather complete conceptual picture of this adoption process, capturing how an innovation spreads from early adopters to the laggards along the links of the social and communication network rogers ; bass ; valente ; mahajan ; helbing ; guardiola . Yet, all innovations eventually reach a saturated state, in which there is complete awareness of its benefits, and practically all those who could find the innovation useful have adopted it. The social network, that plays a key role during the spreading process brancheau , is not expected to impact this saturated state, as only the utility of the product or service to the individual user determines its day-to-day usage. This leaves open a question of major conceptual and practical importance: could the underlying social and communication network play a role in the usage of innovations? Here we show that this is indeed the case: the ties between individuals significantly impact the usage patterns of many services.
Today our ability to study innovation diffusion and usage patterns is enhanced by the fact that virtually all electronic communications and purchasing events leave digital signatures eckmann ; bornholtz ; barabasi . Yet, advances are still limited by the fact that we need to simultaneously track both social interactions and service usage patterns, which requires the merging of various proprietary databases, a procedure limited by significant technical and legal roadblocks, as well as legitimate confidentiality concerns. Given that mobile carriers must track for billing purposes each call users place or receive, effectively recording the underlying social network, and regularly introduce innovative phone-based services, they offer unprecedented opportunities to explore the detailed dynamics of service usage vesa . Here we capitalize on this opportunity, studying the role of the social network in the usage patterns of four mobile phone-based services, available to over a quarter of mobile phone users in a country. We first show that service usage is characterized by detectable dyadic effects, indicating that if a user uses a specific service in a regular fashion, her phone-based contacts will also use it regularly. Yet, despite this dyadic effect, we find that the four services cluster into two distinct classes, documenting the coexistence on the same social network of two rather different usage patterns. We develop an analytical theory, rooted in diffusion models used regularly to model spreading effects in physical sciences havlin ; matteo ; bettencourt and the spread of computer and biological viruses berthelemy ; vespignani-virus ; vespignani-internet to predict the role of the social network in service usage, and demonstrate that it accurately describes the observed usage dynamics. To test the predictive power of the proposed quantitative framework, we explore the impact of advertising on service usage, showing that for the studied services advertising has no long-term impact, a prediction that is directly supported by real data. Finally, we propose that hub-based incentives could be used to permanently boost service usage, but they are effective for one service class only, illustrating the practical importance of identifying the right class to which a service belongs to.
The dataset studied by us records all calls initiated by over 6 million customers of a mobile phone company, allowing us to represent each phone number, replaced by a hash code to guarantee anonymity, as a node in the communication network. The undirected links between users represent voice calls or short messages, the two most widespread mobile phone-based communication services, resulting in approximately 10 million links each month. The call data spans a period of over a year, and is aggregated into intervals of two weeks, each record identifying the call’s origin, destination, and the type of service used by the user. We focus on four services: Email, whose users can send and receive emails from their cell phones; WAP, that gives the user the opportunity to browse Web sites; Chat, that allows users to exchange short messages anonymously; and MyFriends, which allows a group of registered users to contact all other members of the group at once.
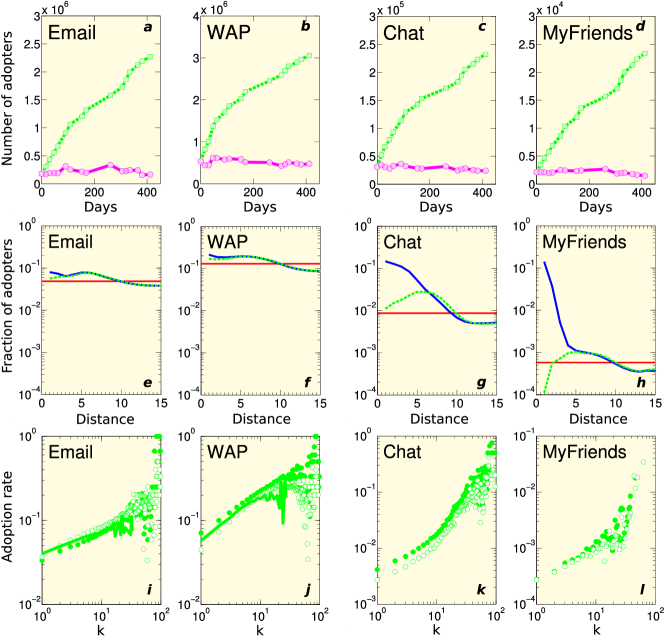
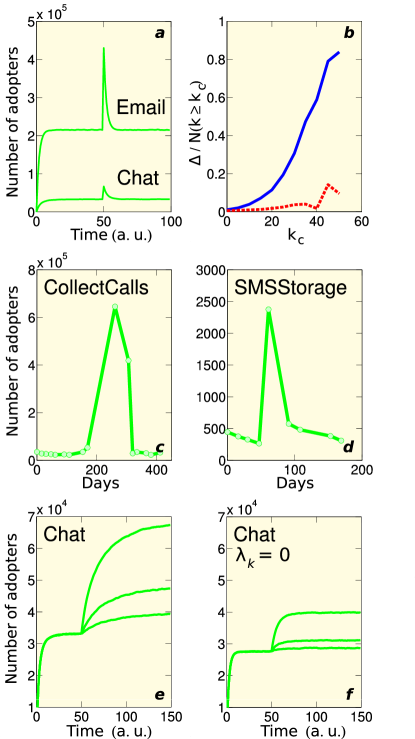
To characterize the service usage we first measured the number of active users for each service for over a year-long period. We find that the number of users who have used the service at least once from the beginning of our observational period increases monotonically (Fig. 1a–d), suggesting the presence of a classical adoption process, during which each month new users adopt each service. Yet, the number of individuals who use the service in a two-week interval is largely independent of time (Fig. 1a–d). Therefore, these services have swept the current user base and reached a saturated or endemic state before the beginning of our observational period. The increasing cumulative user number is not an evidence of a continued adoption process, but indicates that the saturated state hides a highly dynamic equilibrium, where the adopters use each service only sporadically. Indeed, the percentage of users that use the same service in two consecutive months is relatively small (37% for Chat, 30% for Email, 47% for WAP, and 33% for MyFriends). Thus, in contrast with the traditional subjects of innovation diffusion studies, where once an individual accepts an innovation she is considered an adopter for the rest of the study, mobile phone-based services display a highly volatile usage pattern, with users entering and exiting the user base in large numbers in each two week period keaveney . This may be rooted in the fact that these services are billed only for the air-time occurred during their usage, thus turning the specific service on or off does not require additional financial commitments. Thus the only lock-in incentives are utility or network-based: a service may be indispensable for an individual or there may be network externalities, resulting from peer pressure by social contacts towards its use.
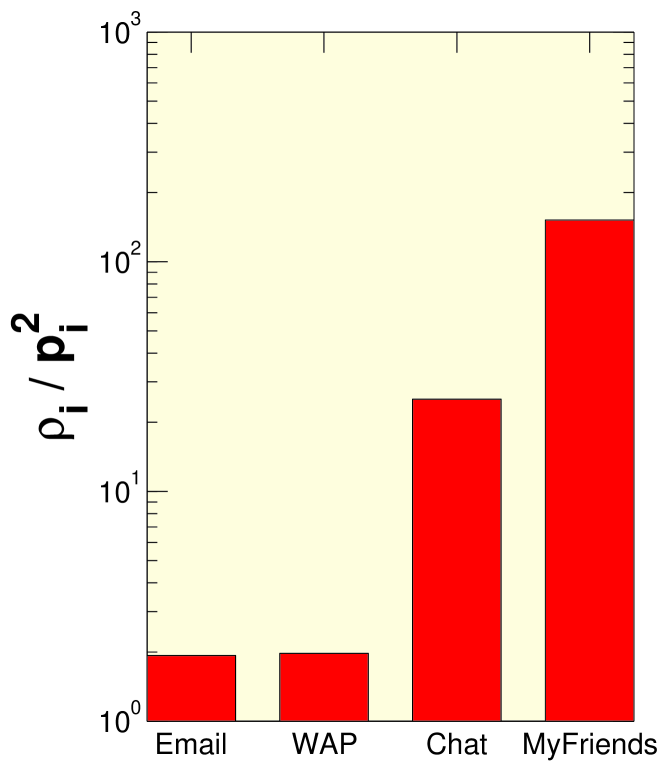
The fundamental hypothesis of all adoption studies is that information externalities play a crucial role in the spreading process: a given innovation spreads along the social links through advice, influence, or persuasion rogers ; bass ; valente . Yet, in the saturated state, when the user base is largely aware of the benefits of an innovation, social ties cease to exert a role as information source, thus usage should be mainly utility-based. To establish if personal contacts affect the usage pattern we determined the probability that two users that communicate with each other use the same service . By itself is not informative, as with probability any two individuals may also use the same service, where represents the fraction of mobile phone users that adopted . Thus a better measure of the role of personal recommendation is . We find that for Chat and MyFriends , while for Email and WAP (see Fig. 7 in the Supporting Text), evidence of a dyadic effect. Therefore, users that know each other are more likely to use the same service than expected based on a random adoption model. Thus the impact of the communication ties is not limited to the adoption phase, but it also affects the day-to-day usage of services.
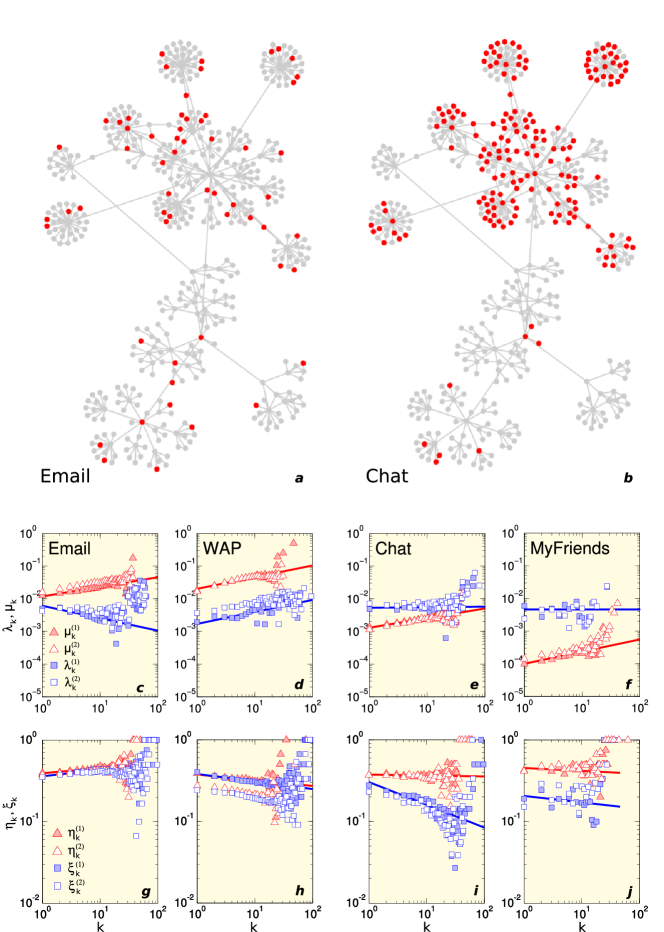
To check if service usage shows effects beyond the dyads, so that most members of a community tend to adopt the same service, we determined the fraction of users of service among individuals links away from a user of . For reference we also measure the fraction of users in the vicinity of an individual that has not adopted . If adopters do not segregate into communities, then . Indeed, we find that for Email and WAP and largely overlap for most values (Fig. 1 e and f), and the observed difference between them at small is relatively small, suggesting either the absence of compact user communities or at most weak local aggregation of users. In contrast, for Chat and MyFriends is one to two orders of magnitude larger than for small (Fig. 1 g and h), indicating that the vicinity of a user has a significantly higher density of users than the vicinity of a non-user. To illustrate the presence or absence of a community-based segregation we visualized the adoption patterns in selected neighborhoods for Email and Chat. We find that Email is used uniformly across communities, with no apparent correlation between the underlying community structure and service usage (Fig. 2a). In contrast, Chat users have the tendency to form compact communities, so that in a given community either almost everybody or almost nobody uses Chat (Fig. 2b).
If service usage is driven by communication with social contacts, high-degree individuals should more likely use a given service than small-degree individuals. While the role of hubs and connectors in innovation diffusion is well documented rogers ; bass ; valente ; coleman , in the absence of sufficient statistics the functional dependence of the adoption rate on the degree remains unknown. Furthermore, it is unclear if such degree-dependent effects should emerge in the usage patterns as well. Therefore, we determined the usage rate among users with degree , finding that for each service the probability that an individual uses a given service increases with her degree (Fig. 1i–l). For example, the likelihood that an individual with 100 contacts uses Chat is more than two orders of magnitude higher than for an individual with one or two contacts.
In summary, the empirical results indicate that a common feature of all four services is that they reached a highly dynamic saturated state, characterized by a degree-dependent usage. Yet, there are also significant differences between them, suggesting the existence of two adoption classes: Chat and MyFriends display a strong community-based segregation and high dyadic effects, in contrast with Email and WAP, that are characterized by weaker dyadic effect and the apparent absence of compact user communities. Thus for each service we observe correlations between the structure of the underlying communication network and the likelihood of service usage by individual users.
A methodological challenge in understanding service usage is that we do not know why an individual uses a specific service: is she persuaded by an acquaintance, or influenced by non-social factors, such as service utility, an advertisement, or a newspaper article? Furthermore, an individual can be persuaded to use a service by an acquaintance that she never contacts through her mobile phone. To account for these ambiguities, we grouped all individuals in two categories: connected (“c”) individuals are those that are in phone contact with at least one user of service , thus have a chance to be influenced by an acquaintance, and isolated (“i”) individuals represent those that have no user of among their phone contacts, thus can be influenced only by external factors, such as mass media or acquaintances they do not call lekvall . Furthermore, we will call an individual a user if during a one month interval she used service , and a potential user if she did not use the service during the month-long period, but could potentially become a user in the future. Therefore, we distinguish between four categories of individuals, isolated and connected potential users, as well as isolated and connected users, the number of -degree individuals at time in each category being given by , , and , respectively. For a given service the changes in the number of isolated and connected adopters with degree can be written as
| (1) | |||||
where is the rate at which a potential user becomes an user due to external influence, and () represents the rate at which isolated (connected) users stop using the service parthasarathy , going from users to potential users. For connected potential users gives the rate at which they turn users as a result of the influence of one of their user contacts, and is the probability that a user’s randomly chosen link points to a user, given by berthelemy ; vespignani-virus ; vespignani-internet
| (3) |
where the first term in the product is the probability of finding a degree- individual at the end of a randomly chosen link if the degree distribution of the communication network is , and the second term is the probability that this individual is an user, , and is the number of individuals in the network. The time evolution of the number of potential users is given by
| (4) | |||||
| (5) |
where is the rate at which isolated potential users acquire user neighbors, becoming connected. If degree correlations are absent, we can assume that any non-user neighbor with degree turns user at the same rate , where . Accordingly, for isolated potential users with degree
| (6) |
Next we show that Eqs. (1)–(Network effects in service usage) with the closures provided by (3)–(6) accurately predict the dynamics of the observed service usage pattern.
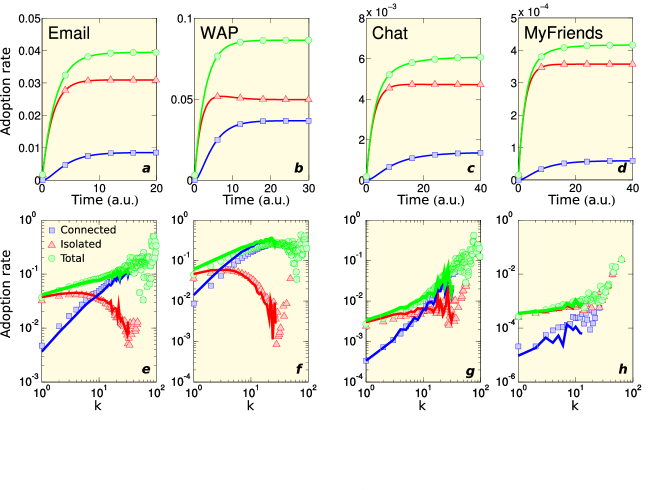
The input of (1) and (Network effects in service usage) are the time-independent adoption functions , , , and , which quantify the response of the user base to the service. These adoption functions were measured using a self-consistent method described in the Supporting Text, and are shown in Fig. 2c–j. The measurements were performed for two intervals ten months apart, finding in both cases the same functional form (see the filled and empty symbols in Fig. 2c–j), supporting our starting hypothesis that the adoption functions are time-independent. To test the predictive power of the proposed analytical model, we numerically integrated Eqs. (1)–(Network effects in service usage), starting with the initial condition in which no users are present at time . The integration predicts that the number of users rapidly increases followed by saturation (Fig. 3a–d). Most important, in the saturated state (1) and (Network effects in service usage) reproduce not only the total number of users, but also the detailed -dependence of all user categories (Fig. 3e–h). The inspection of the adoption functions and the analytical model suggests the existence of two classes of services, that we discuss separately below.
Individual Services: The most striking common feature of Email and WAP is the fact that for both services (Fig. 2 c and d), i.e. external influence, such as mass media and advertisements, dominate over personal persuasion. Furthermore, for these two services , indicating that there is little difference in the probability that an isolated or a connected user suspends the service. For and Eqs. (1)–(Network effects in service usage) reduce to
| (7) |
where denotes the total number of users with degree . In the stationary state Eq. (7) predicts that
| (8) |
i.e. the adoption rate is determined only by and . As shown in Fig. 1 i and j, the prediction (8) is in good agreement with the measured -dependent adoption rates for Email and WAP.
Cooperative Services: In contrast with the individual services, for Chat and MyFriends , so the influence of social contacts is more important than external influence. Furthermore, for these services (Fig. 2 i and j), implying that isolated users are more likely to abandon the service than connected ones. Thus Eq. (8) is not expected to hold, but the integration of (1)–(Network effects in service usage) correctly reproduces the -dependent adoption rates observed in the real data (Fig. 3 g and h). The emergence of communities observed for Chat and MyFriends is also a consequence of the functional form of the adoption functions. Indeed, with high , if an individual has two or more user neighbors, his or her likelihood of adoption increases, enhancing the pressure on the members of the same community to adopt the same service. At the same time leads to a preferential discontinuation by isolated individuals, leading to the observed virtual absence of users in communities in which users do not dominate, and leaving usage intact only in communities where most individuals use the same service.
Therefore, the empirically observed two distinct usage patterns can be reduced to the relative strength of and , quantifying the user base’s attitude to a specific service. Indeed, Chat and MyFriends facilitate alternative ways of communication between individuals, thus they are subject to network externalities farell ; Katz : the value of a service to a given user increases if her acquaintances also adopt the service, responsible for the observed relation. Isolated users do not experience such peer pressure, thus are more likely to drop the service than users surrounded by users, responsible for the fact that . In contrast, we find that Email and WAP have no immediate impact on the user’s social contacts. This is obvious for WAP, whose main purpose is to provide Web access, thus does not require the cooperation of other users to be useful. The fact that Email is an individual service is highly paradoxical, however, given that Email is a communication service, just like Chat. There is a major difference, though: Chat is an entirely phone-based service, thus it is useless unless the phone contacts of a user also adopt it. In contrast, for Email the mobile phone serves only as an interface, which allows the user to communicate with all those who use electronic mail, either using the phone or a computer (which is the far most common case) to access it. Thus there is no need for all phone-based acquaintances of a user to adopt Email in order to make it useful for an individual phone user. Therefore, when it comes to mobile phone usage, Email is not subject to network externalities farell ; Katz and increasing returns arthur , having the characteristics of an individual rather than a cooperative service.
While the continuum theory proposed above provides an accurate description of the observed usage patterns, it is of value only if it offers predictions of practical importance. For many services and products that are beneficial to a user base, a question of paramount importance emerges: how can one enhance service usage? The standard ways are advertisements and incentives, increasing awareness of the service and boosting the user base. Such measures are costly and therefore can be used only for a limited duration. They are fueled by the belief that once users become familiar with a service, they will likely continue its usage. Yet, next we show that in the saturated regime such approaches are ineffective: once the incentive is removed, the number of users returns to the pre-incentive value. Indeed, Eq. (8) predicts that the number of users depends only on and for individual services. Incentives can temporarily increase the adoption rate () and decrease the dropout rate (, ), but once they are discontinued, the number of users () returns to their pre-incentive value. To see if this result applies to all services, we used numerical simulations (see Supporting Text) with the adoption functions of Fig. 2c–j as input, finding that if we artificially doubled the number of users, the usage returns to its original value for both individual and cooperative services (see Fig. 4a). The final evidence comes from two services, providing collect calls and text message storage, available to the same user base as the four services studied above. These services were promoted by campaigns that started after they have reached saturation. As Fig. 4 c and d show, the campaigns have resulted in more than a five-fold increase in the number of users, but both services returned to their saturation value once the campaigns ended. Taken together, we find that once the saturated regime has been reached, traditional methods for boosting the consumer base are only effective for a limited time. Yet, next we show that for cooperative services one can exploit the intimate knowledge of the communication network to design cost-effective incentives.
Highly connected individuals or hubs exert disproportional influence over the user base valente2 . Therefore, if each user with degree exceeding is given permanent free usage of service , increasing their likelihood of adoption () and a decreasing their dropout rate ( and ), such differentiated incentives will result in higher saturation values (see Fig. 4 e and f). Indeed, those who received the incentive will increase usage, an effect that applies to both individual and cooperative services. However, due to the significant term for cooperative services, increased usage by hubs will also enhance the usage of their acquaintances, an effect which will be negligible for individual services. The question is, will this second, persuasion induced effect make the incentive potentially cost effective, recovering the cost of providing free permanent usage for all hubs? To answer this we determined the impact of the incentive by calculating the ratio between the number of new users (the difference between the pre- and post-incentive saturation values) and the number of hubs that have been provided the incentive. As Fig. 4b shows, we find that the impact increases with , indicating that the larger the degree of the hubs the incentives were given to, the larger their potential impact. For individual services (), however, the impact is negligible and has only weak dependence on (Fig. 4b). If one factors in the potential cost of the incentives, we find that hub-oriented permanent incentives could benefit cooperative services, given that for these the impact increases with , thus for any incentive cost there will be a value for which the lost revenue on the hubs can be recovered by the increased revenue from the users that have adopted under the influence of the hubs. However, for individual services a hub-based incentive would likely be a losing proposition: the revenue lost from the heavy usage of the hubs cannot be recovered from the increased usage of their contacts, as for these services the impact of persuasion is negligible.
In summary, while informational externalities, capturing the spread of information about a given service between acquaintances, are expected to play an important role in the adoption of innovations, their role is diminished in the saturated regime, where awareness of the benefits of a given service are widely known. We would expect, therefore, that social network effects should cease to correlate with service usage. Here we provide direct evidence of the contrary: for all services social network affects can be detected, even in the stationary state. The magnitude of this effect is service-dependent, however, leading to the coexistence on the same social network of two distinct classes of services. We find that services characterized by strong dyadic and community effects are driven by network externalities, making the use of a service more valuable for a user if it is used by its acquaintances as well. Most importantly, we find that successful interventions into service usage require a detailed understanding of the interplay between the structure of the underlying communication network and the usage mechanism. There is no one-size fits all advertising strategy: for a given innovation some strategies are guaranteed to fail, while strategies based on the quantitative knowledge of the spreading mechanism are more likely to succeed. Finally, our approach offers a coherent framework for understanding service usage in an environment where both the social network and service usage can be monitored, potentially opening new avenues for research into social diffusion and human dynamics.
References
- (1) Rogers, E. M. (2003) Diffusion of Innovations, 5th edition (Free Press, New York).
- (2) Bass, F. M. (1969) Management Science 15(5), 215–227.
- (3) Valente, T. W. (1995) Network Models of the Diffusion of Innovations (Hampton Press, Cresskill, NJ).
- (4) Mahajan, V. & Peterson, R. A. (1985) Models for Innovation Diffusion (Quantitative Applications in the Social Sciences) (SAGE Publications, Beverly Hills, CA).
- (5) Helbing, D., Treiber, M. & Saam, N. J. (2005) Phys. Rev. E 71, 067101.
- (6) Guardiola, X., Díaz-Guilera, A., Pérez, C. J., Arenas, A. & Llas, M. (2002) Phys. Rev. E 66, 026121.
- (7) Brancheau, J. C. & Wetherbe, J. C. (1990) Information Systems Research 1, 115–143.
- (8) Eckmann, J.-P., Moses, E. & Sergi, D. (2004) Proc. Natl. Acad. Sci. USA 101, 14333–14337.
- (9) Ebel, H., Mielsch, L.-I. & Bornholdt, S. (2002) Phys. Rev. E 66, 035103.
- (10) Barabási, A.-L. (2005) Nature 435, 207–211.
- (11) Vesa, J. (2005) Mobile Services in the Networked Economy (IRM Press, Hershey).
- (12) Havlin, S. & ben Avraham, D. (1987) Adv. Phys. 36, 695–798.
- (13) Di Matteo, T., Aste, T. & Gallegati, M. (2005) Eur. Phys. J. B 47, 459–466.
- (14) Bettencourt, L. M. A., Cintrón-Arias, A., Kaiser, D. I. & Castillo-Chávez, C. (2006) Physica A 364, 513–536.
- (15) Barthélemy, M., Barrat, A., Pastor-Satorras, R. & Vespignani, A. (2005) J. Theor. Biol. 235 275–288.
- (16) Pastor-Satorras, R. & Vespignani, A. (2001) Phys. Rev. Lett. 86, 3200–3203.
- (17) Pastor-Satorras, R. & Vespignani, A. (2004) Evolution and Structure of the Internet: A Statistical Physics Approach (Cambridge University Press, Cambridge).
- (18) Keaveney, S. M. & Parthasarathy, M. (2001) Journal of the Academy of Marketing Science 29, 374–390.
- (19) Coleman, J., Katz, E. & Menzel, H. (1957) Sociometry 20 253–270.
- (20) Lekvall, P. & Wahlbin, C. (1973) Swed. J. of Economics 75, 362–377.
- (21) Parthasarathy, M. & Bhattacherjee, A. (1998) Information Systems Research 9, 362–379.
- (22) Farell, J. & Saloner, G. (1985) Rand Journal of Economics 16, 70–83.
- (23) Katz, M. L. & Shapiro, C. (1985) American Economic Review 75, 424–440.
- (24) Arthur, W. B. (1996) Harvard Business Review July-August, 101–109.
- (25) Valente, T. W. & Davis, R. L. (1999) Annals AAPSS 566, 55–67.
Supporting Text for “Network effects in service usage”
Gábor Szabó and Albert-László Barabási
I Datasets
Based on the call records of a mobile telephone operator with residential subscribers, we performed our study on data comprising communication spanning 14 months, starting April 15, 2004. We neglected calls whose destination or origin was outside the company, which left us with approximately 5.5 million nodes in the call network for each month. The links between nodes were defined by initiated voice calls and short messages (SMS), the two most common services with origin and destination information. While these are directed by nature, we made the communication graph undirected, yielding more than 10 million links for one month. The call data are aggregated into intervals of two weeks, each record showing the caller, the callee, the type of the communication, and its frequency during the two weeks. For call graphs, we accumulated two of the datasets together such that two users are linked if they communicated at least once during the two weeks (see Table 1 for the time intervals). While the overwhelming majority of individuals only use voice calls for communications, it was possible to identify users of the studied services based on additional fields present in the datasets or by checking the callee field for unique service numbers that need to be dialed to use the service.
II Measuring the adoption functions , , , and
While Eqs. (1) and (2) are continuous in time, in order to be able to measure the adoption functions, we need to consider their discretized versions, given that the datasets for service usage are aggregated for periods of two weeks. Therefore, we write the discretized adoption equations as
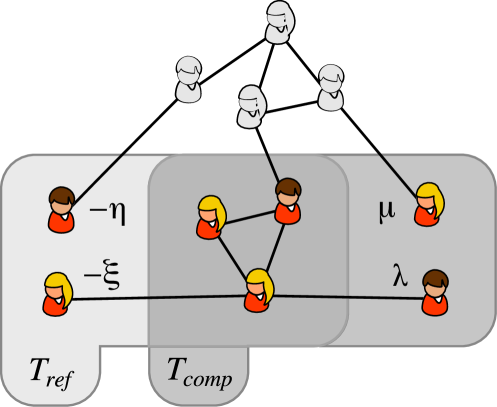
where we denoted with , , , and the measured values of the variables , , , and , respectively. and denote two time frames with data for both service usage and the communication map between the subscribers. The network of social contacts was measured with respect to : two individuals were considered to be acquaintances if they called or sent a short message to each other in the time period. An isolated (“”) individual was an individual without a service user in the immediate neighborhood in , while a connected (“”) individual had at least one user among its acquaintances. A schematic representation of the measurement procedure is shown in Fig. 5.
We first focus on Eq. (II), which describes the change in the number of isolated users with degree during the time interval, , where the reference social network and usage data was taken from . The change is the result of a gain in users due to isolated adoption (), and a loss of these through isolated service abandoning (), both of which can be experimentally measured: is the number of new isolated users in with degree who were not users during , and gives the number of isolated users in who in turn abandoned the service in . Since these processes are precisely what and aim to capture, we can determine the two adoption functions using
| (11) | |||||
| (12) |
where and are the number of isolated users and non-users with degree in , respectively.
Connected potential users in () are also influenced to adopt by interpersonal communication, apart from external channels. Also, connected users () may also abandon the service, allowing us to measure the two other adoption functions and :
| (13) | |||||
| (14) |
where is the measured average exposed degree for connected potential users, i.e. the average number of user neighbors for degree- connected individuals (note that ), and it is approximated by in the rate equation (2).
| Adoption functions in Fig. 2c–j | social network | ||
|---|---|---|---|
| filled symbols | 4/15/2004–5/15/2004 | 5/1/2004–6/1/2004 | 4/15/2004–5/15/2004 |
| empty symbols | 2/15/2005–3/15/2005 | 3/1/2005–4/1/2005 | 2/15/2005–3/15/2005 |
The observation periods used in this article are shown in Table 1; both and span one month, and they overlap by two weeks. On one hand, the overlap was necessary, because we wished to make and long enough so that considerable adoption can be observed, and the longest consecutive time frame for which we have communication data is one and a half months. On the other hand, it demonstrates that the choice of and is arbitrary, as long as the adoption functions are understood to refer to the chosen time window span and the relative shift between and . Therefore, the adoption functions shown in Fig. 2c–j describe adoption and abandoning probabilities for individuals observed during one month, with respect to the next month two weeks into the future. The adoption rates also have to be measured accordingly, as has been done in Fig. 2c-j for of the 2005 data (see also Table 1).
The interpretation of the adoption functions is the following: an individual who at least once uses the service during the one-month observation period is called an user. If we were able to monitor service usage continuously in time, the number of users at any point in time would follow a continuous curve. The number of users at time , in this case, would give the number of individuals who used the service in the one-month period surrounding . Since service usage is provided to us in two-week intervals, we can only sample this function at discrete intervals, such as and . While at any point in time the adoption functions , , , and would be calculated as the slope of their respective functions giving the number of new users or abandonings, we are in effect approximating them by the slope of the line connecting the discrete sampled values.
III Time independence of the adoption functions
A fundamental assumption of our modeling framework is that the adoption functions , , and are time-independent, and they characterize the user base’s attitude to a specific innovation. Thus it is crucial to test if this time independence is indeed true in the available dataset. For this we have measured the adoption rates and the adoption functions independently for two different time intervals that are ten months apart from each other (see Table 1). The results of the measurements obtained for the first interval are shown as filled symbols in Fig. 1i–l and Fig. 2c–j, respectively, while those from the second interval are shown as empty symbols. As one can notice, the functional forms of the adoption curves remain unchanged in time. The only noticeable systematic difference is the vertical shifts in the curves, while leaving the functional form unchanged. These vertical shifts are a simple consequence of the fluctuations in the service usage observed in Figs. 1a–d. These measurements thus validate our assumption that the only significant time dependence comes in the number of users, as described by Eqs. (1)–(2), and at those time scales the adoption functions can be taken to be time independent.
IV Integrating the rate equations

Once the adoption functions have been measured, it was possible to predict the time evolution of the number of users by numerically integrating the rate equations (1)–(8), using the measured adoption functions , , , and . As input we took the degree distribution of the social network at , which is rather stable in time as Fig. 6 indicates. We set an initial condition in which we had no service users in the system at , i.e. , and , where denotes the number of individuals with degree . We chose a sufficiently small value for the time step (), and by Euler integration we determined the adoption rates for the desired range in time.
V Numerical simulations
The continuum theory (1)–(2) represents an approximation to the real spreading process: it cannot account for all the details of the community formation process, so when services start to percolate (higher coverages) it will likely result in deviations from the real process. Therefore, to test the validity of the model, as well as the impact of advertisements (which in the short term result in high service adoption levels) we have carried out numerical simulations of the usage of the services on the social network of in 2004. For this, we fitted power laws of the form on the adoption functions of Fig. 2c–j using a least-squares fit, and used them as the empirical adoption functions in the simulations. For example, for Chat, the following fits were used (see Fig. 2c–j, straight lines):
We then initialized every individual in the network to be a non-user of the service, and we implemented a Monte-Carlo simulation using as input a close approximation to the empirically measured adoption functions. In every time step we updated each individual’s service usage state by comparing the appropriate adoption function value to a randomly drawn number from a uniform distribution between 0 and 1. Thus for isolated (connected) users (), and for isolated (connected) potential users () was used according to their degree. We used parallel update to keep track of the changes in the states of individuals.
To simulate the effect of campaigns and advertisements, upon reaching saturation at , we determined the number of users in the system. We then changed the states of the same number of randomly chosen non-users so that they became users, thus simulating that the service usage was artifically increased by a factor of two as a result of the campaigns. After this, we let the system relax and reach equilibrium again (Fig. 4a).
To study the effect of targeted campaigns, at we halved the adoption functions and for every person with a degree greater or equal to the preset critical degree , thus simulating a permanent change in the behavior for these individuals: they would be less likely to abandon services than before. We then allowed the system to reach the stationary state again.
In addition, where mentioned, we repeated the simulations several times and averaged the time-dependent adoption rates or other quantities to minimize the effect of fluctuations.