Comment on “Development and assessment of research-based tutorials on heat engines and the second law of thermodynamics,” by Matthew J. Cochran and Paula R. L. Heron [Am. J. Phys. 74, 734—741 (2006)]
Cochran and Heron[1] test student understanding of heat engines and refrigerators in terms of the pipeline diagram of heat flows and work, familiar from textbooks. This diagram, drawing on analogies with fluid flow between reservoirs, nicely illustrates conservation of energy but is silent on the other constraint involved: the constancy of entropy, . Not too surprisingly, about two thirds of the students failed to give correct responses and explanations. I suggest that this outcome results in large part from the pipeline diagram’s exclusive emphasis on energy conservation which tends to be misleading.
A generation ago a wedge diagram was proposed in these pages[2] that simultaneously represents conservation of energy and constancy of entropy in a Carnot cycle. The wedge diagram also inspired extensions to other cycles, irreversibility, and the second law of thermodynamics,[3] but it has not yet been adopted in a physics text. As implied by Cochran and Heron’s study, another whole generation of physics students have since been instructed with strong visual cues on energy conservation in thermodynamic cycles but without sufficient caveats about the entropy constraint.
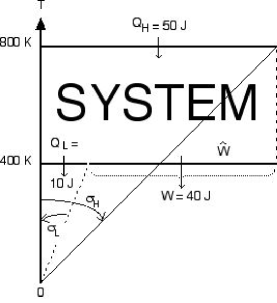
Figure 1 rephrases the same problem of a proposed heat engine that Cochran and Heron had posed to their students, but here in terms of the wedge diagram. The amount of heat flows, and , and work are proportionally represented by the lengths of horizontal lines. The direction of the vertical arrows relates those quantities to the system (“in” or “out” for and ), in agreement with standard sign convention. Conservation of energy, , is shown by the same top and bottom width of the “system box” in the diagram. Entropy changes are illustrated by angles: The larger angle between the temperature axis and the solid slanted line, , shows that the system’s entropy increases more from the heat inflow than its entropy decrease from the heat outflow, shown by the smaller angle between the dotted slanted line and the temperature axis, . This result is in contradiction with the requirement for a complete cycle and thus renders the proposed engine impossible. The maximum work that can be obtained by a reversible Carnot engine is represented in Fig. 1 by the horizontal segment to the right of the solid slanted line, .
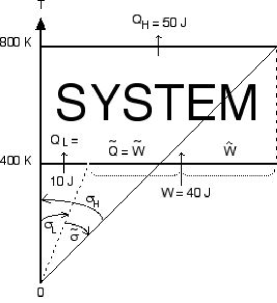
Cochran and Heron’s second examination question reverses the heat flows and work for a proposed refrigerator. Such a refrigerator proves possible although of low performance, . The wedge diagram in Fig. 2 shows that a certain part of the work —denoted as and represented by the horizontal segment between the dotted and solid slanted lines—is internally converted to heat, , due to irreversible processes. This gives rise to a combined entropy increase by , that is offset by the entropy decrease .
If instead the refrigerator were to operate reversibly, then that amount of heat, , would be additionally extracted from the low-temperature reservoir by the work , represented by the horizontal segment ranging from the solid slanted line to the far right. The performance of a reversible refrigerator under these conditions would be .
The persistent, almost universal use of the pipeline diagram—a half-truth, at best—is astounding. To remedy the consequences of its pitfall Cochran and Heron have developed tutorials[1] that augment this graphical device by calculations (cycle efficiency or performance) and statements of the second law of thermodynamics in its various formulations. However, such a graphic-cum-calculational/verbal procedure appears rather asymmetric. The wedge diagram, on the other hand, implements both conditions of thermodynamic cycles, and , graphically on a equal footing.
How can students benefit from the virtues of the wedge diagram while being exposed in their texts to the pipeline diagram? Several, mutually enhancing possibilities come to mind: (1) An “improved,” wedge-diagram treatment of the Carnot cycle in lecture. (2) A hand-out sheet with diagram rules and simple examples. (3) Incorporation of the wedge diagram in tutorials in the spirit of Cochran and Heron. (4) Use in online teaching and online homework. (5) Student encouragement (extra credit?) for drawing the diagram—like a free-body diagram in mechanics—in selected homework problems from the textbook. (6) Use of the wedge diagram in exams.
ACKNOWLEDGMENT
I thank Preston Jones for help with computer graphics.
References
- [1] M. J. Cochran and P. R. L. Heron, “Development and assessment of research-based tutorials on heat engines and the second law of thermodynamics,” Am. J. Phys. 74, 734—741 (2006).
- [2] M. Bucher, ”New diagram for heat flows and work in a Carnot cycle,” Am. J. Phys. 54, 850-851 (1986). Essentially the same diagram had been conceived independently in the engineering community by A. Bejan, “Graphic techniques for teaching engineering thermodynamics,” Mech. Eng. News, 26-28 (May 1977).
- [3] J. Wallingford, ”Inefficiency and irreversibility in the Bucher diagram,” Am. J. Phys. 57, 379-381 (1989); Z. Yan and J. Chen, ”Modified Bucher diagrams for heat flows and works in two classes of cycles,” ibid. 58, 404—405 (1990); Z. Yan and J. Chen, ”New Bucher diagrams for a class of irreversible Carnot cycles,” ibid. 60, 475-476 (1992); M. Bucher, ”Diagram of the second law of thermodynamics,” ibid. 61, 462—466 (1993).