A simple measure of native-state topology and chain connectivity predicts the folding rates of two-state proteins with and without crosslinks
Abstract
The folding rates of two-state proteins have been found to correlate with simple measures of native-state topology. The most prominent among these measures is the relative contact order (CO), which is the average CO or ‘localness’ of all contacts in the native protein structure, divided by the chain length. Here, we test whether such measures can be generalized to capture the effect of chain crosslinks on the folding rate. Crosslinks change the chain connectivity and therefore also the localness of some of the the native contacts. These changes in localness can be taken into account by the graph-theoretical concept of effective contact order (ECO). The relative ECO, however, the natural extension of the relative CO for proteins with crosslinks, overestimates the changes in the folding rates caused by crosslinks. We suggest here a novel measure of native-state topology, the relative logCO, and its natural extension, the relative logECO. The relative logCO is the average value for the logarithm of the CO of all contacts, divided by the logarithm of the chain length. The relative log(E)CO reproduces the folding rates of a set of 26 two-state proteins without crosslinks with essentially the same high correlation coefficient as the relative CO. In addition, it also captures the folding rates of 8 two-state proteins with crosslinks.
1 Introduction
Small, single-domain proteins often are two-state folders [1, 2, 3]. These proteins fold from the denatured to the native state without populating experimentally detectable intermediate states. The folding times of two-proteins have been found to vary over many orders of magnitude, from microseconds to seconds [1, 2, 3]. In 1998, Plaxco et al. [4, 5] made the remarkable observation that the the folding rates, the inverse folding times, correlate with a simple measure of native-state topology, the relative contact order (CO). Subsequently, comparable correlations have also been found for other simple measures of native-state topology such as ‘long-range order’ [6], the number of native contacts [7, 8], the ‘total contact distance’ [9], ‘cliquishness’ [10], and local secondary structure content [11].
A deeper understanding of these simple topological measures requires a test of their assumptions and implications. The most prominent topological measure, the relative CO, is defined as the average CO or ‘localness’ of all native contacts, divided by the chain length . The localness or CO of a contact between residues and is the number of covalently connected residues between the two residues. The correlation between the relative CO and the folding rates of two-state proteins implies that proteins with many local contacts (e.g., -helical proteins) fold faster than proteins with predominantly nonlocal contacts (e.g., some -sheet proteins) [1, 2, 3]. The localness of a contact is a measure for the length of the loop that has to be closed to form the contact from the fully unfolded state. Since small loops in a flexible chain molecule on average close faster than larger loops, it seems understandable that proteins with small relative CO fold faster than proteins with larger relative CO.
In this article, we consider a simple test of the loop-closure principle underlying the relative CO. Introducing covalent chain crosslinks such as disulfide bonds into the protein chain decreases the localness of some of the native contacts, since the crosslinks ‘short-circuit’ the chain. The crosslinks typically lead to an increase in the folding rate [13, 14, 12, 15], which is in qualitative agreement with arguments based on native-state topology. Here, we test whether topological measures of contact localness are able to reproduce these folding rate changes quantitatively. A natural extension of the localness of a contact in a crosslinked chain is the effective contact order (ECO)[16, 17], the minimum number of covalently connected residues between the two residues in contact. The ECO is a measure for the smallest loop that has to be closed to form a contact in a crosslinked, but otherwise unfolded chain. Without crosslinks, the ECO of a contact between two residues and reduces to the CO, the sequence separation .
We test and compare two topological measures based on localness. The first measure is the relative CO, and its natural extension for crosslinked chains, the relative ECO. The second measure is a novel measure, the relative logCO and its natural extension, the relative logECO. The relative logCO is defined as the average logarithm of the localness of all native contacts, devided by the logarithm of the chain length. The logarithm of the localness, i.e. the loop length, of a contact is an estimate for the chain entropy loss caused by the loop closure. The relative logCO and logECO therefore may be seen as naive measures of entropic folding barriers. The relative CO and relative logCO exhibit essentially the same high correlations with the folding rates of 26 two-state proteins without crosslinks. In addition, the relative logECO also captures the folding rates of 8 two-state proteins with crosslinks. The relative ECO, in contrast, seems to overestimate the folding rates of these proteins.
2 Methods and results
The relative ECO of a protein structure is defined as
| (1) |
The sum is taken over all contacts between non-hydrogen atoms of different residues, with total number , and is the chain length, the total number of residues. The ECO of contact is the minimum number of covalently connected residues between the residues in contact. More precisely, the ECO is the length of the shortest path between the two residues of the contacting atoms, where each step on this path is a step between covalently connected residues. As Plaxco et al. [4, 5] , we define two non-hydrogen atoms to be in contact if their distance is less than 6 Å.
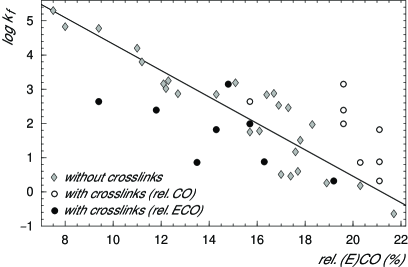
For proteins without crosslinks, the relative ECO of the protein structure is identical with the relative CO. Grantcharova et al.[3] have considered a set of 26 proteins without crosslinks, extending a previous set of Plaxco et al.[5] by two proteins. In Fig. 1, the relative CO of these 26 proteins is plotted against the decadic logarithm of their folding rates (gray diamonds), together with the relative CO (open circles) and the relative ECO (filled circles) of 8 two-state proteins with crosslinks. For the 26 proteins without crosslinks, the Pearson correlation coefficient between folding rate and relative CO is 0.92. The line in Fig. 1 represents the regression line for this proteins. The position of the open circles above this regression line indicates that the relative CO of the 8 proteins with crosslinks underestimates the folding rates of these proteins. This is not unexpected, since the relative CO does not capture crosslinks, which speed up the folding process. The standard deviation of the open circles in vertical direction from the regression line is 1.42, which is significantly larger than the standard deviation of 0.61 for the 26 proteins without crosslinks. On the other hand, the relative ECO overestimates the folding rate of the proteins with crosslinks. The majority of the filled circles is located clearly below the regression line for the proteins without crosslinks, and the standard deviation of the 8 points from the regression line is 1.23. Despite the small number of data points, this deviation for the relative ECO provides a relatively clear, negative answer, since it could only be ‘compensated’ in a much larger data set. For example, suppose we hypothetically add 8 ‘good’ data points with the same standard deviation 0.61 as the 26 proteins without crosslinks to the 8 ‘poor’ data points for the crosslinked proteins with standard deviation 1.23. The resulting set of 16 data points still has a standard deviation of , which is significantly larger than the deviation 0.61 for the proteins without crosslinks.
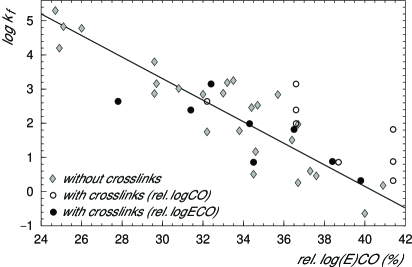
In Fig. 2, we consider the relative logECO, a novel measure of native-state topology and chain connectivity, defined as
| (2) |
For the 26 proteins without crosslinks, the relative logECO is identical with the relative logCO = . The relative logCO correlates with the foldings rates of these 26 proteins with a Pearson coefficient of 0.90, which is only slightly smaller than the correlation coefficient 0.92 for the relative CO.111 The small deviation between the correlation coefficients 0.90 and 0.92 is within reasonable error estimates of the coefficients. In a jack-knife approach, these errors can be estimated by considering, for example, all subsets of the 26 data points obtained by deleting up to two data points. For the relative ECO, the correlation coefficients of these subsets vary from 0.88 to 0.94, with a standard deviation of 0.01. For the relative logECO, the correlation coefficients of the subsets range from 0.86 to 0.93, with the same standard deviation 0.01. In addition, the relative logECO captures the folding rates of the 8 proteins with crosslinks. The standard deviation of the filled circles from the regression line of the 26 proteins without crosslinks is 0.70 and, thus, comparable to the standard deviation 0.67 for these 26 proteins. The relative logECO therefore provides a simple estimator for the folding rates of two-state proteins both with and without crosslinks.
3 Discussion and conclusions
The correlation between folding rates and simple topological measures of two-state proteins has inspired various models of protein folding that are based on native-state topology [22, 18, 19, 20, 21, 23, 24, 25, 26, 27, 28, 29, 30, 31, 32, 33, 34]. A deeper understanding of the remarkable success of the topological measures in reproducing the folding rates of two-state proteins requires a thorough test of the implications of these measures[35]. Two-state proteins with crosslinks provide an excellent opportunity to test the ‘localness hypothesis’ of some of the measures. The relative logECO passes this test, at least for a currently available set of 8 two-state proteins with crosslinks, and thus can be used to estimate the folding rates of two-state proteins both with and without crosslinks.
The topological measures that have been considered here are based on physical loop-closure principles. The ECO of a contact is an estimate for the length of the loop that has to be closed to form this contact in the unfolded protein chain. For large loops, the logarithm of the loop length is proportional to the loop closure-entropy for forming this contact in the unfolded state [36, 37, 38, 22, 39, 40]. The logarithm of the ECO in Eq. (2) thus can be interpreted as a loop-closure entropy. The relative logECO is the average over the logarithm of the ECOs for all native contacts, multiplied by a prefactor where is the chain length. To interpret this prefactor, it is important to note that the average over the logarithm of the ECOs clearly overestimates the folding barrier. The reason is that the loop-closure cost for contacts formed late in the folding process can be reduced by contacts that have been formed earlier [32, 33, 34]. This overestimate should increase with the chain length . The prefactor in Eq. (2) therefore may be seen as a heuristic, chain-length dependent correction of this overestimate, and the relative logECO as a naive estimate of entropic loop-closure barriers for folding.
Topological measures without chain-length dependent prefactors exhibit weaker correlations with the folding rates of two-state proteins. In the case of the relative CO, the prefactor is . The related topological measure without this prefactor has been termed absolute CO [3, 41]. For the 26 proteins without crosslinks considered here, the correlation coefficient between absolute CO and the folding rates is 0.69, significantly smaller than the correlation coefficient 0.92 for the relative CO. The correlation coefficient for the absolute logCO = is 0.80. This correlation coefficient is significantly smaller than the cofficient 0.90 for the relative logCO.
Clearly, simply topological measure have limitations in reproducing or predicting folding rates. One of these limitations seems to be exemplified by the three src SH3 domain mutants with crosslinks listed in Table 2. The mutant with crosslink between residues 35 and 50 has the largest folding rate among the mutants. But the relative ECO and logECO of this mutant are only slightly smaller than the corresponding values for the mutant with crosslink between residues 1 and 25, and larger than the values for the circularized mutant with crosslink between residues 1 and 56. The reason seems to be that the crosslink between residues 35 and 50 stabilizes the distal hairpin of the src SH3 domain. Mutational analysis of the wildtype src SH3 domain indicates that this -hairpin is a central structural element in the transition state for folding [42]. This seems to explain why crosslinking the hairpin has a particularly strong impact on the folding rate. The effect of native-state topology and crosslinks on the kinetics thus can also depend on structural details of transition states or native states beyond the overall localness of contacts in these states.
Another limitation is that simple, topology-based measures can’t capture sequence-dependent effects. Single-residue mutations and even relatively large changes in the sequence typically have a ‘less than tenfold effect’ [43] on the folding rate. These changes are comparable to the standard deviations of the folding rates from the regression lines in the correlation analysis of the topological measures. For the relative CO and logCO considered here, these standard deviations are between 0.6 and 0.7 on the decadic logarithmic scale (see above), which corresponds to an average error of a factor 5 in rate predictions. For some proteins, however, larger mutation-induced changes in the folding rate have been observed [44, 45]. On average, the effect of ‘topological mutations’ such as the introduction or deletion of crosslinks on the folding kinetics is significantly stronger than the effect of single-residue mutations. This is not astonishing, since these mutants change the connectivity of the protein chain, not only the local energetics. Other examples of ‘topological mutants’ are circular permutants in which the wild-type termini of the protein chain are connected and new termini are created by cleaving the chain somewhere else [46, 13, 47, 48, 49]. Circular permutation of the protein S6 has a drastic effect on the transition state [48], which has been captured in a simple ECO-based model that predicts protein folding routes from native structures [33].
References
- [1] Jackson SE. How do small single-domain proteins fold? Fold Des 1998;3:R81-R91.
- [2] Fersht AR. Structure and mechanism in protein science. New York: W. H. Freeman; 1999.
- [3] Grantcharova V, Alm EJ, Baker D, Horwich, AL. Mechanisms of protein folding. Curr Opin Struct Biol 2001;11:70-82.
- [4] Plaxco KW, Simons, KT, Baker, D. Contact order, transition state placement and the refolding rates of single domain proteins. , J Mol Biol 1998;277:985-994.
- [5] Plaxco KW, Simons KT, Ruczinski I, Baker D. Topology, stability, sequence, and length: Defining the determinants of two-state protein folding kinetics. Biochemistry 2000;39:11177-11183.
- [6] Gromiha MM, Selvaraj S. Comparison between long-range interactions and contact order in determining the folding rate of two-state proteins: Application of long-range order to folding rate prediction. J Mol Biol 2001;310:27-32.
- [7] Makarov DE, Keller CA, Plaxco KW, Metiu H. How the folding rate constant of simple, single-domain proteins depends on the number of native contacts. Proc Natl Acad Sci USA 2002;99:3535-3539.
- [8] Makarov DE, Plaxco KW. The topomore search model: A simple, quantitative theory of two-state protein folding kinetics. Protein Sci 2003;12:17-26.
- [9] Zhou, H. and Zhou, Y. Folding rate prediction using total contact distance. Biophys. J. 2002;82:458-463.
- [10] Micheletti C. Prediction of folding rates and transition-state placement from native-state geometry. Proteins 2003;51:74-84.
- [11] Gong HP, Isom DG, Srinivasan R, Rose GD. Local secondary structure content predicts folding rates for simple, two-state proteins. J Mol Biol 2003;327:1149-1154.
- [12] Schönbrunner N, Pappenberger G, Scharf M, Engels J, Kiefhaber T. Effect of preformed correct tertiary interactions on rapid two-state tendamistat folding: Evidence for hairpins as initiation sites for -sheet formation. Biochemistry 1997;36:9057-9065.
- [13] Otzen DE, Fersht AR. Folding of circular and permuted chymotrypsin inhibitor 2: Retention of the folding nucleus. Biochemistry 1998;37:8139-8146.
- [14] Grantcharova VP, Riddle DS, Baker D. Long-range order in the src SH3 folding transition state. Proc Natl Acad Sci USA 2000;97:7084-7089.
- [15] Camarero JA, Fushman D, Sato S, Giriat I, Cowburn D, Raleigh DP, Muir TW. Rescuing a destabilized protein fold through backbone cyclization. J Mol Biol 2001;308:1045-1062.
- [16] Fiebig KM, Dill KA. Protein core assembly processes. J Chem Phys 1993;98:3475-3487.
- [17] Dill KA, Fiebig KM, Chan HS. Cooperativity in protein-folding kinetics. Proc Natl Acad Sci USA 1993;90:1942-1946.
- [18] Muñoz V, Eaton, WA. A simple model for calculating the kinetics of protein folding from threedimensional structures. Proc Natl Acad Sci USA 1999;96:11311-11316.
- [19] Bruscolini P, Pelizzola A. Exact solution of the Munoz-Eaton model for protein folding. Phys Rev Lett 2002;88:258101.
- [20] Alm E, Baker D. Prediction of protein-folding mechanisms from free-energy landscapes derived from native structures. Proc Natl Acad Sci USA 1999;96:11305-11310.
- [21] Alm E, Morozov AV, Kortemme T, Baker D. Simple physical models connect theory and experiment in protein folding kinetics. J Mol Biol 2002;322:463-476.
- [22] Galzitskaya OV, Finkelstein AV. A theoretical search for folding/unfolding nuclei in three-dimensional protein structures. Proc Natl Acad Sci USA 1999;96: 11299-11304.
- [23] Debe DA, Goddard WA. First principles prediction of protein folding rates. J Mol Biol 1999;294:619-625.
- [24] Guerois R, Serrano L. The SH3-fold family: Experimental evidence and prediction of variations in the folding pathways. J Mol Biol 2000;304:967-982.
- [25] Clementi C, Nymeyer H, Onuchic JN. Topological and energetic factors: What determines the structural details of the transition state ensemble and “en-route” intermediates for protein folding? An investigation for small globular proteins. J Mol Biol 2000;298:937-953.
- [26] Hoang TX, Cieplak M. Sequencing of folding events in Go-type proteins. J Chem Phys 2000;113:8319-8328.
- [27] Li L, Shakhnovich EI. Constructing, verifying, and dissecting the folding transition state of chymotrypsin inhibitor 2 with all-atom simulations. Proc Natl Acad Sci USA 2001;98:13014-13018.
- [28] Portman JJ, Takada S, Wolynes PG. Microscopic theory of protein folding rates. I. Fine structure of the free energy profile and folding routes from a variational approach. J Chem Phys 2001;114:5069-5081.
- [29] Kameda T. Importance of sequence specificity for predicting protein folding pathways: Perturbed Gaussian chain model. Proteins 2003;53:616-628.
- [30] Klimov DK, Thirumalai D. Stiffness of the distal loop restricts the structural heterogeneity of the transition state ensemble in SH3 domains. J Mol Biol 2002; 317:721-737.
- [31] Flammini A, Banavar JR, Maritan A. Energy landscape and native-state structure of proteins – a simplified model. Europhys Lett 2002;58:623-629.
- [32] Weikl TR, Dill KA. Folding rates and low-entropy-loss routes of two-state proteins. J Mol Biol 2003;329:585-598.
- [33] Weikl TR, Dill KA. Folding kinetics of two-state proteins: Effect of circularization, permutation, and crosslinks J Mol Biol 2003;332:953-963.
- [34] Weikl TR. Loop-closure events during protein folding: Rationalizing the shape of -value distributions. Proteins 2005;60:701-711.
- [35] Wallin S, Chan HS. A critical assessment of the topomer search model of protein folding using a continuum explicit-chain model with extensive conformational sampling. Protein Sci 2005;14:1643-1660.
- [36] Jacobson H, Stockmayer WH. Intramolecular reaction in polycondensations. I. The theory of linear systems. J Chem Phys 1950; 18:1600-1606.
- [37] Chan HS, Dill KA. The effects of internal constraints on the configurations of chain molecules. J Chem Phys 1990; 92:3118-3135.
- [38] Camacho CJ, Thirumalai D. Theoretical predictions of folding pathways by using the proximity rule, with applications to bovine pancreatic trypsin inhibitor. Proc Natl Acad Sci USA 1995;92:1277-1281.
- [39] Zhou H.-X. Effect of backbone cyclization on protein folding stability: Chain entropies of both the unfolded and the folded states are restricted. J Mol Biol 2003;332:257-264.
- [40] Zhou H.-X. Loops, linkages, rings, catenanes, cages, and crowders: Entropy-based strategies for stabilizing proteins. Acc Chem Res 2004;37:123-130.
- [41] Ivankov DN, Garbuzynskiy SO, Alm E, Plaxco KW, Baker D, Finkelstein AV. Contact order revisited: Influence of protein size on the folding rate. Protein Sci 2003;12:2057-2062.
- [42] Riddle DS, Grantcharova VP, Santiago JV, Alm E, Ruczinski I, Baker D. Experiment and theory highlight role of native state topology in SH3 folding. Nature Struct Biol 1999;6:1016-1024.
- [43] Baker D. A surprising simplicity to protein folding. Nature 2000;405:39-42.
- [44] Burton RE, Huang GS, Daugherty MA, Fullbright PW, Oas TG. Microsecond protein folding through a compact transition state. J Mol Biol 1996;263:311-322.
- [45] Yang WY, Gruebele M. Folding at the speed limit. Nature 2003;423:193-197.
- [46] Viguera AR, Serrano L, Wilmanns M. Different folding transition states may result in the same native structure. Nat Struct Biol 1996;3:874-880.
- [47] Lindberg MO, Tangrot J, Otzen DE, Dolgikh DA, Finkelstein AV, Oliveberg M. Folding of circular permutants with decreased contact order: General trend balanced by protein stability. J Mol Biol 2001;314:891-900.
- [48] Lindberg, M., Tangrot, J., & Oliveberg, M. Complete change of the protein folding transition state upon circular permutation. Nature Struct. Biol. 9, 818-822 (2001).
- [49] Miller EJ, Fischer KF, Marqusee S. Experimental evaluation of topological parameters determining protein-folding rates. Proc Natl Acad Sci USA 2002;99:10359-10363.
Table 1: Two-state proteins without crosslinks
protein
PDB file
rel. CO (%)
rel. logCO (%)
length (residues)
Cyt b562
256B
5.30
7.5
24.7
106
myoglobin
1BZP
4.83
8.0
25.1
153
-repressor
1LMB3
4.78
9.4
26.0
80
PSBD
2PDDb
4.20
11.0
24.9
41
Cyt c
1HRCc
3.80
11.2
29.6
104
Im9
1IMQ
3.16
12.1
29.7
86
ACBP
2ABD
2.85
14.3
32.0
86
Villin 14T
2VIK
3.25
12.3
33.5
126
N-term L9
1DIVd
2.87
12.7
29.6
56
Ubiquitin
1UBQ
3.19
15.1
33.2
76
CI2
2CI2e
1.75
15.7
32.2
64
U1A
1URNA
2.53
16.9
34.7
96
Ada2h
1AYEf
2.88
16.7
33.0
80
Protein G
1PGB
2.46
17.3
34.4
56
Protein L
1HZ6Ag
1.78
16.1
33.8
62
FKBP
1FKB
0.60
17.7
37.3
107
HPr
1POH
1.17
17.6
34.6
85
MerP
1AFI
0.26
18.9
36.7
72
mAcP
1APS
21.7
40.0
98
CspB
1CSP
2.84
16.4
35.7
67
TNfn3
1TENh
0.46
17.4
37.6
89
TI I27
1TIT
1.51
17.8
36.4
89
Fyn SH3
1SHF
1.97
18.3
36.7
59
Twitchin
1WIT
0.18
20.3
40.9
93
PsaE
1PSF
0.51
17.0
34.5
69
Sso7d
1BNZA
3.02
12.2
30.8
64
aExperimental values for the folding rates are from Table 1 of Grantcharova et al.[3]. bResidues 3 to 43. cResidues 1 to 104. dResidues 1 to 56. eResidues 20 to 83. fResidues 4A to 85A. gResidues 1 to 62. hResidues 803 to 891. – For NMR structures with multiple models, the values for the rel. CO and rel. logCO are averages over all models. Alternate locations for atoms in PDB files have been discarded to avoid double or triple counting of corresponding contacts.
Table 2: Two-state proteins with crosslinks
| protein | Ref. | PDB file | length | crosslink(s) | a | rel. ECO | rel. CO | rel. logECO | rel. logCO |
|---|---|---|---|---|---|---|---|---|---|
| circularized CI2 | [13] | 2CI2b | 64 | 3/63 | 2.64 | 9.4 | 15.7 | 27.8 | 32.2 |
| src SH3 with SS 35/50 | [14] | 1SRL | 56 | 35/50 | 3.15 | 14.8 | 19.6 | 32.4 | 36.6 |
| src SH3 with SS 1/25 | [14] | 1SRL | 56 | 1/25 | 1.99 | 15.7 | 19.6 | 34.3 | 36.6 |
| circularized src SH3 | [14] | 1SRL | 56 | 1/56 | 2.39 | 11.8 | 19.6 | 31.4 | 36.6 |
| wild-type tendamistat | [12] | 2AIT | 74 | 11/27, 45/73 | 1.82 | 14.3 | 21.1 | 36.5 | 41.4 |
| tendamistat w/o SS 11/27 | [12] | 2AIT | 74 | 45/73 | 0.88 | 16.3 | 21.1 | 38.4 | 41.4 |
| tendamistat w/o SS 45/73 | [12] | 2AIT | 74 | 11/27 | 0.32 | 19.2 | 21.1 | 39.8 | 41.4 |
| circularized c-Crk SH3 | [15] | 1CKBc | 57d | 1/56d | 0.86 | 13.5 | 20.3 | 34.5 | 38.7 |
aFolding rates in pure water and units of . For circularized CI2 and the crosslinked mutants of the the src SH3 domain, folding rates in water have been extrapolated using the -values given in the references. bResidues 20 to 83. cResidues 135 to 190. dThe N- and C-termini are crosslinked via an inserted glycine residue. To calculate the rel. ECO and rel. logECO for the circularized chain, we simply assume that this glycine residue makes 25 non-hydrogen atom contacts with the nearest neighbor residues 1 and 56, and 10 contacts with the next-nearest neighbor residues 2 and 55 (these are typical numbers for glycine residues), but makes no contacts with other residues. We also assume the residues 1 and 56 have 10 contacts in the circularized chain.