Improving Stellar and Planetary Parameters of Transiting Planet Systems: The Case of TrES-2
Abstract
We report on a spectroscopic determination of the atmospheric parameters and chemical abundance of the parent star of the recently discovered transiting planet TrES-2. A detailed LTE analysis of a set of Fe I and Fe II lines from our Keck spectra yields K, , and [Fe/H] . Several independent checks (e.g., additional spectroscopy, line-depth ratios) confirm the reliability of our spectroscopic estimate. The mass and radius of the star, needed to determine the properties of the planet, are traditionally inferred by comparison with stellar evolution models using and some measure of the stellar luminosity, such as the spectroscopic surface gravity (when a trigonometric parallax is unavailable, as in this case). We apply here a new method in which we use instead of the normalized separation (related to the stellar density), which can be determined directly from the light curves of transiting planets with much greater precision. With the value from the light curve analysis of Holman et al. () and our estimate we obtain and , and an evolutionary age of Gyr, in good agreement with other constraints based on the strength of the emission in the Ca II H & K line cores, the Lithium abundance, and rotation. The new stellar parameters yield improved values for the planetary mass and radius of and , confirming that TrES-2 is the most massive among the currently known nearby ( pc) transiting hot Jupiters. The surface gravity of the planet, , can be derived independently of the knowledge of the stellar parameters (i.e., directly from observations), and with a very high precision rivaling that of the best known double-lined eclipsing binaries.
1 Introduction
Our understanding of the structural and evolutionary properties of close-in extrasolar planets (radius, mass, density) is continuously improved by new detections of transiting planets. Fourteen such systems are known to date111For a summary of their properties see, for example, Burrows et al., 2007 or obswww.unige.ch/pont/TRANSITS.htm .. The accelerated rate at which such systems have been discovered of late suggests the prospects are bright for transit-search projects, as well as for the possibility of critically testing physical models of hot Jupiters in the near future based on statistically significant ensemble properties of transiting planet systems (for a review see Charbonneau et al., 2007a ).
The accurate determination of the physical properties of transiting exoplanets depends critically upon our knowledge of a number of basic parameters of the parent stars. In particular, the mass and radius of a planet, which are of fundamental importance for testing theoretical predictions of planetary structure (e.g., Guillot & Showman, 2002; Bodenheimer et al., 2003; Baraffe et al., 2003; Burrows et al., 2007. For a review see for example Guillot, 2005 and Burrows, 2005, and references therein), depend rather directly on the mass and radius of the parent star, placing strict demands on the accuracy of the latter. Evidence for correlations between transiting planet properties and stellar characteristics such as metallicity (Guillot et al., 2006; Burrows et al., 2007), and their implications for competing giant planet formation models (e.g., Ida & Lin, 2004a , ; Kornet et al., 2005; Alibert et al., 2005; Boss, 2000, 2002; Mayer et al., 2004), relies in turn on the accurate determination of chemical abundances of the host stars. Attempts to constrain the amount of mass loss experienced by hot and very-hot Jupiters (Melo et al., 2006), to refine our knowledge of their relative frequencies (e.g., Gaudi, 2005) as well as to compare observations with theoretical evaporation rates of insolated giant planets (Lammer et al., 2003; Baraffe et al., 2004; Lecavelier des Etangs et al., 2004; Lecavelier des Etangs, 2006) are severely affected by large uncertainties in the determination of stellar ages, which can become pathological for field stars, depending on spectral type. Finally, the accurate determination of parent star parameters requires particular attention in cases in which a direct distance estimate to the system (trigonometric parallax) is unavailable. For about 2/3 of the presently known nearby transiting systems ( pc), and for over 3/4 of the full sample, such measurements are not available at the present time, and will only be made possible by future high-precision astrometric observatories, both on the ground and in space (e.g., Sozzetti, 2005, and references therein).
Among the recently discovered transiting extrasolar planets, TrES-2 (O’Donovan et al., 2006) is the first detected in the field of view of the Kepler mission (Borucki et al., 2003). It has the largest impact parameter, and is the most massive planet, among the currently known nearby transiting systems (Charbonneau et al., 2007b ). In this work we report on a detailed spectroscopic determination of the properties of the parent star of TrES-2, including the effective temperature and surface gravity, as well as the chemical abundances of iron and lithium. We also measure the chromospheric activity and provide constraints on the age of the system from this and other indicators. Because of the importance of the effective temperature for deriving other stellar characteristics, we have made an effort to provide several external checks on its accuracy. We then use these properties along with other constraints from the light curve analysis of Holman et al. () to infer the mass and radius of the star with realistic uncertainties. In particular, we show how the use of the stellar density obtained directly from the light curve fit is in this case a much better proxy for luminosity than the spectroscopic surface gravity, typically used in cases such as this in which the parallax is unknown. Our new stellar parameters in turn lead to improved values for the mass and radius of the planet over those reported by O’Donovan et al. (2006). We conclude by providing a summary of our results and by revisiting some of the evidence connecting the properties of close-in extrasolar planets to the characteristics of their parent stars.
2 Observations
The spectroscopic observations used here are the same as described previously by O’Donovan et al. (2006). Briefly, they consist of twelve echelle spectra obtained with the HIRES spectrograph on the Keck 1 telescope (Vogt et al., 1994) during the summer of 2006, with a nominal resolving power . Eleven of these spectra were obtained with an I2 cell placed in front of the slit to provide a wavelength fiducial for high-precision velocity determinations (see, e.g., Butler et al., 1996), with typical exposure times of 15 min resulting in an average pixel-1. One additional spectrum was obtained without the cell for use as a template. The effective wavelength coverage provided by the three-CCD array of HIRES is 3200–8800 Å. Additionally we used 5 echelle spectra obtained with the Center for Astrophysics (CfA) Digital Speedometers (Latham, 1992), which cover 45 Å centered at 5187 Å at a resolving power , and have ratios ranging from 10 to 15 per resolution element.
3 Atmospheric parameters
A detailed analysis of the template spectrum obtained with the Keck telescope was carried out following the same procedures described in detail by Sozzetti et al. (2004, 2006, and references therein) in order to determine the effective temperature (), surface gravity (), and iron abundance [Fe/H] of TrES-2. A set of 30 relatively weak lines of Fe I and 4 of Fe II were selected, and equivalent widths (EWs) were measured using the splot task in IRAF222IRAF is distributed by the National Optical Astronomy Observatories, operated by the Association of Universities for Research in Astronomy, Inc., under contract with the National Science Foundation, USA.. Metal abundances are derived under the assumption of local thermodynamic equilibrium (LTE), using the 2002 version of the spectral synthesis code MOOG (Sneden, 1973)333http://verdi.as.utexas.edu/moog.html ., a grid of Kurucz ATLAS plane-parallel model stellar atmospheres (Kurucz, 1993), and imposing excitation and ionization equilibrium. We obtained K, , km s-1, and [Fe/H] = . The uncertainties in the first three parameters were estimated following the prescriptions of Neuforge & Magain (1997) and Gonzalez & Vanture (1998), and were rounded off to the nearest 25 K in , 0.1 dex in , and 0.05 km s-1 in . For [Fe/H] the uncertainty given corresponds to the scatter obtained from the Fe I lines rather than the formal error of the mean, since we consider the latter to be unrealistically small in this case. No significant departures from LTE are expected for a star with the temperature and metallicity of TrES-2 (e.g., Yong et al., 2004), so for the purpose of this study we have not included non-LTE effects in our spectroscopic analysis. We also quantified the sensitivity of our iron abundance determination to variations of with respect to the nominal , , and values, and found changes in [Fe/H] of at most 0.06 dex, below the adopted uncertainty of 0.1 dex. Finally, we determined also the projected rotational velocity as km s-1, based on the synthesis of a set of unblended Fe I lines, following Gonzalez (1998).
The new values for the stellar parameters are consistent with the G0 V spectral type implied by the colors (O’Donovan et al., 2006), and are in generally good agreement with those presented by those authors. We note, however, that our value is somewhat lower, possibly due to the fact that O’Donovan et al. (2006) assumed solar metallicity in their study, whereas our analysis indicates a slightly metal-deficient composition.
3.1 Consistency checks on the estimate
Given the importance of the temperature determination for establishing the absolute mass and radius of the parent star of TrES-2, we present in this section a number of other consistency checks that illustrate the reliability and accuracy of our estimate above.
3.1.1 Estimate from the CfA spectra
Cross-correlation of our CfA spectra against a large library of synthetic templates in the manner described by O’Donovan et al. (2006) provides an independent estimate of the photospheric properties of the star. By testing all combinations of the four main parameters of these templates (, , metallicity [m/H], and ) we seek to maximize the correlation averaged over the 5 available spectra. In principle this allows the determination of the four parameters, although in practice the narrow wavelength coverage of only 45 Å results in strong correlations between some of those properties. We therefore determined the first two of these quantities along with for fixed metallicities of [m/H] = 0.0 (solar) and [m/H] , which bracket our determination in §3, and then interpolated to [m/H] . The results are K, , and km s-1, which supersede the values given by O’Donovan et al. (2006) that were based on a preliminary analysis. The temperature is only 60 K lower than our determination in §3, well within the errors. There is also excellent agreement in and .
3.1.2 Spectral line-depth ratios
Among the many diagnostics available for effective temperature estimation, the ratio of the depths of two spectral lines having different sensitivity to temperature is among the most powerful. Indeed, the line-depth ratio (LDR) technique allows the measurement of temperature differences of the order of a few Kelvin in favorable cases (Gray & Johanson, 1991; Gray, 1994; Strassmeier & Schordan, 2000; Gray & Brown, 2001; Catalano et al., 2002; Caccin et al., 2002; Kovtyukh et al., 2003; Biazzo et al., 2007), a much higher accuracy than currently possible with other methods that seek to determine temperatures on an absolute scale. The latter typically have uncertainties of at least 50–100 K. Absolute temperature determinations with the LDR method still require translation to an absolute scale, usually through color/temperature calibrations since the LDR measurements are typically calibrated first against color indices, which are directly observable.
In order to provide a further check of our spectroscopic determination, we selected in our Keck template spectrum 9 pairs of temperature-sensitive lines from the list of Biazzo et al. (2007) in the red part of the spectrum (–6280 Å). These authors provide calibrations between LDRs and temperature for a range of rotational velocities (those for zero rotation were adopted here), which include corrections for surface gravity and are valid in the range 3800 K K. Metallicity effects are negligible for stars near the solar abundance (Gray, 1994; Biazzo et al., 2007). The absolute temperatures derived in this way rely implicitly on an intermediate calibration between the color and adopted from Gray (2005). In order to provide consistency with the calibrations we use below, we have converted each of our 9 temperature estimates back into and then into temperature again adopting the calibrations by Ramírez & Meléndez (2005), which have been compared carefully against absolute temperature determinations using the Infrared Flux Method. The average temperature we obtain in this way is K, in agreement with our estimates above.
3.1.3 Hα line profile
The strong sensitivity of the wings of the Hα line profile to temperature variations, as well as the relatively weak sensitivity to changes in surface gravity and metal abundance, make this feature a very useful temperature indicator for solar-type dwarfs (e.g., Fuhrmann et al., 1993; Barklem et al., 2002). The core of the line, however, is formed higher up in the atmosphere under conditions that violate LTE, so is not useful here. As an additional consistency check on we therefore compared the Hα line profile outside of the core in our Keck template spectrum against synthetic profiles for solar-metallicity dwarfs ([m/H] = 0.0, ) from the Kurucz database. In Figure 1 we show the normalized flux in a 10 Å region centered on Hα, and four calculated profiles for different values of . Temperatures significantly hotter than 6000 K or significantly cooler than 5750 K appear inconsistent with the observed profile, and suggest the optimal value is somewhere in between. Because of the difficulties in the placement of the continuum for such a broad line in an echelle spectrum, we view this comparison only as a rough check. Nevertheless, it agrees once again with our previous estimates.
3.1.4 Photometric estimates
Photometric measurements for TrES-2 are available in the Johnson, Cousins, Tycho, and 2MASS systems, as listed by O’Donovan et al. (2006). Based on these data and assuming zero reddening we have computed 7 different color indices (not all completely independent of each other) and applied the calibrations of Ramírez & Meléndez (2005) for a fixed metallicity of [Fe/H] to obtain effective temperatures. There is excellent agreement between these estimates, and the average is K. This is 170 K cooler than our spectroscopic determination in §3, a difference that is significantly larger than allowed by the combined uncertainties. However, in view of the distance to the object of 230 pc (O’Donovan et al., 2006; see also below), a small amount of reddening would not be entirely unexpected, and was also suspected by those authors. We find that if we applied a correction to the individual color indices corresponding to mag, the average temperature would agree exactly with our spectroscopic value. Indirect support for this amount of interstellar material is provided by the reddening maps of Burstein & Heiles (1982) and Schlegel et al. (1998), which indicate total values along the line of sight to TrES-2 of 0.05 mag and 0.07 mag, respectively. For the distance of TrES-2 and using the Drimmel & Spergel (2001) model of Galactic dust distribution these numbers are reduced to and 0.03 mag, respectively. Further support is given by the comparison between the observed colors and those predicted from stellar evolution models described below, which gives .
4 Constraints on the stellar age
Age determination for individual stars in the field is a difficult task. A variety of indicators is available, such as Hα emission, X-ray activity, lithium abundance, Ca II H & K emission, asteroseismology, rotation, and Galactic space motion, some more constraining than others depending on the particular case. While the relative agreement among multiple methods allows in principle for fairly reliable dating of stars with ages comparable to the age of the Hyades or younger, constraints on ages for individual stars with Gyr are usually quite weak. Here we have used the Ca II activity indicator and the lithium abundance as measured in our HIRES spectra of TrES-2 in an attempt to inform the theoretical models used for the determination of the stellar mass and radius (see next Section).
In the top panel of Figure 2 we show a region of the HIRES template spectrum centered on the Ca II H line. No significant emission feature is present, and the same is true for the other Keck spectra we collected using the I2 cell (in which the iodine lines do not interfere because there are none shortward of 5000 Å). Following the procedure outlined in Sozzetti et al. (2004), we have measured the chromospheric activity index S (e.g., Duncan et al. 1991) from the Ca II H and K lines in our spectra, and then converted it into the chromospheric emission ratio , corrected for the photospheric contribution. For TrES-2, the Mount Wilson index, averaged over all our spectra, is , and the resulting (with formal uncertainties calculated from the scatter of individual measurements), suggesting a quite inactive star. The resulting chromospheric age estimate, using the relations summarized in Wright et al. (2004), is Gyr.
We point out, however, that this estimate should not be taken at face value for a number of reasons. Firstly, it has been shown (e.g., Pace & Pasquini, 2004) that chromospheric activity can only be considered a reliable age estimator up to Gyr, and that for stars showing low activity levels the ages derived are only lower limits. Secondly, because stars have activity cycles like the Sun, the proper measure of the chromospheric flux to use in determining the age of an individual star is an average over the entire magnetic cycle rather than a quasi-instantaneous value such as is available to us, to avoid the possibility of finding a star in a Maunder minimum phase (Henry et al., 1996; Wright et al., 2004). Finally, there are hints (Song et al., 2004) that chromospheric age estimates tend to be systematically older than those derived with other methods, suggesting perhaps the need for re-calibration of the Ca II activity-based ages. Therefore, all we can claim here is that the lower limit for the chromospheric age of TrES-2 is a few Gyr.
TrES-2 displays a significant Li 6707.8 absorption feature. We have carried out a detailed spectral synthesis of a 10 Å region of the Keck template spectrum centered on this line, using the atmospheric parameters derived from the Fe-line analysis and the line list of Reddy et al. (2002). In the bottom panel of Figure 2 we show the comparison of the spectrum of TrES-2 with three synthetic spectra, each differing only in the Li abundance assumed. The best-fit model results in an abundance of . As shown in Figure 3, the Li abundance we obtain does not appear out of the ordinary in relation to those of other planet host stars of similar temperature, as measured by Israelian et al. (2004) (once typical uncertainties of the order of 50-100 K on the determinations are considered). By comparison with Li abundance curves as a function of effective temperature for clusters of different ages (Sestito & Randich, 2005) we infer for TrES-2 an age of about 1–2 Gyr. This value would point to a somewhat younger age than the one inferred from the Ca II measurements. However, it is not uncommon to observe a large spread in Li abundance among stars in the same cluster that appear otherwise identical (Randich et al., 2006), so also in this case it seems safer to simply report a lower limit to the age of TrES-2 of 1–2 Gyr 444However, we point out how one can speculate on the possibility that self-enrichment (see, e.g., Gonzalez 2006, and references therein, for a review of the issue), rather than systematics or uncertainties in the calibration of activity-age relations, could be a factor to consider for TrES-2. If the star has witnessed recent events of accretion of planetary material, this could explain both the somewhat higher than usual Lithium abundance with respect to other planet hosts of the same , as well as the apparent discrepancy between the youth indicators. The measurement of statistically significant trends of element abundance with condensation temperature (e.g., Sozzetti et al. 2006; Gonzalez 2005, 2006, and references therein) or detection of the 6Li isotope (e.g., Israelian et al. 2001, 2003; Gonzalez 2006, and references therein) in the atmosphere of TrES-2 would be strong evidence in support of the self-enrichment scenario for this star. Further spectroscopic measurements of TrES-2 are thus clearly encouraged.
5 Stellar mass and radius
A common procedure for deriving the absolute mass and radius of planet host stars, needed to infer those of the transiting object, is to compare the measured stellar properties such as temperature and luminosity with stellar evolution models in the H-R diagram, or in some equivalent parameter space. Because the distance to TrES-2 is not precisely known (it was not observed during the Hipparcos mission), we do not have direct access to its luminosity. An alternative measure of intrinsic brightness (or evolution) that has been used in the past is the spectroscopically determined value of (see, e.g., Konacki et al., 2003, 2004, 2005; Pont et al., 2004; Bouchy et al., 2005; Santos et al., 2006). Surface gravities are typically very difficult to determine accurately in this way, and as a result the constraint on the stellar radius is relatively weak. Here we explore in detail the possibility of using other information available in transiting systems such as TrES-2, that provide much tighter constraints on the luminosity, as also noted recently by Pont et al. (2007). We focus in particular on the quantities obtainable by fitting the transit light curves. The three main adjustable parameters (see, e.g., Mandel & Agol, 2002) are often taken to be the relative radius of the planet (), the impact parameter (), and the normalized separation between the star and the planet (), where is the semimajor axis of the relative orbit and is the inclination to the line of sight. These are largely independent of the stellar properties, except for a weak dependence on the limb-darkening coefficients (a second-order effect) that are typically a function of effective temperature, surface gravity, and composition555In some cases even this weak dependence can be avoided altogether by fitting for the limb-darkening coefficients simultaneously with the other three parameters of the transit light curve.. One of these, , contains information intrinsic to the star: using Kepler’s Third Law (as revised by Newton) it can be shown that
| (1) |
(see also Seager & Mallén-Ornelas, 2003) where all quantities are expressed in cgs units and is the Newtonian gravitational constant. The left-hand side corresponds essentially to the stellar density, . Note that the first term on the right is entirely determined from measurable quantities: the orbital period ( days; O’Donovan et al., 2006), and from the light curve fit. The second term on the right, on the other hand, involves the planetary mass (which is unknown until the stellar mass is determined) as well as (also unknown). However, the size of this second term is typically two to three orders of magnitude smaller than the first for most transiting exoplanets including TrES-2, so it can safely be ignored for all practical purposes. Thus the density of the star is determined directly from the observations, with no additional assumptions. In this particular case the accuracy of the determination (; Holman et al., 2007b ) is very high: the uncertainty is only 1.6%. The stellar density is a sensitive measure of evolution or luminosity, and as such it provides a very useful constraint on the size of the star. We use it along with the effective temperature and the measured metallicity to establish the absolute mass and radius of TrES-2.
We proceed by comparing (or a closely related quantity; see below) and with current stellar evolution models from the Yonsei-Yale series by Yi et al. (2001) (see also Demarque et al., 2004). We explored the agreement with model isochrones calculated over a wide a range of uniformly spaced ages (0.1–9 Gyr) spanning the full range of metallicities allowed by our spectroscopic determination ([Fe/H] ). Along each isochrone we computed the theoretical stellar properties using a fine step in mass, and at each of these points we compared those properties with the observations, and recorded all cases yielding a match within the observational errors. In this way we established the range of permitted values of the stellar mass and radius. All these matching models were assigned the same likelihood for this application. In practice, we have chosen to compare the models with the observations directly in the observational plane ( versus , rather than versus ). Therefore, instead of computing the stellar density along the isochrones and comparing it with the measured value of , we computed the theoretical values of (which is essentially the cube root of the density) from an expression obtained by rearranging eq. 1,
| (2) |
and compared them with the value resulting from the light-curve fit, (Holman et al., 2007b ). As discussed above, we have ignored here the small contribution from the mass of the planet, .666If the need ever arose (for example, for much more massive planets), it would be trivial to account for this small correction term by simply using a rough estimate of the planet mass in eq. 2 to compute the predicted values of .
The best match with the models (which produces virtually perfect agreement with the measured parameters and ) is achieved for a stellar mass of , a radius of , and an age of Gyr. The uncertainties listed reflect the spread allowed by the observational errors in , , and [Fe/H], and exclude any systematics in the models themselves, which are difficult to quantify. The surface gravity of the star for the best fit is , in excellent agreement with our spectroscopically measured value in §3, and the corresponding metal abundance for this best fit is [Fe/H] , also virtually the same as the measured value. The models indicate for the star an age similar to the Sun, which is entirely consistent with the lower limits discussed earlier based on the activity indicators and Li.
The absolute visual magnitude predicted by the models for the adopted mass and age and our measured composition is , and the color expected is . The latter, compared with the measured index of (O’Donovan et al. 2006) suggests a small amount of reddening of mag, not inconsistent with several other estimates discussed in §3.1.4. This corresponds to a visual extinction mag. Accounting for this we derive a distance to TrES-2 of 220 pc with an estimated uncertainty of 10 pc. With the mean radial velocity of km s-1 as reported by O’Donovan et al. (2006), and UCAC2 (Zacharias et al., 2004) proper motion components [, ] = [4.45, 3.40] mas yr-1, the Galactic space motion vector of the star is [, , ] = [1.81, +0.88, 5.51] km s-1 (where is taken to be positive toward the Galactic anti-center). We collect these results along with other properties derived previously in Table 1.
Our stellar mass is 10% smaller than the value of adopted by O’Donovan et al. (2006), which is in part due to our using a lower heavy element abundance, derived from our detailed chemical analysis, as opposed to adopting the solar composition. The stellar radius, on the other hand, is the same.
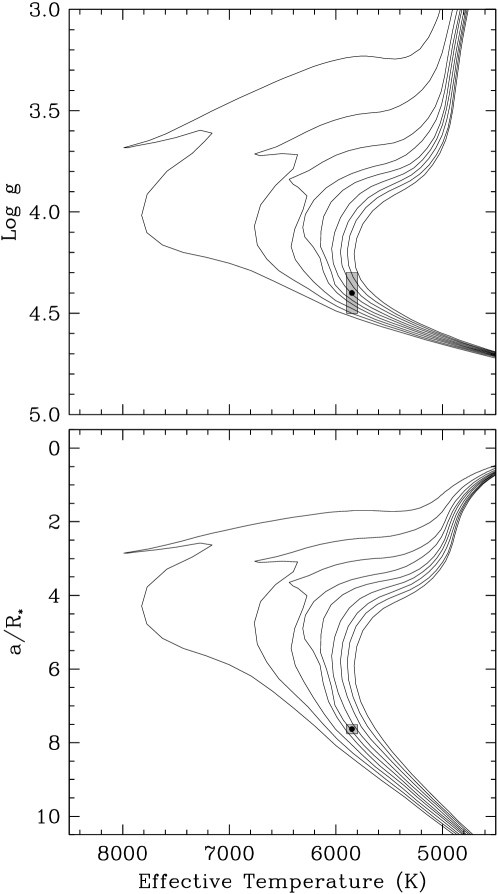
The fairly tight constraints we have obtained on the radius of the star (errors less than 4%) are the result of using the information on derived from the light-curve fit of Holman et al. (). Had we used the spectroscopically determined surface gravity instead, we estimate the constraint would have been some 5 times weaker. This is illustrated in Figure 4, where the top panel shows Yonsei-Yale isochrones for ages of 1 Gyr to 9 Gyr and a heavy element abundance equal to the measured value of [Fe/H]. The shaded error box represents the uncertainties in the measured and of TrES-2. As seen, the error in gravity is so large as to span the full range of ages shown here, thus providing essentially no useful constraint on age and a weak one on . In the lower panel we have re-mapped the vertical axis to (using the measured orbital period ; see eq. 2). The error box in this case is significantly smaller, making a much better measure of the luminosity than surface gravity. We propose that the same procedure should be used in other transiting planets in which the quality of the light curves is sufficient to provide a superior constraint compared to surface gravity. Depending on the case, the accuracy of could be high enough that it may even compare favorably with the constraint afforded by a direct knowledge of the parallax.
6 Revised planetary parameters
The improved knowledge of the mass and radius of the parent star has a direct impact on the accuracy of the planetary parameters of TrES-2. We have combined the stellar properties in Table 1 with the mass function from the spectroscopic orbit of O’Donovan et al. (2006), , and the fitted light-curve parameters from the new photometric analysis of Holman et al. (), which are , , and . We obtain for the planet and 777The equatorial radius adopted for Jupiter is 71 492 km. These are some 6% and 1% smaller than the values reported by O’Donovan et al. (2006), respectively.
An important but generally overlooked property of the spectroscopic and photometric solutions for transiting planets is the fact that the surface gravity of the planet is directly measurable from the observations, with no need to know the mass or radius of the parent star (see, e.g., Winn et al., 2007b ). The same was pointed out by Beatty et al., (2007) in the context of mass and radius determinations for small stars in single-lined eclipsing binaries, and also by Southworth et al. (2004, 2007). This derives from the quadratic relation between and that can easily be obtained from the definition of the spectroscopic mass function and Kepler’s Third Law:
| (3) |
In this expression represents the velocity semi-amplitude of the star in response to the pull from the planet ( m s-1 for TrES-2; O’Donovan et al., 2006), and the eccentricity of the orbit, which is usually found to be very close to zero for transiting planets. The quantities , , and are obtained directly from the light curve analysis, often with very high precision as in our case. The surface gravity of the planet follows immediately as:
| (4) |
The numerical constant is such that the gravity is in cgs units when and are expressed in their usual units of days and m s-1. For TrES-2 we obtain , in which the uncertainty includes all contributions from measured quantities. We call the reader’s attention to the very high precision of this determination, which rivals that of the best-known double-lined eclipsing binaries (see, e.g., Andersen, 1991). While the planetary masses and radii in transiting systems have typically been the main focus of investigators in this field, and with good reason, those quantities depend critically on the mass and radius of the parent star, which are often the weak link in the chain and usually rely on stellar evolution models. Surface gravities are much closer to the observations, are model-independent, and can often be obtained with very high precision as in the case of TrES-2. Accurately determined surface gravities of planets are potentially important for constraining theoretical calculations of the spectra of extrasolar planets. These have now begun to be tested through infrared photometry of the secondary eclipses as well as transmission spectroscopy in several cases (see for example Charbonneau et al., 2007a , and references therein).
7 Summary and discussion
Our high-resolution, high- spectra from Keck/HIRES have allowed us to derive new and accurate values of the stellar atmospheric parameters of the parent star of the transiting planet TrES-2, principally the effective temperature and metallicity, which have in turn yielded improved parameters for the star. The G0V main-sequence dwarf appears to have a metal abundance very similar to the average of the solar neighborhood ([Fe/H], see for example Nordström et al., 2004), making it nominally the most metal-deficient case in the current sample of transiting planets (e.g., Burrows et al., 2007). The reliability of our temperature estimate is strongly supported by the results of several independent checks we have carried out (some more constraining than others), all of which are in good agreement (additional spectroscopy, line depth ratios, and Hα line profiles). The old age (similar to the Sun) we infer for TrES-2 is also supported by results from the measurements of the Ca II activity level, the lithium abundance, and rotation, which rule out a very young age for the system. This is consistent with the notion that the planet’s inferred mass escape rate ( g s-1, using the model of Lecavelier des Etangs, 2006) is not very high. The inferred lifetime (tens of Gyr, well outside the evaporation-forbidden region indicated by Lecavelier des Etangs 2006) is long enough that very efficient evaporation scenarios (Baraffe et al., 2004) are not likely to hold in the case of the TrES-2 system.
We have shown that the best constraint on the radius of the parent star comes not from the spectroscopically determined surface gravity (the quantity most often used for this purpose when a trigonometric parallax is unavailable), but from the photometrically determined quantity , which is closely related to the stellar density. This quantity is directly measured from the transit light curve, and depends only very weakly (or in some cases, not at all) on any assumed stellar properties. In this particular case the gain from using this new constraint is about a factor of five in terms of the precision in . Similar arguments for using instead of were made by Pont et al. (2007) regarding the faint parent star of the transiting planet OGLE-TR-10b, although they appear not to have actually applied the method in arriving at the mass and radius of the star reported in their work. With the significant improvements seen recently in the quality of the light curves of several of the known transiting planets (Charbonneau et al., 2006, ; Bakos et al., 2006; Gillon et al., 2006; Holman et al., 2006, , ; Winn et al., 2007a , , ; Knutson et al., 2007; Pont et al., 2007; Minniti et al., 2007; Diaz et al., 2007), the measured values are likely to be much better now than in the original discovery papers. Thus, it may pay to revisit the determination of stellar parameters of many of these systems along the lines of what we have done here, since this should result in significant improvements in the absolute mass and radius estimates of the attending exoplanets as well. Such a study is underway by a subset of the present authors.
Our improved stellar parameters yielding more precise values for the planet mass and radius confirm that TrES-2 is the most massive among the currently known nearby ( pc) transiting hot Jupiters. Although the surface gravity of transiting planets, , has not usually attracted much attention, we point out here that the little-used quadratic relation between the mass and radius of a transiting planet allows the determination of this property of the object purely from observations, free from assumptions about the mass and radius of the parent star. The high accuracy with which can be determined in TrES-2 and other cases makes it a potentially useful constraint to theory.
Among the fourteen extrasolar giant planets known to transit their parent stars, TrES-2 seems to belong to an increasing family of objects (HD 209458b, HAT-P-1b, WASP-1b) whose measured radii apparently disagree with published theoretical models, in that they are larger than expected. In the past, this anomaly was explained invoking a source of internal heat (e.g., Bodenheimer et al., 2001, 2003; Guillot & Showman, 2002; Winn & Holman, 2005), either through eccentricity pumping by more distant companions or through persisting obliquity tides. However, these scenarios have some difficulties (Laughlin et al., 2005; Levrard et al., 2007). More recent work (Burrows et al., 2007) indicates that the discrepancy may be due instead to super-solar metallicities and opacities that naturally retain internal heat, thus helping to keep a hot Jupiter’s radius larger for longer times. The smaller-than-expected radii of other transiting planets (e.g., HD 149026b) can instead be explained by the presence of dense rocky cores, and a correlation has been proposed between inner core masses and host star metallicities (Guillot et al., 2006; Burrows et al., 2007). In this respect, the very small inferred core mass for TrES-2 (Burrows et al., 2007) agrees well with the lower-than-solar iron abundance measured for the parent star.
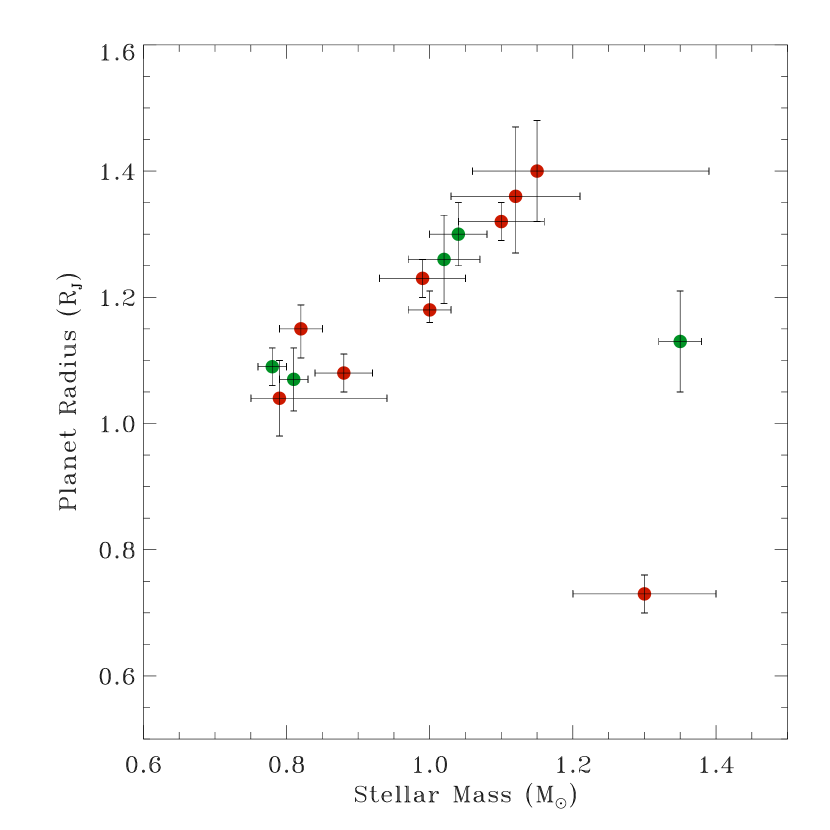
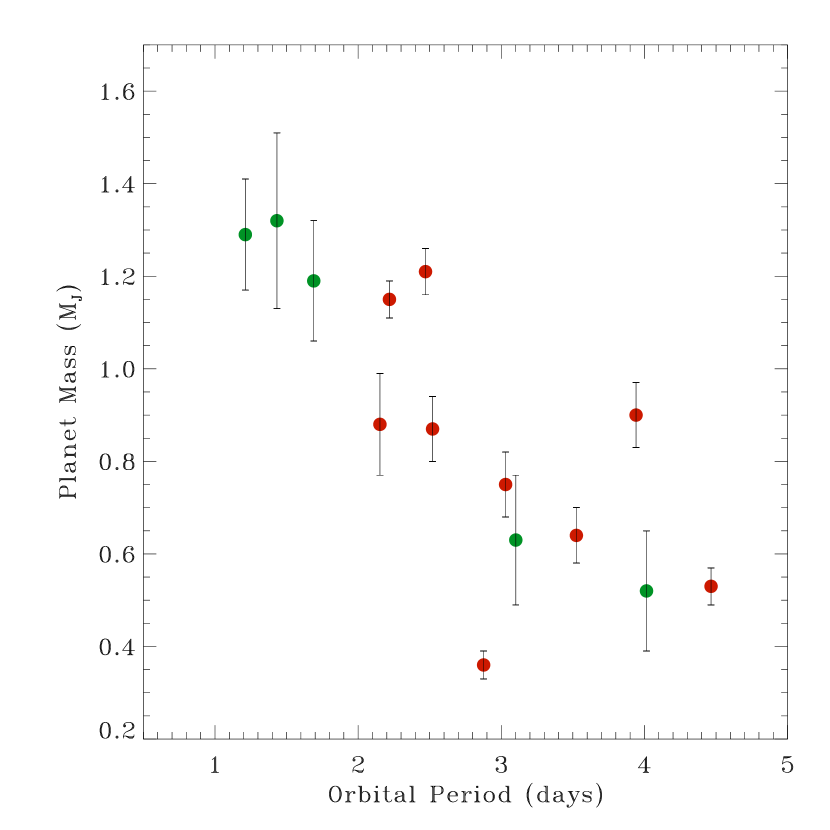
Considering the rapidly growing sample of transiting giant planet systems as an ensemble, other suggestive, albeit preliminary, trends between different planet and/or stellar properties have begun to emerge from the data. Some are easier to explain within the context of the present theoretical framework, while others still await explanation. For example, the apparent trend (with two outliers) seen in Figure 5, left panel, of increasing planet radius with increasing mass of the parent star could be due in part to the fact that close-in planets orbiting more massive stars are more strongly irradiated (Burrows et al., 2007). On the other hand, the trend of decreasing planet mass with increasing orbital period (Figure 5, right panel), first highlighted by Mazeh et al. (2005), appears to be less well understood. We note, however, that in this case the fact that the host sample is composed of relatively bright, nearby dwarfs targeted by wide-field transit surveys as well as fainter, more distant OGLE targets may play some role (see figure caption for details).
The above relations suggest there is a strong interplay between planet properties and host star characteristics, which is hardly unexpected, but it is also clear that the parameter space of properties to be investigated is quite large. Observations of transiting planet systems can best inform structural and evolutionary models when they yield accurate determinations of both planet and stellar properties, through high-precision photometric as well as spectroscopic measurements such as those presented here for the TrES-2 system.
References
- Alibert et al., (2005) Alibert, Y., Mordasini, C., Benz, W., & Winisdoerffer, C. 2005, A&A, 434, 343
- Andersen, (1991) Andersen, J. 1991, A&ARv, 3, 91
- Bakos et al., (2006) Bakos, G. Á., et al. 2006, ApJ, 650, 1160
- Baraffe et al., (2003) Baraffe, I., Chabrier, G., Barman, T., Allard, F., & Hauschildt, P. H. 2003, A&A, 402, 701
- Baraffe et al., (2004) Baraffe, I., Selsis, F., Chabrier, G., Barman, T., Allard, F., Hauschildt, P. H., & Lammer, H. 2004, A&A, 419, L16
- Barklem et al., (2002) Barklem, P. S., Stempels, H. C., Allende Prieto, C., Kochukhov, O. P., Piskunov, N., & O’Mara, B. J. 2002, A&A, 385, 951
- Beatty et al., (2007) Beatty, T. G., et al. 2007, ApJ, submitted
- Biazzo et al., (2007) Biazzo, K., Frasca, A., Catalano, S., & Marilli, E. 2007, AN, in press
- Bodenheimer et al., (2001) Bodenheimer, P., Lin, D. N. C., & Mardling, R. A. 2001, ApJ, 548, 466
- Bodenheimer et al., (2003) Bodenheimer, P., Laughlin, G., & Lin, D. N. C. 2003, ApJ, 592, 555
- Borucki et al., (2003) Borucki, W. J., et al. 2003, Proc. SPIE, 4854, 129
- Boss, (2000) Boss, A. P. 2000, ApJ, 536, L101
- Boss, (2002) Boss, A. P. 2002, ApJ, 567, L149
- Bouchy et al., (2005) Bouchy, F., Pont, F., Melo, C., Santos, N. C., Mayor, M., Queloz, D., & Udry, S. 2005, A&A, 431, 1105
- Bouvier, (1997) Bouvier, J. 1997, MmSAIt, 68, 881
- Burrows, (2005) Burrows, A. 2005, Nature, 433, 261
- Burrows et al., (2007) Burrows, A., Hubeny, I., Budaj, J., & Hubbard, W. B. 2007, ApJ, submitted (astro-ph/0612703)
- Burstein & Heiles, (1982) Burstein, D., & Heiles, C. 1982, AJ, 87, 1165
- Butler et al., (1996) Butler, R. P., Marcy, G. W., Williams, E., McCarthy, C., Dosanjh, P., & Vogt, S. S. 1996, PASP, 108, 500
- Caccin et al., (2002) Caccin, B., Penza, V., & Gomez, M. T. 2002, A&A, 386, 286
- Catalano et al., (2002) Catalano, S., Biazzo, K., Frasca, A., & Marilli, E. 2002, A&A, 394, 1009
- Chabrier et al., (2004) Chabrier, G., Barman, T., Baraffe, I., Allard, F., & Hauschildt, P. H. 2004, ApJ, 603, L53
- Charbonneau et al., (2006) Charbonneau, D., et al. 2006, ApJ, 636, 445
- (24) Charbonneau, D., Brown, T. M., Burrows, A., & Laughlin, G. 2007a, in Protostars and Planets V, B. Reipurth, D. Jewitt, and K. Keil (eds.), University of Arizona Press (Tucson), 701
- (25) Charbonneau, D., Winn, J. N., Everett, M. E., Latham, D. W., Holman, M. J., Esquerdo, G. A., & O’Donovan, F. T. 2007b, ApJ, in press (astro-ph/0610589)
- Demarque et al., (2004) Demarque, P., Woo, J.-H., Kim, Y.-C., & Yi, S. K. 2004, ApJS, 155, 667
- Diaz et al., (2007) Diaz, R. F., et al. 2007, ApJ, accepted (astro-ph/0701345)
- Drimmel & Spergel, (2001) Drimmel, R., & Spergel, D. N. 2001, ApJ, 556, 181
- Duncan et al. (1991) Duncan, D. K., et al. 1991, ApJS, 76, 383
- Fuhrmann et al., (1993) Fuhrmann, K., Axer, M., & Gehren, T. 1993, A&A, 271, 451
- Gaudi et al., (2005) Gaudi, B. S., Seager, S., & Mallén-Ornelas, G. 2005, ApJ, 623, 472
- Gaudi, (2005) Gaudi, B. S. 2005, ApJ, 628, L73
- Gaudi, (2007) Gaudi, B. S. 2007, in Transiting Extrasolar Planets Workshop, C. Afonso, D. Weldrake, & T. Henning (eds.), ASP Conf. Ser. in press (astro-ph/0612141)
- Gillon et al., (2006) Gillon, M., Pont, F., Moutou, C., Bouchy, F., Courbin, F., Sohy, S., & Magain, P. 2006, A&A, 459, 249
- Gonzalez, (1998) Gonzalez, G. 1998, A&A, 334, 221
- Gonzalez and Vanture, (1998) Gonzalez, G., & Vanture, A. D. 1998, A&A, 339, L29
- Gonzalez, (2005) Gonzalez, G. 2005, MNRAS, 367, L37
- Gonzalez, (2006) Gonzalez, G. 2006, PASP, 118, 1494
- Gould et al., (2006) Gould, A., Dorsher, S., Gaudi, B. S., & Udalski, A. 2006, AcA, 56, 1
- Gray & Johanson, (1991) Gray, D. F., & Johanson, H. L. 1991, PASP, 103, 439
- Gray, (1994) Gray, D. F. 1994, PASP, 106, 1248
- Gray & Brown, (2001) Gray, D. F., & Brown, K. 2001, PASP, 113, 723
- Gray, (2005) Gray, D. F. 2005, The Observation and Analysis of Stellar Photospheres, 3rd Edition, Cambridge, UK: Cambridge University Press
- Guillot & Showman, (2002) Guillot, T., & Showman, A. P. 2002, A&A, 385, 156
- Guillot, (2005) Guillot, T. 2005, Annual Review of Earth and Planetary Sciences, 33, 493
- Guillot et al., (2006) Guillot, T., Santos, N. C., Pont, F., Iro, N., Melo, C., & Ribas, I. 2006, A&A, 453, L21
- Henry et al., (1996) Henry, T. J., Soderblom, D. R., Donahue, R. A., & Baliunas, S. L. 1996, AJ, 111, 439
- Holman et al., (2006) Holman, M. J., et al. 2006, ApJ, 652, 1715
- (49) Holman, M. J., et al. 2007a, ApJ, 655, 1103
- (50) Holman, M. J., et al. 2007b, ApJ, submitted
- (51) Ida S., & Lin D. N. C., 2004a, ApJ, 604, 388
- (52) Ida S., & Lin D. N. C., 2004b, ApJ, 616, 567
- Israelian et al., (2001) Israelian, G., Santos, N. C., Mayor, M., & Rebolo, R. 2001, Nature, 411, 163
- Israelian et al., (2003) Israelian, G., Santos, N. C., Mayor, M., & Rebolo, R. 2003, A&A, 405, 753
- Israelian et al., (2004) Israelian, G., Santos, N. C., Mayor, M., & Rebolo, R. 2004, A&A, 414, 601
- Knutson et al., (2007) Knutson, H. A., Charbonneau, D., Noyes, R. W., Brown, T. M., & Gilliland, R. L. 2007, ApJ, 655, 564
- Konacki et al., (2003) Konacki, M., Torres, G., Jha, S., & Sasselov, D. D. 2003, Nature, 421, 507
- Konacki et al., (2004) Konacki, M., et al. 2004, ApJ, 609, L37
- Konacki et al., (2005) Konacki, M., Torres, G., Sasselov, D. D., & Jha, S. 2005, ApJ, 624, 372
- Kornet et al., (2005) Kornet, K., Bodenheimer, P., Rózyczka, M., & Stepinski, T. F. 2005, A&A, 430, 1133
- Kovtyukh et al., (2003) Kovtyukh, V. V., Soubiran, C., Belik, S. I., & Gorlova, N. I. 2003, A&A, 411, 559
- Kurucz, (1993) Kurucz, R. L. 1993, ATLAS9 Stellar Atmosphere Programs and 2 km/s Grid CDROM, Vol. 13, Smithsonian Astrophysical Observatory
- Lammer et al., (2003) Lammer, H., Selsis, F., Ribas, I., Guinan, E. F., Bauer, S. J., & Weiss, W. W. 2003, ApJ, 598, L121
- Latham, (1992) Latham, D. W. 1992, in IAU Colloquium 135: Complementary Approaches to Double and Multiple Star Research, H.A. McAlister & W.I. Hartkopf eds, ASP Conf. Ser., 32, 110.
- Laughlin et al., (2005) Laughlin, G., et al. 2005, ApJ, 629, L121
- Lecavelier des Etangs et al., (2004) Lecavelier des Etangs, A., Vidal-Madjar, A., McConnell, J. C., & Hébrard, G. 2004, A&A, 418, L1
- Lecavelier des Etangs, (2006) Lecavelier Des Etangs, A. 2006, A&A, 461, 1185
- Levrard et al., (2007) Levrard, B., Correia, A. C. M., Chabrier, G., Baraffe, I., Selsis, F., & Laskar, J. 2007, A&A, 463, L5
- Mandel & Agol, (2002) Mandel, K., & Agol, E. 2002, ApJ, 580, L171
- Mayer et al., (2004) Mayer L., Quinn T., Wadsley J., & Stadel J., 2004, ApJ, 609, 1045
- Mazeh et al., (2005) Mazeh, T., Zucker, S., & Pont, F. 2005, MNRAS, 356, 995
- Melo et al., (2006) Melo, C., Santos, N. C., Pont, F., Guillot, T., Israelian, G., Mayor, M., Queloz, D., & Udry, S. 2006, A&A, 460, 251
- Minniti et al., (2007) Minniti, D., et al. 2007, ApJ, accepted (astro-ph/0701356)
- Moutou et al., (2004) Moutou, C., Pont, F., Bouchy, F., & Mayor, M. 2004, A&A, 424, L31
- Neuforge & Magain, (1997) Neuforge-Verheecke, C., & Magain, P. 1997, A&A, 328, 261
- Nordström et al., (2004) Nordström, B., et al. 2004, A&A, 418, 989
- O’Donovan et al., (2006) O’Donovan, F. T., et al. 2006, ApJ, 651, L61
- Pace & Pasquini, (2004) Pace, G., & Pasquini, L. 2004, A&A, 426, 1021
- Pont et al., (2004) Pont, F., Bouchy, F., Queloz, D., Santos, N. C., Melo, C., Mayor, M., & Udry, S. 2004, A&A, 426, L15
- Pont et al., (2007) Pont, F., et al. 2007, A&A, submitted (astro-ph/0610827)
- Ramírez & Meléndez, (2005) Ramírez, I., & Meléndez, J. 2005, ApJ, 626, 446
- Randich et al., (2006) Randich, S., Sestito, P., Primas, F., Pallavicini, R., & Pasquini, L. 2006, A&A, 450, 557
- Reddy et al., (2002) Reddy, B. E., Lambert, D. L., Laws, C., Gonzalez, G., & Covey, K. 2002, MNRAS, 335, 1005
- Santos et al., (2006) Santos, N. C., Ecuvillon, A., Israelian, G., Mayor, M., Melo, C., Queloz, D., Udry, S., Ribeiro, J. P., & Jorge, S. 2006, A&A, 458, 997
- Schlegel et al., (1998) Schlegel, D. J., Finkbeiner, D. P., & Davis, M. 1998, ApJ, 500, 525
- Seager & Mallén-Ornelas, (2003) Seager, S., & Mallén-Ornelas, G. 2003, ApJ, 585, 1038
- Sestito & Randich, (2005) Sestito, P., & Randich, S. 2005, A&A, 442, 615
- Sneden, (1973) Sneden, C. A. 1973, Ph.D. Thesis, The University of Texas at Austin
- Song et al., (2004) Song, I., Zuckerman, B., & Bessell, M. S. 2004, ApJ, 614, L125
- Southworth et al., (2004) Southworth, J., Zucker, S., Maxted, P. F. L., & Smalley, B. 2004, MNRAS, 355, 986
- Southworth et al., (2007) Southworth, J., Wheatley, P. J., & Sams, G. 2007, MNRAS, in press (arXiv:0704.1570)
- Sozzetti et al., (2004) Sozzetti, A., Yong, D., Torres, G., Charbonneau, D., Latham, D. W., Allende Prieto, C., Brown, T. M., Carney, B. W., & Laird, J. B. 2004, ApJ, 616, L167
- Sozzetti, (2005) Sozzetti, A. 2005, PASP, 117, 1021
- Sozzetti et al., (2006) Sozzetti, A., Yong, D., Carney, B. W., Laird, J. B., Latham, D. W., & Torres, G. 2006, AJ, 131, 2274
- Strassmeier & Schordan, (2000) Strassmeier, K. G., & Schordan, P. 2000, AN, 321, 277
- Vogt et al., (1994) Vogt, S. S., et al., 1994, in Instrumentation in Astronomy VIII, D. L. Crawford & E. R. Craine eds., Proc. SPIE, 2198, 362
- Winn & Holman, (2005) Winn, J. N., & Holman, M. J. 2005, ApJ, 628, L159
- (98) Winn, J. N., Holman, M. J., & Roussanova, A. 2007a, ApJ, in press (astro-ph/0611404)
- (99) Winn, J. N., et al. 2007b, AJ, accepted (astro-ph/0612224)
- (100) Winn, J. N., Holman, M. J., & Fuentes, C. I. 2007c, AJ, 133, 11
- Wright et al., (2004) Wright, J. T., Marcy, G. W., Butler, R. P., & Vogt, S. S. 2004, ApJS, 152, 261
- Yi et al. (2001) Yi, S. K., Demarque, P., Kim, Y.-C., Lee, Y.-W., Ree, C. H., Lejeune, T., & Barnes, S. 2001, ApJS, 136, 417
- Yong et al., (2004) Yong, D., Lambert, D. L., Allende Prieto, C., & Paulson, D. B. 2004, ApJ, 603, 697
- Zacharias et al., (2004) Zacharias, N., Urban, S. E., Zacharias, M. I., Wycoff, G. L., Hall, D. M., Monet, D. G., & Rafferty T. J. 2004, AJ, 127, 3043
| Parameter | Value |
|---|---|
| (K)aaDetermined spectroscopically. | 5850 50 |
| aaDetermined spectroscopically. | 4.4 0.1 |
| bbInferred from stellar evolution models using observational constraints (see text). | |
| (km s-1)aaDetermined spectroscopically. | 2 1 |
| (km s-1)aaDetermined spectroscopically. | 1.00 0.05 |
| Fe/HaaDetermined spectroscopically. | 0.15 0.10 |
| aaDetermined spectroscopically. | |
| aaDetermined spectroscopically. | 2.65 |
| (g cm-3)ccDerived observationally. | 1.375 0.065 |
| ()bbInferred from stellar evolution models using observational constraints (see text). | |
| ()bbInferred from stellar evolution models using observational constraints (see text). | |
| Age (Gyr)bbInferred from stellar evolution models using observational constraints (see text). | |
| (mag)bbInferred from stellar evolution models using observational constraints (see text). | |
| Distance (pc)bbInferred from stellar evolution models using observational constraints (see text). | |
| , , (km s-1)bbInferred from stellar evolution models using observational constraints (see text). | [1.81, +0.88, 5.51] |
Note. — The value adopted for the solar abundance of iron is

.