Intracluster supernovae in the Multi-Epoch Nearby Cluster Survey
Abstract
The Multi-Epoch Nearby Cluster Survey (MENeaCS) has discovered twenty-three cluster Type Ia supernovae (SNe) in the 58 X-ray selected galaxy clusters (0.050.15) surveyed. Four of our SN Ia events have no host galaxy on close inspection, and are likely intracluster SNe. Although one of the candidates, Abell399_3_14_0, appears to be associated in projection with the outskirts of a nearby red sequence galaxy, its velocity offset of km s-1 indicates that it is unbound and therefore an intracluster SN. Another of our candidates, Abell85_6_08_0, has a spectrum consistent with a SN 1991bg-like object, suggesting that at least some portion of intracluster stars belong to an old stellar population. Deep image stacks at the location of the candidate intracluster SNe put upper limits on the luminosities of faint hosts, with mag and mag in all cases. For such limits, the fraction of the cluster luminosity in faint dwarfs below our detection limit is , assuming a standard cluster luminosity function. All four events occurred within 600 kpc of the cluster center (projected), as defined by the position of the brightest cluster galaxy, and are more centrally concentrated than the cluster SN Ia population as a whole. After accounting for several observational biases that make intracluster SNe easier to discover and spectroscopically confirm, we calculate an intracluster stellar mass fraction of (68% confidence limit) for all objects within . If we assume that the intracluster stellar population is exclusively old, and the cluster galaxies themselves have a mix of stellar ages, we derive an upper limit on the intracluster stellar mass fraction of (84% one-sided confidence limit). When combined with the intragroup SNe results of McGee & Balogh, we confirm the declining intracluster stellar mass fraction as a function of halo mass reported by Gonzalez and collaborators.
1. Introduction
Galaxy clusters contain a population of stars gravitationally unbound to individual galaxies, yet still bound to the clusters’ overall gravitational potential, created by the stripping of stars from galaxies during interactions and mergers. Much work has been done to characterize the distribution, stellar mass and stellar population of the intracluster light (ICL) through a variety of observational tracers (e.g. Gal-Yam et al. 2003; Arnaboldi et al. 2004; Zibetti et al. 2005; Gonzalez et al. 2005; Krick & Bernstein 2007; Williams et al. 2007; Rudick et al. 2010, among others) because it is an important remnant of the hierarchical accretion history of clusters and the environmental processes which can transform cluster galaxies. Numerical work has sought to reproduce the observed results, to understand the processes that form the ICL, and how those processes in turn affect cluster galaxies and the cluster as a whole (e.g. Murante et al. 2004; Willman et al. 2004; Sommer-Larsen et al. 2005; Purcell et al. 2008; Puchwein et al. 2010; Dolag et al. 2010, among others).
One independent and complementary technique for probing the ICL are hostless, IC SNe. For instance, Sivanandam et al. (2009) have shown that, under reasonable assumptions, IC SNe can generate 30% of the iron observed in the IC medium out to , although this is subject to the still-large uncertainties in the SN Ia rate in galaxy clusters (especially in the relative rates of hostless and hosted SNe) and the evolution of the ICL with respect to the cluster as a whole. More relevant for the current work, the relative numbers of hostless and hosted SNe Ia have been used as a measure of the IC stellar mass fraction (e.g. Gal-Yam et al. 2003; McGee & Balogh 2010). Additionally, hostless SNe can serve as a tracer of the extent and distribution of the ICL – even the most diffuse and low surface brightness elements of the ICL can be revealed (albeit with relative rarity) if a SN explodes in its midst. As IC SNe observations become more common and better studied, the relative mix of core collapse SNe and SNe Ia can constrain the age of the underlying stellar population. Indeed, even the relative mix of the known sub-classes of SNe Ia – where SN 1991T-like events (and others with slow-declining light curves) are associated with young stellar populations (e.g. Hamuy et al. 1995), while SN 1991bg-like events (and those with fast-declining light curves) are associated with old ones (e.g. Howell 2001) – can serve as a tracer of the underlying stellar population.
Intracluster SN observations are still rare. A first possible IC SN Ia was discovered by Smith (1981), in an apparent stream connecting NGC 4406 and NGC 4374 in the Virgo cluster. Gal-Yam et al. (2003) found two IC SNe out of a total sample of seven in the WOOTS survey, a cluster SN search centered at (Sharon et al. 2007; Gal-Yam et al. 2008). More recently, McGee & Balogh (2010) mined the Sloan Digital Sky Survey (SDSS) SN Survey for SNe Ia associated with low redshift galaxy groups. Of their 59 group SNe Ia, 19 have no detectable host galaxy, and after making corrections for the group luminosity function and assuming a two-component SNe Ia rate (e.g. Mannucci et al. 2005; Scannapieco & Bildsten 2005) they found that % of the stellar mass in their groups was in the form of diffuse light. Additionally, Dilday et al. (2010a) discovered up to three hostless, IC SNe Ia in their study of the SNe Ia rate in galaxy clusters with the SDSS-II SN Survey. Several other possible IC SNe have been discovered over the years (e.g. Germany 1998; Reiss & Sabine 1998; Sand et al. 2008; Gal-Yam & Simon 2008; Sharon et al. 2010; Barbary et al. 2010). As outlined in the previous paragraph, hostless SNe are a unique probe of the diffuse universe. Much more can be done, and there is a need for systematic surveys for hostless SNe over the entire range of halo masses to study the spatial extent, stellar content and mass of diffuse light at all scales.
We have recently completed the Multi-Epoch Nearby Cluster Survey (MENeaCS), one of whose many goals is to measure the SN Ia rate in the most massive, X-ray selected galaxy clusters. In this paper, we report the discovery of four likely IC SN Ia which we have spectroscopically confirmed from among a sample of twenty-three in the MENeaCS survey. We use these to constrain the IC stellar population and stellar mass fraction in the MENeaCS cluster sample, along with the radial distribution of IC stars. The definition of ICL is necessarily ambiguous, given that galaxies have no well-defined ’edge’ (e.g. Abadi et al. 2006). We thus adopt the point of view of Rudick et al. (2010) and others: the ICL includes all low luminosity components of galaxy clusters, whether it is large scale diffuse luminosity, a tidal stream, or even the extreme outskirts of a cluster member. Where necessary, we adopt a flat cosmology with =70 km Mpc-1, =0.3, and =0.7.
2. Survey Description
While a full description of the MENeaCS survey, along with our cluster SNe rates, will be presented in a separate paper (Sand et al. in prep), we briefly describe the relevant aspects of the survey here. The principal time-domain goal of MENeaCS is to measure the cluster SN Ia rate at , including both hosted and hostless, IC events. We take advantage of CFHT’s queue scheduling to observe 30 clusters per queue run (with 2 120 s and images), and a total of 58 unique clusters throughout the year. These clusters were X-ray selected, and have . The monthly CFHT imaging is supplemented by follow-up imaging with the 2.3 m Bok telescope on Kitt Peak with its 90Prime imager (Williams et al. 2004). Viable cluster SNe Ia are identified based on brightness and color selection, and spectroscopically confirmed via monthly spectroscopy, primarily with the MMT. Target of Opportunity (ToO) observations with Gemini were acquired specifically to follow up our hostless SN candidates, which were pursued without any prior cut on brightness or color. The survey began in February 2008 and spectroscopic observations ended in December 2009. The last of the imaging data was taken in 2010A in order to get the image depth necessary for the other scientific aspects of the MENeaCS program.
During the course of the survey, we maintained deep-stacked images of all of our survey fields – consisting of all previous images at that position – for the purposes of faint host identification. For every SN candidate we attempt to identify a host galaxy using the method of the SN Legacy Survey (Sullivan et al. 2006), which uses a host-SN elliptical separation normalized by the candidate host galaxy size to assign hosts – the dimensionless parameter described in Eqn. 1 of Sullivan et al. (2006). Each host is characterized by an elliptical shape, as output by SExtractor, with semimajor and semiminor axes ( and ) along with a position angle, . We note here that Eqn. 1 of Sullivan et al. (2006) had a typographical error. The corrected version of the formula – where (,) is the SN pixel position and (,) is the host center – should read
| (1) |
where , , , , and .
Unfortunately, the original typographic error propagated into our survey code, although as we shall see from Figure 1, it did not ultimately effect our ability to distinguish between hosted and hostless SNe. Typically, the apparent detectable edge of a galaxy is at , although this is clearly a depth dependent statement. As in the SNLS, we initially classify a SN candidate as hostless if it has no potential hosts with . These candidate IC SNe are flagged and a visual search for a faint host is performed with our deep-stacked image, in case it was missed by our automated analysis. Very occasionally, the visual search revealed that a SN candidate with did seem to be associated with the outer halo of a galaxy (in retrospect, this was due to the typographical error mentioned above), and the SN was followed up during our classical spectropscopy observations. The individual discovery and band images are blinked and examined by a human to verify that the IC SN candidate is not a slowly moving object. If the candidate is still viable, we triggered our Gemini ToO program, or otherwise placed the hostless SN candidate into our ’high priority’ spectroscopic follow up list. Given our deep imaging (see § 3.3), our adopted definition of a hostless SN should be comparable to or stricter than recent IC SN work, such as McGee & Balogh (2010), who used twice the radius at which 90% of the light was enclosed (down to SDSS depths) as their working definition of a hostless SN. We also point out that, given the stacking of our images prior to SN discovery (with our shallowest stacks reaching mag; mag– see § 4.2), our host galaxy limits are stricter than that of McGee & Balogh (2010), which were at best mag, and similar to Gal-Yam et al. (2003).
In general, our classically scheduled spectroscopic follow up was focused on likely cluster SN Ia. If a SN candidate was newly discovered, its color and magnitude had to be consistent with a SN Ia within 30 days of explosion at the cluster redshift, which ranged between and (we have calibrated all survey imaging to the SDSS filter system; § 3.1) and had to have a clustercentric distance of (we have derived for each of the MENeaCS clusters using the X-ray scaling relations of Reiprich & Böhringer (2002), see § 4.3). Although every effort was made to spectroscopically confirm viable SNe Ia at higher clustercentric radius, this was not always possible. We also attempt to get spectroscopic confirmation of SNe even if they appear over 1 month old, based on our cadence, weather on previous spectroscopic runs, and the light curve of the SN candidate. Note that all viable cluster SN Ia candidates, as defined above, were observed modulo telescope scheduling and weather. Other SN candidates (i.e. those that were not consistent with expected cluster SN Ia’s colors or luminosity, but still with ) were followed up with lower priority, but this yielded 7 cluster core collapse SNe. These allow us to set a limit on the number of hostless to hosted core collapse SNe in the cluster environment for the first time (§ 4.3), a notion particularly relevant now that some star formation has been observed in the IC environment (Sun et al. 2007, 2010; Sivanandam et al. 2010; Smith et al. 2010), and has even been suggested by simulations (Puchwein et al. 2010).
MENeaCS has spectroscopically confirmed twenty-three cluster SN Ia (all within 3000 km s-1 of the cluster redshift), four of which have no host upon close inspection. We plot the SN-to-host distance for our cluster SN Ia sample in Figure Intracluster supernovae in the Multi-Epoch Nearby Cluster Survey, in terms of their effective radius, , after host assignment via the elliptical radius parameter as described above. The effective radius of each host galaxy is estimated via the flux_radius parameter in SExtractor (Bertin & Arnouts 1996) (this parameter was set so that it reported the radius at which 50% of the galaxy light was enclosed, the traditional definition of effective radius). The distances, in effective radii, of our four hostless cluster SNe Ia with respect to the nearest source in our SExtractor catalogs are shown as dashed lines (see § 3.3 for our limits on faint hosts associated with our IC SN candidates). Note that the SExtractor flux_radius parameter does not account for the point spread function (PSF) width, and so our values will be overestimates, with the corresponding host – SN distance becoming larger. This plot reinforces the distinct nature of our IC SN candidates.
3. Observations & Analysis
In this section, we will present the observations of our IC SNe along with our evidence for them not being related to a visible host. In all, we have identified three cluster SN Ia which are excellent candidates for having progenitors which are IC stars, along with an intriguing SN which may be associated with debris or other stripped material from a nearby cluster galaxy. We summarize the observations of each SN in Figures 2–5. The results of our spectroscopic analysis are summarized in Table 1, and our magnitude limits for faint hosts are in Table 2.
3.1. Discovery and follow up photometry
We have implemented a nearly real time analysis system for discovering and flux calibrating SN candidates in our CFHT imaging. This pipeline, as discussed in § 2, also attempts to assign a host to every discovered transient. If no host is found, and this is confirmed via visual inspection of the raw and processed data, the SN is moved to the top of our spectroscopic priority list, and our Gemini ToO was triggered, if available. Since our imaging consisted of not only our CFHT/Megacam data, but also 2.3 m Bok and occasional Gemini ToO acquisition images, we chose to calibrate our images to the Sloan Digital Sky Survey photometric system, which in general required both a zeropoint and color term.
3.2. Spectroscopic confirmation
We used our Gemini Observatory ToO program to confirm three of our candidate IC events using the Gemini-North Multi Object Spectrograph (Hook et al. 2004). Long-slit spectra were taken with the R400 grating centered at 680 nm, with the GG455 order blocking filter, covering 465-890 nm. The 10 slit was used and was oriented so that a relatively bright star was also placed in the slit, in case the SN was not visible in acquisition images. In the case of Abell_399_3_14_0 (note that we adopt our internal MENeaCS identification for our SNe, although we list IAU circular identifiers when available in Table 1), the slit was oriented so that a redshift for the nearby cluster red sequence galaxy could be obtained simultaneously. All SN spectra were reduced in a standard manner utilizing IRAF111IRAF is distributed by the National Optical Astronomy Observatory, which is operated by the Association of Universities for Research in Astronomy (AURA) under cooperative agreement with the National Science Foundation. routines, including the Gemini-specific IRAF package.
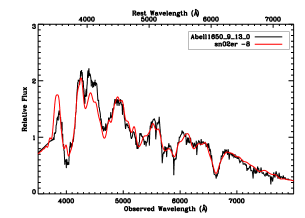
We have also used Hectospec on the MMT (Fabricant et al. 2005) in a queue mode to obtain a spectrum of Abell1650_9_13_0. Hectospec is a 300 fiber (15 diameter) spectrograph with a 1 square degree field of view. The 270 line grating was in place, giving wavelength coverage between 360-800 nm. The spectrum was pipeline processed at the Harvard-Smithsonian Center for Astrophysics.
The spectra of our IC SNe can be seen in Figures 2–5. We utilize the Supernova Identification (SNID) software package (Blondin & Tonry 2007) for classifying all of our spectra, which cross-correlates the input spectrum with a library of template SN spectra to both classify and determine the redshift of our SNe, based on the technique of Tonry & Davis (1979). We mimic the four step procedure of Foley et al. (2009) for determining a SN’s type, subtype, redshift and age using SNID. The reader is referred to that work for the details of the process, and can see our results for the MENeaCS IC SNe in Table 1. The best-matched SNID template spectrum is also listed in Table 1, and is overplotted in Figures 2–5 for comparison with the observed spectrum. In general, the match between template and spectrum is excellent, and we discuss the individual fits in § 3.4.
3.3. Deep stack images
With the survey complete, we have stacked all CFHT imaging epochs without SN contamination to search for faint hosts in the vicinity of our IC SNe. In general, this consisted of imaging taken prior to SN discovery only; close examination of images taken a year or more after SN discovery showed some residual SN light. Our final deep stack catalog for each field was made by median combining these SN-free images, using the SWarp222version 2.15.7; http://terapix.iap.fr/soft/swarp software package, and then running SExtractor on the resulting image. Since the goal was to identify the faintest possible hosts, we set the SExtractor keywords Detect_minarea to 5, Detect_thresh to 2, and Analysis_thresh to 2. No source was found within (see § 2) confirming our original trigger on these events as potential IC SNe. We visually inspected the IC SN positions as well, again finding no host.
To quantify the depth of these deep stack images, we implanted artificial stars (50000 per image, over several iterations) with a PSF matched to that of the original image. We note that dwarf galaxies in the Coma cluster have a typical size of 1 arcsecond (e.g. Komiyama et al. 2002). Given that our cluster sample is at higher redshift, and has a typical seeing of 0.8-1.0 arcseconds, our decision to quantify our sensitivity to faint hosts via a standard point source detection efficiency calculation is justified. The magnitude of the artificial stars was drawn randomly from 21 to 28 mag, with uniform probability. The color was then randomly assigned over the range , again with uniform probability. No artificial star was put within ten of any source in our original SExtractor catalog, as determined via the FLUX_RADIUS output parameter. Note that our statistics for sources 5 – more representative of our actual IC SN population as seen in Figure 1 – and 10 are identical (see § 4.1). After implantation, our detection efficiency as a function of magnitude was calculated by re-running SExtractor on the image. We adopt the magnitude at which we recover 50% of our artificial sources as our image depth, and we report this in Table 2, after translating into absolute magnitudes given the redshift of each cluster. We inspected several images to confirm that the 50% recovery threshold in our SExtractor catalog was visually correct. We calculate what fraction of the clusters’ luminosity is contained in dwarf galaxies below our detection limit, and the implications for that on the hostless nature of our IC SN candidates, in § 4.2.
3.4. Notes on individual objects
Here we present additional details for each of the IC SN candidates.
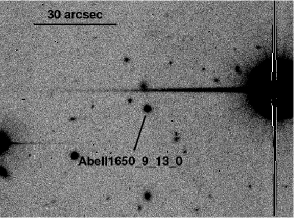
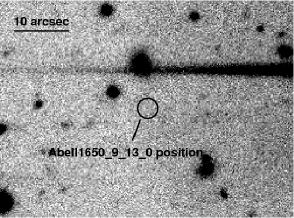
3.4.1 Abell1650_9_13_0
Abell1650_9_13_0 was discovered 2009 December 14 (UT dates are used throughout this paper) with mag and mag, making it a prime target for spectroscopic follow up. A spectrum was taken with MMT/Hectospec on 2009 December 21, which indicates a normal SN Ia near maximum light (Figure 1).
The SN position is 470 kpc East of Abell 1650’s BCG. Deep stack images of Abell 1650 with no SN contamination indicate a depth of mag and mag at the cluster redshift (). The SN is 10 effective radii from the nearest object in our deep Abell 1650 catalog.
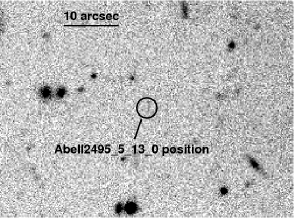
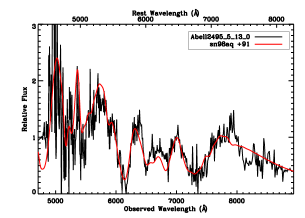
3.4.2 Abell2495_5_13_0
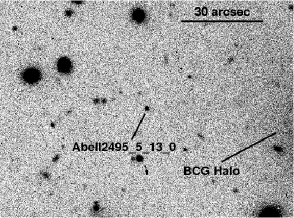
Abell2495_5_13_0 was discovered on 2009 May 23 with mag and mag, fainter than we typically followed up SNe in MENeaCS, but due to its lack of an apparent host and the fact that Abell 2495 had not been observed since October 2008, we triggered our Gemini ToO program. Further imaging on June 17 showed that the SN was in decline, just prior to our spectroscopic observations on June 18. The SN spectrum indicates that Abell2495_5_13_0 is a normal SN Ia roughly three months past maximum light (Figure 2).
The SN position is 150 kpc from the BCG in Abell 2495, and is the most centrally located in our sample (Figure 2). The deep stack images indicate that there is no host galaxy at the location of Abell2495_5_13_0 to a magnitude of mag and mag at the distance to Abell 2495 (). The nearest object in our Abell2495 deep catalog implies that the SN was over 20 effective radii away.
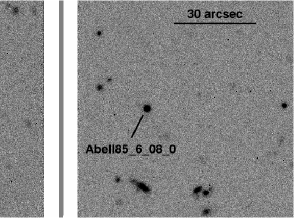
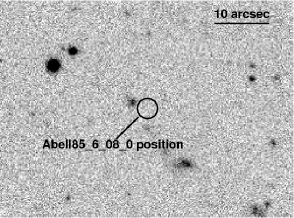
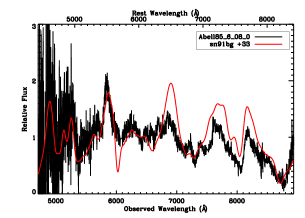
3.4.3 Abell85_6_08_0
Abell85_6_08_0 was discovered on June 18, 2009 with and . Subsequent photometry was obtained with both the CFHT and the Steward 2.3 m, indicating a SN well past maximum light.
The Gemini/GMOS SN spectrum is shown in Figure 3. The best matched SNID template for Abell85_6_08_0 is SN 1991bg, roughly five weeks past maximum, and the top six SNID matches to the spectrum are also of the SN 1991bg subtype. We are confident that Abell85_6_08_0 is an underluminous SN Ia based on OI and Ca II in absorption – which is typical for underluminous SN Ia roughly 4-5 weeks past maximum (e.g. Taubenberger et al. 2008). We do not see the narrow Na I D line near 5700 Å, typical of underluminous SN Ia. The SN type is supported by the declining light curve at the time the spectrum was taken, although no data is available near maximum light. If an underluminous SN Ia, Abell85_6_08_0 is likely associated with an old stellar population (e.g. Howell 2001), which we briefly discuss in § 4.3.
Abell85_6_08_0 is 600 kpc southeast of Abell 85’s BCG. No host is detected down to mag and mag in our deep stack catalogs at the cluster redshift (). The SN is 5 effective radii from the nearest object in our deep Abell 85 catalog.
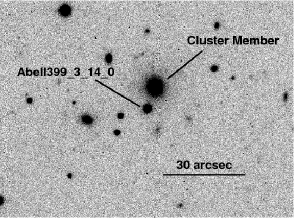
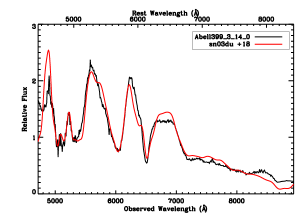
3.4.4 Abell399_3_14_0
Abell399_3_14_0 was discovered November 6, 2008 (preimaging with the 2.3 m Bok telscope on October 25, 2008 also caught the SN on the rise). As can be seen in the left panel of Figure 4, the SN was relatively near a cluster red sequence member, which we will refer to as Galaxy 1. Nonetheless, our deep stack image at the time indicated that the SN was 7 from the potential host’s center, and so we triggered our Gemini ToO observations. Further analysis of the field indicates that the SN did occur from the galaxy center based on SExtractor’s phot_fluxfrac parameter.
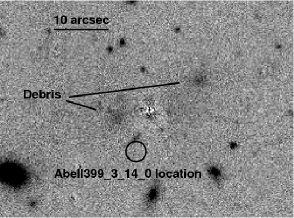
To investigate further, we used GALFIT (Peng et al. 2002) to fit parameterized models to Galaxy 1. Several simple models with either a single de Vaucouleurs or Sersic profile, along with a central point source, were fit to Galaxy 1, all suggesting that the SN was effective radii from the galaxy center. However, these models had significant residuals, suggesting that an additional component was necessary to fit the data. After some investigation, the best model consists of two Sersic components, along with a point source at the galaxy’s center. The larger Sersic component has an effective radius of 2.2 arcseconds (3.3 kpc), suggesting that Abell399_3_14_0 was only 3.8 effective radii from the galaxy center, at least with respect to this largest scale component. Given the Sersic index of this component, , 17% of the light lies at larger radii than the SN radius. In Figure 4, middle panel, we show the two-component Sersic model of Galaxy 1 subtracted from the image. Note that there are low surface brightness features projected at large radii around Galaxy 1, possibly a plume or tidal debris, suggesting that it has recently interacted with another galaxy. Signs of disturbance and tidal features are common in both field ellipticals (van Dokkum 2005; Tal et al. 2009), and their cluster counterparts (Janowiecki et al. 2010).
To corroborate our GALFIT results, we implemented a non-parametric approach to measuring the light profile of Galaxy 1. The data around Galaxy 1 were binned into 1 pixel-wide annuli, with deviant pixels flagged and removed through an iterative procedure. A sky annulus was taken, 20-pixels wide, and this sky value was subtracted from Galaxy 1’s light profile. This allowed for a direct measurement of the fraction of light enclosed as a function of radius, with 10% of Galaxy 1’s light at radii larger than that of the SN. This rough agreement between the GALFIT and non-parametric analyses indicate that Abell399_3_14_0 lies in the outskirts of Galaxy 1 in projection.
Given the association of Abell399_3_14_0 with Galaxy 1’s outer halo, and the appearance that Galaxy 1 has recently had a significant interaction, it is interesting to look at the relative velocities of Galaxy 1 (which was placed in the Gemini slit) and the SN. Precision redshifts of SNe are difficult to measure due to their broad, evolving spectral features. That said, taking the median redshift of the good correlations found by SNID – based on 20 normal SN Ia templates – gives a redshift of (where the uncertainty is the standard deviation of the good correlation redshifts).
SNID also has several galaxy templates that it can use to quantify galaxy redshifts, but since it smooths the data, we choose instead to use the IRAF task RVSAO (Kurtz & Mink 1998), which is based on the cross-correlation algorithm of Tonry & Davis (1979), to precisely measure the redshift of Galaxy 1 (note that SNID gives consistent results with what follows, albeit with higher error bars). Several templates were used, based on absorption line spectra of nearby galaxies along with a template made with K-giant spectra in M31 globular clusters. All of these templates give nearly identical results, to within . Taking the template which gave the best r-statistic value (Tonry & Davis 1979), we measure a redshift of for Galaxy 1.
While the velocity difference between Abell399_3_14_0 and Galaxy 1 are formally more than 3- apart, it is also insightful to plot the velocity difference between Galaxy 1 and each of the good SN template matches which SNID found, which we do in Figure Intracluster supernovae in the Multi-Epoch Nearby Cluster Survey. Note that all of the good SN template matches indicate a velocity difference 500 km s-1. This velocity difference suggests that Abell399_3_14_0 is unbound to Galaxy 1. Assuming that Galaxy 1’s half light radius is between 1 kpc (our GALFIT result based on a single profile fit) and 2 kpc (based on our nonparametric analysis of the light profile), then we would expect Galaxy 1 to have a velocity dispersion 100-200 km s-1 (e.g. van der Wel et al. 2008). Using this, and the projected mass profile scaling relation of Bolton et al. (2008) based on strong gravitational lensing (which we deproject assuming spherical symmetry), we find that Galaxy 1 would have an escape velocity of 280-480 km/s at the radius of Abell399_3_14_0, presuming this is the true radius of the event. We grant that this is merely an estimate and that the application of the scaling relation of Bolton et al. (2008) requires extrapolation, but it is indicative that Abell399_3_14_0 is at best loosely bound to Galaxy 1.
We note that the redshift of Abell399_3_14_0 derived via SNID puts the SN just within our 3000 km s-1 velocity cutoff for designating cluster SNe. To investigate if this velocity offset is reasonable, we searched the NASA Extragalactic Database (NED) for redshifts in the literature associated with Abell 399. A standard biweight estimator yields a cluster velocity dispersion of km s-1 from 123 cluster redshifts (calculated as in Just et al. 2010), putting Abell399_3_14_0 in the ’outskirts’ of the cluster in velocity space – but still within 2-3 given the SN’s redshift uncertainty. With twenty-three cluster SN Ia in our sample, it is not unreasonable to have a SN with such a velocity offset from the cluster.
The status of Abell399_3_14_0 leans toward it being an IC SN. In projection, the SN lies in the outer regions of Galaxy 1, with 10-20% of the galaxy’s light at larger radii than the SN. On the other hand, Galaxy 1 appears to have associated tidal debris and the velocity offset between Galaxy 1 and the SN is larger than a simple estimate of the escape velocity at the projected radius. Indeed, finding a true IC SNe projected onto a galaxy is expected for samples roughly the size of MENeaCS (see § 4.1). The bulk of the evidence leads us to consider Abell399_3_14_0 an IC object based on these last facts. However, if one wants to adopt the stricter definition that IC stars are only those which are in the population gravitationally dominated by the cluster rather than a local galaxy, than Abell399_3_14_0 could be a transitional object. If we consider the progenitor of Abell399_3_14_0 to be part of a ’transition’ stellar population becoming unbound (or remaining loosely bound) from its galaxy of birth, it does not appear to be alone in the literature. Smith (1981) reported the discovery of SN 1980I, a SNIa, to be projected onto a stellar bridge between NGC4374 and NGC4406 in the Virgo cluster, suggesting a second ’transition’ population object. As we calculate the IC stellar mass fraction in § 4.4, we will present our results both with and without Abell399_3_14_0 as an IC SN.
4. Discussion & Results
In this section we will calculate the IC stellar mass fraction in our sample of clusters based on the relative numbers of IC and hosted SNe (§ 4.4) and discuss the relative spatial distribution of these objects (§ 4.5). First, though, we quantify several observational biases which cause a preference for the discovery and follow up of IC SNe in MENeaCS (§ 4.1). Following this, we show that it is unlikely that our IC SNe population are coming from dwarf galaxies in the cluster, below our host detection limit, based on the depth of our deep stack imaging fields and standard cluster galaxy luminosity functions (§ 4.2). We discuss the IC stellar population, with respect to the cluster galaxy population as a whole in § 4.3 with special emphasis on what our SN sample contributes.
4.1. Hostless supernova detection bias
There are two potential biases in using the relative numbers of hostless and hosted cluster SNe to derive the IC stellar mass fraction in our sample, which we attempt to quantify here. These assessments will be used in § 4.4 for properly calculating our IC stellar mass fraction based on the relative numbers of hostless and hosted cluster SN Ia, and we summarize them in Table 3.
First, it is simply more difficult to discover SNe within hosted galaxies than it is in a seemingly blank portion of the sky. This would serve to boost the true number of hosted SNe relative to unhosted SNe. To address this, we have carried out a series of detection efficiency simulations by adding fake SN Ia into our MENeaCS images with realistic absolute magnitude and stretch distributions using the template light curves of Nugent et al. (2002). One set of these fake SN Ia was implanted with a distribution following the galaxy light in the image (out to a maximum effective radius of 5), while the other was purposely placed at away from any potential galaxy host in order to mimic a hostless population (note that while this does not correspond to our declared limit of for our IC SNe, the statistics between implanted objects at and are identical). The images, with their fake SN Ia implanted, were then run through our detection pipeline and the statistics of the recovered SNe were tallied. Details of this process will be presented when we calculate the cluster SN Ia rate (Sand et al. in preparation), but we use the relative detection efficiency between hosted and hostless SNe here to quantify how much easier it was to discover hostless cluster SN Ia in the MENeaCS survey. The hosted to hostless SN detection efficiency is 0.91 when integrated over all magnitudes and host-centric radii, and so a factor of 1.0/0.91 will be applied to any value of the number of hosted cluster SN Ia, , in relation to the number of IC SN Ia, .
Second, there is a spectroscopic bias which always biases the number of hosted SN Ia to lower values. Throughout the course of the MENeaCS campaign, we made every effort possible to follow up all transients that appeared to be hostless, as long as this was reasonable to do within our Gemini ToO program or our classically scheduled spectroscopic time. Given our limited, classical spectroscopic resources (which were effected by scheduling and weather) we only followed up viable cluster SN Ia candidates with during that time. We split our spectroscopic bias into two categories, and address each in turn. First, there is what we call ’spectroscopic availability bias’ – during the period in which our Gemini ToO program was active we were always able to spectroscopically confirm hostless SN candidates, even if we had no classical spectroscopic time due to scheduling, weather or instrument problems. Since we were able to get a spectrum of all of our viable cluster SN Ia candidates as long as there were no losses due to scheduling, weather, or technical problems, this bias is easy to quantify. It should simply be the ratio of time when both classical spectroscopic time and Gemini ToO for hostless candidates was available over the total amount of time that spectroscopic follow up was available for hostless SN candidates – we calculate this to be 0.91. This means that another factor of 1.0/0.91 will be applied to any value of when we calculate our IC stellar mass fraction. As a sanity check, another way of quantifying the spectroscopic availability bias is to directly investigate our transient database for good cluster SN Ia candidates (as described in § 2) that were not followed up due to poor weather or scheduling; three such objects were found. Based on the 0.91 fraction of classical spectroscopic coverage found above, we would expect one or two such objects – perfectly consistent, especially given that good SN candidates occasionally turned out to be background/foreground SNe or even core collapse SNe.
The second type of spectroscopic bias is a ’hostless follow up’ bias – we were willing to spectroscopically confirm fainter, apparently hostless, SN candidates with Gemini but would avoid pursuing similar hosted candidates with our classical spectroscopic time. The simplest way of addressing this hostless follow up bias is to strike Abell2495_5_13_0 from our calculations of the IC stellar mass fraction (§ 4.4). With a discovery magnitude of , , and declining light curve, such a cluster SN Ia caught so long after maximum would not have been spectroscopically followed up and confirmed if not for our Gemini ToO time. All other IC SNe would have been high priority targets in our classical spectroscopy queue due to their magnitude and color.
There is another bias, not considered in previous work, due to true IC SNe being projected onto a false host galaxy, whether it be a foreground/background galaxy or a cluster member. To gauge the potential magnitude of this ’filling factor’ effect we calculated the fractional image area enclosed within the dimensionless elliptical radius (see § 2) of any potential host in a representative sample of clusters, finding that on average 10 to 15% of the image area is covered by a potential ’host galaxy’. Additionally, when going from the cluster outskirts to the inner regions of the cluster we find that the filled area increases by %. Of course, this filling factor estimation method assumes that IC SNe are randomly distributed in the cluster, when in reality they could be more strongly associated with galaxies if they have been recently stripped; we do not quantify this plausible scenario further. Our best estimate suggests that 1 of our apparently hosted SN may be an actual IC SN projected onto a galaxy’s position. One way to mitigate this effect is to carefully compare SN and potential host redshifts (although this is limited due to the broad, evolving features in SN spectra), which we have done for the entire hosted SN set in the MENeaCS sample, of which 30% have a measured host redshift (Sand et al. in prep). Besides Abell399_3_14_0 and its large velocity offset with its possible host galaxy (§ 3.4.4), which we consider the first object in this class, we have found no SN with significant velocity offsets from their putative host. Given the case of Abell399_3_14_0, we apply no additional correction factor since the expected size of the effect is comparable in size to that observed. We gauge its impact by presenting our results both with and without it in the IC sample. Future work, in the era of large time domain surveys, will likely turn up more such objects.
To summarize, we will apply three correction factors, based on observational biases, to our IC stellar mass fraction analysis in § 4.4, which we show in Table 3. First, we strike Abell2495_5_13_0 from our IC stellar mass fraction calculations for being too faint in comparison to our hosted SN Ia. We then apply two separate factors of 1.0/0.91 whenever a term is necessary: once for the relative difficulty of detecting hosted SNe in comparison to hostless events, and once for the relative spectroscopic availability of our IC SNe target of opportunity observations and our classically scheduled spectroscopic time for which we followed up our hosted SNe.
4.2. Host limits and the cluster luminosity function
Given our host detection limits and a cluster galaxy luminosity function, one can determine the fraction of the cluster’s luminosity contained in dwarfs fainter than our observational limits. From this, the probability of having the number of apparently hostless SNe in the MENeaCS survey can be assessed, assuming that the SN Ia rate is roughly proportional to luminosity.
As a starting point, we choose the luminosity function and normalization of the Virgo Cluster measured by Trentham & Tully (2002), which has a faint-end slope of 1.03, and was measured down to mag. By integrating their luminosity function up to our detection limit for faint hosts, and normalizing it by the total luminosity, the fraction of cluster luminosity missed is calculated (not including the contribution from IC stars), and we report this value for each IC field in Table 2. Note that in converting our reported magnitudes in Table 2 to the luminosity function used by Trentham & Tully (2002), we made use of the filter conversion relations of Blanton & Roweis (2007) and the typical colors of dwarf galaxies in SDSS reported by Eisenstein et al. (2001).
A variety of cluster luminosity function faint end slopes have been measured in the literature – for a recent compilation for the Coma Cluster, see Milne et al. (2007). The results of the last ten years indicate that the Coma Cluster has a faint end slope between . We use a value of 1.5 to give a realistic upper limit on the fraction of the cluster luminosity in faint galaxies below our deep stack detection limits, again using the normalization terms of Trentham & Tully (2002). We list these values in Table 2.
Assuming that the SN rate is proportional to luminosity, it is unlikely that any of our IC SN candidates are actually hosted by faint dwarfs below our detection limits. If the typical faint end slope were , as measured for Virgo by Trentham & Tully (2002), the typical amount of galaxy light below our detection threshold is 0.04%-0.12% of the total, suggesting that we would expect SNe below our detection limit. Even given our upper limit scenario, with a faint end slope of and our shallowest detection limit implies that we would expect SNe Ia hosted by galaxies below our detection threshold. A faint end slope of is necessary for it to be plausible that all of our IC SN candidates were hosted by dwarf galaxies below our detection limit.
We note that at some level all of these extrapolations are unphysical, and should only be taken as indicative. As is well known, a Schechter function with a faint end slope steeper than has a diverging number of dwarf galaxies, while faint end slopes steeper than diverge in luminosity. The faint end luminosity function in clusters must truncate at the faintest luminosities, strengthening our conclusion that our designated SNe are truly IC events.
Of course, these strong constraints on faint dwarf galaxy hosts implicitly assume that the SN Ia rate is proportional to stellar luminosity at the faintest luminosities. Recent results from the Lick Observatory Supernova Search (LOSS), however, suggest that there is a strong dependence on the SN Ia rate and the ’size’ (and by extension, luminosity) of a galaxy (Li et al. 2010). This rate-size relation indicates that smaller galaxies have a higher SN rate per unit luminosity than larger galaxies. The physical mechanism for this effect is unknown, although it may be due to a higher specific star formation rate among smaller galaxies (Li et al. 2010). If true, then the rate-size relation is not likely to hold in the cluster environment, since dwarf galaxies in cluster cores have had their star formation shut off by environmental processes (e.g. Penny et al. 2010). We also note that the targeted search strategy of LOSS did not include galaxies as faint as mag, as we are discussing here. Additionally, due to their extreme stellar densities and low metallicities, globular clusters may have an enhanced SN Ia rate per unit mass, perhaps as high as a factor of 10 (Shara & Hurley 2002; Ivanova et al. 2006; Rosswog et al. 2008; Pfahl et al. 2009) – intracluster globular clusters have been observed in the Virgo Cluster (e.g. Lee et al. 2010). Any effect of the rate-size relation on dwarf galaxies below our detection limit would push our true IC stellar mass fraction to lower values, as would any enhancement of the SN Ia rate in globular clusters. These possibilities make the case for even deeper high-resolution imaging in the vicinity of our IC SN candidates very exciting.
4.3. What is the make-up of the intracluster stellar population?
A basic question when trying to use IC SNe (or for that matter, any tracer of IC stars) as a measure of the IC stellar mass fraction is the respective stellar populations of the cluster galaxies and the IC stars. Much recent work has pointed out that the SN Ia rate of a stellar population may have two components; one proportional to the stellar mass, and the other to the star formation rate (e.g. Mannucci et al. 2005; Scannapieco & Bildsten 2005). Alternatively, there may be a continuum of delay times between the birth of a stellar population and when SN Ia explosions occur (e.g. Pritchet et al. 2008; Maoz et al. 2010). If, for instance, the IC stellar population was composed of solely old stars, while the cluster galaxy population had a mix, including continuing small levels of star formation, then the simple fraction of IC SNe out of the total would not be a good measure of the IC stellar mass fraction. Both the observational and numerical picture of the IC stellar population are varied and difficult to interpret, and we attempt to summarize the current state of knowledge here.
Observationally, the most direct view of the ICL population has been in Virgo via Hubble Space Telescope imaging of its red giant branch population (Williams et al. 2007). Using color magnitude diagram matching techniques, Williams et al. (2007) concluded that the ICL population in Virgo (at least in the field studied) is mostly old (10 Gyr) with a wide range in metallicity () but also has a young, relatively more metal-rich component (10 Gyr; [Fe/H]) as well. As a caveat, Virgo has a mass of 1.7 (Rines & Diaferio 2006), and is dynamically unrelaxed (e.g. Binggeli et al. 1985), and so may not have ICL properties analogous to the MENeaCS cluster sample, which has a median cluster mass 3.8 times higher (using the X-ray scaling relation for the flux-limited sample of Reiprich & Böhringer 2002, and their bisector regression results). There is also observational evidence for current star formation in IC space; the cold interstellar medium, removed from its galaxy due to ram-pressure stripping, can form stars (Sun et al. 2007, 2010; Sivanandam et al. 2010; Smith et al. 2010). Broad band color imaging of the ICL, on the whole, indicates that the ICL and the cluster galaxies have similar stellar populations, with some studies finding colors that are more similar to cluster galaxy outskirts, while others finding colors as red as the interiors of early type galaxies; given the large uncertainties, these color measurements are broadly consistent with the cluster galaxy population (e.g. Gonzalez et al. 2000; Zibetti et al. 2005; Krick et al. 2006; Krick & Bernstein 2007; Da Rocha et al. 2008; Rudick et al. 2010, among others).
Simulations have shown a similar range in results. For instance, simulations of ICL build up by Willman et al. (2004) and Murante et al. (2004) have suggested that IC stars are more metal poor and older than the general cluster galaxy population on average, respectfully. Other simulations indicate that IC stars have very similar properties to those in cluster early type galaxies (Sommer-Larsen et al. 2005). Intriguingly, and in line with some recent observations (Sun et al. 2010; Smith et al. 2010), Puchwein et al. (2010) suggest that there may be some ’intracluster star formation’ coming from gas stripped from small infalling halos. All of the simulation results suffer from some overcooling, including those with AGN feedback (e.g. Puchwein et al. 2010), and can not reproduce the observed fraction of stars in cluster galaxies. Thus simulation results should be taken as only indicative.
A crude hint of the make-up of the ICL population can be gleaned from the MENeaCS SN sample. One of our IC SNe, Abell85_6_08_0, has been identified as a SN1991bg-like event, while none of our hosted SN Ia can be placed in this class (although our sparse light curve sampling and single spectrum per SN may preclude precise classification). Li et al. (2010) report that 18% of all SNe Ia are of the SN1991bg-like variety in a volume-limited survey, most appropriate for our cluster SN search. They prefer early type hosts (Howell 2001), and thus presumably are associated with an old stellar population (although they may have a distribution of delay times). Note that we can not distinguish between scenarios in which the stellar population was stripped while still young – evolving passively in IC space since – or if the stellar population was stripped more recently with the old stars developing in a galaxy evironment. Given the small SN numbers involved, the most robust conclusion is that there is an old stellar population component to the IC light. Future large time domain surveys may be able to indirectly probe the stellar population of the ICL via the mix of their SNe population.
As an aside, it should be mentioned that no IC core collapse SNe were discovered in MENeaCS, while seven such hosted events were. While the focus of MENeaCS was on SNe Ia, we agressively followed up all of our IC SN candidates. In this situation, where hosted candidate core collapse events were given lower spectroscopic priority but not their hostless counterparts, we can place an upper limit of (95% confidence upper limit) on the fraction of IC core collapse SNe. This number was derived using binomial statistics (Gehrels 1986), whose applicability is briefly discussed in § 4.4. If the core collapse SN rate is proportional to the current star formation rate (which it should be if core collapse SN progenitors are from massive, short lived stars – for a review see Gal-Yam et al. 2007), then this fraction represents the relative star formation rate in the IC population to that hosted by the cluster galaxies. While this constraint is not stringent, we again emphasize that future work associated with the large time domain surveys will be able to use IC SNe to probe the stellar population of the ICL.
4.4. The intracluster stellar mass fraction
The simplest assumption we can make is that the IC stellar population is similar to that of the cluster galaxies. Our presentation of the IC stellar mass fraction in our sample will then focus on the fraction of IC SNe to the total (corrected, of course, for the biases discussed in § 4.1) as the proper tracer. Nonetheless, we will also present a conservative upper limit in case the IC stellar population is more similar to that of the older, early type cluster galaxies (e.g. Willman et al. 2004; Murante et al. 2004), by utilizing those cluster SN Ia hosted by red sequence galaxies (see below). As we describe below, binomial statistics are used to derive confidence limits, given that intracluster and hosted SNe are each distinguishable, random events. We implicitly assume that the SN Ia rate is proportional to luminosity, and any deviation from this among globular clusters and dwarf galaxies below our faint host detection limit will push our intracluster stellar mass fraction to lower values, as discussed in § 4.2.
In § 4.1, we quantified our known sources of bias associated with discovery and confirmation of IC versus hosted cluster SN Ia (summarized in Table 3). Accordingly, two factors of must be applied whenever the number of hosted cluster SN Ia is compared with the number of IC SNe, and Abell2495_5_13_0 should be struck from the sample since it would not have been followed up during our normal, classically scheduled spectroscopic time. This leaves three IC SNe out of a total sample of twenty-two, keeping in mind that we will present results with Abell399_3_14_0 both in and out of the IC sample. If we wish to include only those cluster SNe within (which we prefer, given that we begin becoming spectroscopically incomplete at ), where we have derived for each of the MENeaCS clusters again using the X-ray scaling relations of Reiprich & Böhringer (2002), then the total sample shrinks to sixteen. We note that all but six of the MENeaCS clusters have been searched for SNe out to , given the CFHT/Megacam field of view. Even for these clusters, we were able to cover out to , and we thus apply no additional correction factors to our SN numbers.
If the IC stellar population is exclusively old, we need a comparable SN number among the hosted population in order to constrain the IC stellar mass fraction. To assess how many of our hosted cluster SN Ia were associated with old stellar regions, we have constructed red sequence catalogs for each of our clusters (Bildfell et al. in prep), with a typical scatter in the color magnitude relation of 0.03 magnitudes. Seven (eight if one includes Abell399_3_14_0 among the hosted SNe) of the cluster SN Ia hosts are consistent with the red sequence of their cluster (five are within ; six if you include Abell399_3_14_0). We will take our red sequence galaxies to represent an exclusively old stellar population, but acknowledge that cluster red sequence galaxies may have an elevated SN Ia rate compared to those in the field (Sharon et al. 2007; Mannucci et al. 2008; Dilday et al. 2010a), perhaps due to residual star formation or a subtle metallicity effect. We will address this issue with MENeaCS data in future work, although all of the appropriate studies suffer from small number statistics. As Rudnick et al. (2009) measured 75% of the clusters’ total light originating in red sequence members in their sample of SDSS clusters at , and younger galaxies will have a higher mass to light ratio, we conservatively assume that 75% of our clusters’ stellar mass is in red sequence members in order to make a correction to represent the clusters’ old stellar population as a whole. We apply this additional correction factor, which has the form whenever the number of SN Ia hosted by cluster red sequence galaxies is used to calculate our limits on the IC stellar mass fraction. This correction factor likely biases the IC stellar mass fraction high when calculating a conservative upper limit for that quantity.
We list our IC stellar mass fraction, given our various scenarios, in Table 4. To be explicit, the IC stellar mass fraction, , is found using
| (2) |
where is the number of IC SN Ia and is the number of hosted SN Ia. The quantity is the total observational bias factor determined in § 4.1, and is throughout this work. Finally, is an additional correction factor representing the fraction of the parent stellar population that the hosted SN sample is probing. The value of is unity when we consider the IC stellar population and that of the cluster galaxies to be identical, and when we are calculating the IC stellar mass fraction assuming that the IC stellar population is exclusively old, and use the number of SN Ia hosted by red sequence galaxies to represent the hosted old stellar population in the clusters – see the previous paragraph for details. All of our confidence limits were derived based on binomial statistics, since we are measuring two different kinds of distinguishable, random events (i.e. intracluster and hosted SNe). In particular, we use the expressions of Gehrels (1986) for finding confidence limits on the IC stellar mass fraction, . We present all of our IC stellar mass fraction numbers as 68% confidence limits, while the red sequence derived IC stellar mass fractions are 84% one-sided confidence limits.
Focusing on our results within , we find an ICL stellar mass fraction of ( if you do not include Abell399_3_14_0 as an IC SNe). If we use our conservative measure of the ICL stellar mass fraction (counting only our SNe Ia hosted by red sequence galaxies and including Abell399_3_14_0 among our IC SNe), we derive an upper limit on the IC stellar mass fraction of , which we consider the absolute upper range that our results allow.
This IC stellar mass fraction is consistent with the bulk of the results in the literature, which generally find 10-30% at the cluster scale (e.g. Gal-Yam et al. 2003; Gonzalez et al. 2005; Zibetti et al. 2005; Krick & Bernstein 2007). Gonzalez et al. (2007) measured an ICL fraction versus cluster velocity dispersion relation for a sample of 23 groups and clusters. We apply this scaling relation to our own sample to determine our expected ICL fraction, correcting the Gonzalez et al. numbers for the available field of view (using Figure 5 in Gonzalez et al. 2007), and the velocity dispersion of the clusters in our sample (converting from the X-ray luminosity using the relation of Wu et al. (1999)). Additionally, we apply a rough correction factor of 0.8 to account for the fact that the Gonzalez et al. (2007) ICL scaling relation actually includes the BCG luminosity, roughly 20% of the total BCG+ICL luminosity budget (see Gonzalez et al. 2005, Figure 7). We find an expected ICL fraction of 0.19, which is consistent with our current, SN-based measurement.
This can be seen more clearly in Figure Intracluster supernovae in the Multi-Epoch Nearby Cluster Survey, where we compare our SN IC results with those at the group scale (McGee & Balogh 2010) and the direct surface brightness measurements of Gonzalez et al. (2007). Two simple correction factors were made to the original Gonzalez et al. (2007) numbers for the purposes of this plot. First, a factor of 0.8 was applied to account for the fact that the Gonzalez et al. numbers were presented as a BCG + ICL fraction, rather than the ICL alone; the factor of 0.8 is the rough fraction that Gonzalez et al. found themselves as the typical fraction of the BCG + ICL belonging to the ICL alone. Second, we renormalize their ICL numbers so that they reflect the fraction within , rather than the listed value (using Figure 5 of Gonzalez et al. 2007). We present two numbers for the McGee et al. intragroup SNe results. The lower, dashed box represents the raw McGee et al. measurement of 19 intragroup SNe out of a total sample of 59. The upper, dotted box is the final intragroup stellar mass fraction they reported after assuming that the IC stars are universally old, the hosted group stars contained a mix of stellar ages, and then applying a correction factor to their raw SN numbers using the two-component SN Ia rate measurement of Dilday et al. (2010b). Note that this should be analogous to our own estimation of the upper limit of the IC stellar mass fraction, assuming that the IC stars are universally old. The velocity dispersion range of the McGee et al. group sample was derived by taking their quoted mean group mass, with its standard deviation, and converting to using Equation 6 of Yang et al. (2007). Note that the Yang et al. (2007) group catalog was the origin of the McGee et al. group sample.
The MENeaCS box in Figure Intracluster supernovae in the Multi-Epoch Nearby Cluster Survey represents our ICL stellar mass fraction result (within ) including Abell399_3_14_0 as an IC SN. The upper limit arrow represents the limit on the IC stellar mass fraction assuming that all IC stars are from an old stellar population (while including Abell399_3_14_0 as an IC SNe). The combined SN results at the group scale with our own confirm the declining IC stellar mass fraction, as a function of cluster mass, seen by Gonzalez et al. (2007).
The decline in IC stellar mass fraction as a function of halo mass may point to the assembly history of massive clusters. Speaking in broad terms, if one assumes that groups are the dominant building block of clusters then the groups that made present day clusters could not have had the high IC stellar mass fraction that we see today, unless some mechanism could remove intragroup stars during the cluster formation process. Moderate redshift measurements of the intragroup stellar fraction should be lower than those seen at low redshift to fit in with expectations from hierarchical structure formation.
4.5. The spatial distribution of intracluster supernovae
In Figure Intracluster supernovae in the Multi-Epoch Nearby Cluster Survey we present the distribution of SNe Ia as a function of projected distance from the cluster center, scaled by . Represented by the black histogram, it is apparent that the IC SNe are more centrally concentrated in the cluster than the general, hosted population (keep in mind the MENeaCS SN coverage begins to be incomplete at ) – although this is subject to small number statistics. The fact that the ICL is more centrally concentrated than the cluster’s galaxies has been observed previously (e.g. Zibetti et al. 2005).
The central concentration of the IC SNe is not a clear cut marker for the underlying stellar population of the ICL. On the one hand, this may favor a scenario in which the IC stellar population is primarily old, since low redshift cluster cores are dominated by red sequence galaxies with old stellar populations (e.g. Urquhart et al. 2010). On the other hand, Smith et al. (2010) have shown, in their study of ultraviolet tails in the Coma cluster, that it is those few blue galaxies in Coma’s central regions (modulo projection effects) which are predominantly being stripped and contributing young stars to IC space. Our IC SNe distribution can not distinguish between these two scenarios.
In a precursor cluster SN survey to the current work, Sand et al. (2008) found 3 IC SN candidates at within their transient sample, and none at smaller radii, suggesting a relative deficit if the candidates proved authentic. Although it is plausible that infalling groups have their own detectable IC stellar population, this seems to be at odds with the current work, which has a similar radial coverage. Table 1 shows that our IC SNe were between 150 and 600 kpc from the cluster center (as measured from the BCG position). We suggest that the IC SN candidates at high clustercentric radii in Sand et al. (2008) were likely background events in need of spectroscopic confirmation, although we can not rule out that individual events were indeed associated with an extended IC stellar population. Indeed, although not discussed earlier, MENeaCS had one viable IC SN Ia candidate which was followed up with our Gemini ToO program which turned out to be a background SN Ia at . Deep imaging may yet uncover a faint host at its position, and other apparently hostless SNe are routinely reported in the literature (Sullivan et al. 2006).
5. Summary and Conclusions
The MENeaCS cluster SNe survey has spectroscopically confirmed a sample of twenty-three cluster SN Ia, four of which have no hosts upon close inspection. We use this sample of hostless SNe to constrain the IC stellar mass fraction, and the extent of the ICL in clusters. We have presented confirmational spectroscopy of these IC SN candidates, concluding that Abell85_6_08_0 was likely a SN 1991bg-like event, suggesting that a component of the IC stellar population is old, as seen by others (e.g. Williams et al. 2007). Deep CFHT/Megacam imaging indicated that one of our events, Abell399_3_14_0, is spatially coincident with the outskirts of a nearby red sequence galaxy, but the velocity offset between the SN and its putative host (along with evident tidal debris in the region) show that it is likely unbound and thus an IC SN. We characterized our detection limit for faint host galaxies by implanting artificial stars into our deep stack images and found detection limits of and in all cases. Using the Virgo Cluster luminosity function of Trentham & Tully (2002), we calculate that of the clusters’ luminosity is in dwarf galaxies below our detection limit. Assuming a very steep faint end slope of increases this number to , making it very unlikely that more than one of our IC SN Ia candidates was hosted by a faint dwarf, as long as there is no mechanism for boosting the SN Ia rate among very faint hosts (e.g Pfahl et al. 2009; Li et al. 2010). All four IC SNe occurred within 600 kpc of the cluster center, while our hosted SNe are seen out to and beyond, illustrating that the ICL is more centrally concentrated than the cluster galaxies.
After accounting for observational biases which made our IC SNe easier to discover and follow up, we calculate an IC stellar mass fraction of (68% confidence limit) for all objects within , assuming that the cluster galaxies and the IC stars have a similar mix of stellar populations. If we instead assume that the IC stellar population is exclusively old, and that the cluster galaxies have a mix of stellar ages, we derive an upper limit on the IC stellar mass fraction of (84% one-sided confidence limit). This is in excellent agreement with the majority of IC measurements in the literature. These results, along with the IC stellar mass fraction at the group scale provided by the SNe study of McGee & Balogh (2010), allow us to confirm the declining stellar mass fraction as a function of halo mass reported by Gonzalez et al. (2007). IC and intragroup studies at higher redshift will further constrain the assembly history of these massive halos. Indeed, one exciting avenue is the pursuit of IC SNe to higher redshift, where cosmological surface brightness dimming will greatly reduce the utility of traditional direct measurements of the ICL.
Future prospects for hostless SN studies are excellent. With the advent of large, dedicated time domain surveys such as the Palomar Transient Factory, SkyMapper, Pan-Starrs, La Silla-QUEST Variability Survey and the Large Synoptic Survey Telescope, the number of hostless SNe should increase rapidly. These additional numbers will provide the statistical confidence necessary to truly constrain the extent and content of diffuse light at a variety of halo mass scales.
References
- REV (????) ????
- 08 (1) 08. 1
- Abadi et al. (2006) Abadi, M. G., Navarro, J. F., & Steinmetz, M. 2006, MNRAS, 365, 747
- Arnaboldi et al. (2004) Arnaboldi, M., Gerhard, O., Aguerri, J. A. L., Freeman, K. C., Napolitano, N. R., Okamura, S., & Yasuda, N. 2004, ApJ, 614, L33
- Barbary et al. (2010) Barbary, K., et al. 2010, ArXiv e-prints, 1010.5786
- Bertin & Arnouts (1996) Bertin, E., & Arnouts, S. 1996, A&AS, 117, 393
- Binggeli et al. (1985) Binggeli, B., Sandage, A., & Tammann, G. A. 1985, AJ, 90, 1681
- Blanton & Roweis (2007) Blanton, M. R., & Roweis, S. 2007, AJ, 133, 734
- Blondin & Tonry (2007) Blondin, S., & Tonry, J. L. 2007, ApJ, 666, 1024
- Bolton et al. (2008) Bolton, A. S., Treu, T., Koopmans, L. V. E., Gavazzi, R., Moustakas, L. A., Burles, S., Schlegel, D. J., & Wayth, R. 2008, ApJ, 684, 248
- Da Rocha et al. (2008) Da Rocha, C., Ziegler, B. L., & Mendes de Oliveira, C. 2008, MNRAS, 388, 1433
- Dilday et al. (2010a) Dilday, B., et al. 2010a, ApJ, 715, 1021
- Dilday et al. (2010b) ——. 2010b, ApJ, 713, 1026
- Dolag et al. (2010) Dolag, K., Murante, G., & Borgani, S. 2010, MNRAS, 405, 1544
- Eisenstein et al. (2001) Eisenstein, D. J., et al. 2001, AJ, 122, 2267
- Fabricant et al. (2005) Fabricant, D., et al. 2005, PASP, 117, 1411
- Foley et al. (2009) Foley, R. J., et al. 2009, AJ, 137, 3731
- Gal-Yam et al. (2007) Gal-Yam, A., et al. 2007, ApJ, 656, 372
- Gal-Yam et al. (2003) Gal-Yam, A., Maoz, D., Guhathakurta, P., & Filippenko, A. V. 2003, AJ, 125, 1087
- Gal-Yam et al. (2008) ——. 2008, ApJ, 680, 550
- Gal-Yam & Simon (2008) Gal-Yam, A., & Simon, J. 2008, The Astronomer’s Telegram, 1617, 1
- Gehrels (1986) Gehrels, N. 1986, ApJ, 303, 336
- Germany (1998) Germany, L. 1998, IAU Circ., 6898, 1
- Gonzalez et al. (2005) Gonzalez, A. H., Zabludoff, A. I., & Zaritsky, D. 2005, ApJ, 618, 195
- Gonzalez et al. (2000) Gonzalez, A. H., Zabludoff, A. I., Zaritsky, D., & Dalcanton, J. J. 2000, ApJ, 536, 561
- Gonzalez et al. (2007) Gonzalez, A. H., Zaritsky, D., & Zabludoff, A. I. 2007, ArXiv e-prints, 705, 0705.1726
- Hamuy et al. (1995) Hamuy, M., Phillips, M. M., Maza, J., Suntzeff, N. B., Schommer, R. A., & Aviles, R. 1995, AJ, 109, 1
- Hook et al. (2004) Hook, I. M., Jørgensen, I., Allington-Smith, J. R., Davies, R. L., Metcalfe, N., Murowinski, R. G., & Crampton, D. 2004, PASP, 116, 425
- Howell (2001) Howell, D. A. 2001, ApJ, 554, L193
- Ivanova et al. (2006) Ivanova, N., Heinke, C. O., Rasio, F. A., Taam, R. E., Belczynski, K., & Fregeau, J. 2006, MNRAS, 372, 1043
- Janowiecki et al. (2010) Janowiecki, S., Mihos, J. C., Harding, P., Feldmeier, J. J., Rudick, C., & Morrison, H. 2010, ArXiv e-prints, 1004.1473
- Just et al. (2010) Just, D. W., Zaritsky, D., Sand, D. J., Desai, V., & Rudnick, G. 2010, ApJ, 711, 192
- Komiyama et al. (2002) Komiyama, Y., et al. 2002, ApJS, 138, 265
- Krick & Bernstein (2007) Krick, J. E., & Bernstein, R. A. 2007, AJ, 134, 466
- Krick et al. (2006) Krick, J. E., Bernstein, R. A., & Pimbblet, K. A. 2006, AJ, 131, 168
- Kurtz & Mink (1998) Kurtz, M. J., & Mink, D. J. 1998, PASP, 110, 934
- Lee et al. (2010) Lee, M. G., Park, H. S., & Hwang, H. S. 2010, Science, 328, 334
- Li et al. (2010) Li, W., et al. 2010, ArXiv e-prints, 1006.4612
- Mannucci et al. (2005) Mannucci, F., Della Valle, M., Panagia, N., Cappellaro, E., Cresci, G., Maiolino, R., Petrosian, A., & Turatto, M. 2005, A&A, 433, 807
- Mannucci et al. (2008) Mannucci, F., Maoz, D., Sharon, K., Botticella, M. T., Della Valle, M., Gal-Yam, A., & Panagia, N. 2008, MNRAS, 383, 1121
- Maoz et al. (2010) Maoz, D., Mannucci, F., Li, W., Filippenko, A. V., Della Valle, M., & Panagia, N. 2010, ArXiv e-prints, 1002.3056
- McGee & Balogh (2010) McGee, S. L., & Balogh, M. L. 2010, MNRAS, 403, L79
- Milne et al. (2007) Milne, M. L., Pritchet, C. J., Poole, G. B., Gwyn, S. D. J., Kavelaars, J. J., Harris, W. E., & Hanes, D. A. 2007, AJ, 133, 177
- Murante et al. (2004) Murante, G., et al. 2004, ApJ, 607, L83
- Nugent et al. (2002) Nugent, P., Kim, A., & Perlmutter, S. 2002, PASP, 114, 803
- Peng et al. (2002) Peng, C. Y., Ho, L. C., Impey, C. D., & Rix, H. 2002, AJ, 124, 266
- Penny et al. (2010) Penny, S. J., Conselice, C. J., de Rijcke, S., Held, E. V., Gallagher, J. S., & O’Connell, R. W. 2010, MNRAS, 1429
- Pfahl et al. (2009) Pfahl, E., Scannapieco, E., & Bildsten, L. 2009, ApJ, 695, L111
- Pritchet et al. (2008) Pritchet, C. J., Howell, D. A., & Sullivan, M. 2008, ApJ, 683, L25
- Puchwein et al. (2010) Puchwein, E., Springel, V., Sijacki, D., & Dolag, K. 2010, ArXiv e-prints, 1001.3018
- Purcell et al. (2008) Purcell, C. W., Bullock, J. S., & Zentner, A. R. 2008, MNRAS, 391, 550
- Reiprich & Böhringer (2002) Reiprich, T. H., & Böhringer, H. 2002, ApJ, 567, 716
- Reiss & Sabine (1998) Reiss, D., & Sabine, S. 1998, IAU Circ., 7015, 1
- Rines & Diaferio (2006) Rines, K., & Diaferio, A. 2006, AJ, 132, 1275
- Rosswog et al. (2008) Rosswog, S., Ramirez-Ruiz, E., & Hix, W. R. 2008, ApJ, 679, 1385
- Rudick et al. (2010) Rudick, C. S., Mihos, J. C., Harding, P., Feldmeier, J. J., Janowiecki, S., & Morrison, H. L. 2010, ArXiv e-prints, 1003.4500
- Rudnick et al. (2009) Rudnick, G., et al. 2009, ApJ, 700, 1559
- Sand et al. (2008) Sand, D. J., Zaritsky, D., Herbert-Fort, S., Sivanandam, S., & Clowe, D. 2008, AJ, 135, 1917
- Scannapieco & Bildsten (2005) Scannapieco, E., & Bildsten, L. 2005, ApJ, 629, L85
- Shara & Hurley (2002) Shara, M. M., & Hurley, J. R. 2002, ApJ, 571, 830
- Sharon et al. (2010) Sharon, K., et al. 2010, ApJ, 718, 876
- Sharon et al. (2007) Sharon, K., Gal-Yam, A., Maoz, D., Filippenko, A. V., & Guhathakurta, P. 2007, ApJ, 660, 1165
- Sivanandam et al. (2010) Sivanandam, S., Rieke, M. J., & Rieke, G. H. 2010, ApJ, 717, 147
- Sivanandam et al. (2009) Sivanandam, S., Zabludoff, A. I., Zaritsky, D., Gonzalez, A. H., & Kelson, D. D. 2009, ApJ, 691, 1787
- Smith (1981) Smith, H. A. 1981, AJ, 86, 998
- Smith et al. (2010) Smith, R. J., et al. 2010, MNRAS, 1238
- Sommer-Larsen et al. (2005) Sommer-Larsen, J., Romeo, A. D., & Portinari, L. 2005, MNRAS, 357, 478
- Sullivan et al. (2006) Sullivan, M., et al. 2006, ApJ, 648, 868
- Sun et al. (2010) Sun, M., Donahue, M., Roediger, E., Nulsen, P. E. J., Voit, G. M., Sarazin, C., Forman, W., & Jones, C. 2010, ApJ, 708, 946
- Sun et al. (2007) Sun, M., Donahue, M., & Voit, G. M. 2007, ArXiv e-prints, 706, 0706.1220
- Tal et al. (2009) Tal, T., van Dokkum, P. G., Nelan, J., & Bezanson, R. 2009, AJ, 138, 1417
- Taubenberger et al. (2008) Taubenberger, S., et al. 2008, MNRAS, 385, 75
- Tonry & Davis (1979) Tonry, J., & Davis, M. 1979, AJ, 84, 1511
- Trentham & Tully (2002) Trentham, N., & Tully, R. B. 2002, MNRAS, 335, 712
- Urquhart et al. (2010) Urquhart, S. A., Willis, J. P., Hoekstra, H., & Pierre, M. 2010, MNRAS, 406, 368
- van der Wel et al. (2008) van der Wel, A., Holden, B. P., Zirm, A. W., Franx, M., Rettura, A., Illingworth, G. D., & Ford, H. C. 2008, ApJ, 688, 48
- van Dokkum (2005) van Dokkum, P. G. 2005, AJ, 130, 2647
- Williams et al. (2007) Williams, B. F., et al. 2007, ApJ, 656, 756
- Williams et al. (2004) Williams, G. G., Olszewski, E., Lesser, M. P., & Burge, J. H. 2004, in Ground-based Instrumentation for Astronomy. Edited by Alan F. M. Moorwood and Iye Masanori. Proceedings of the SPIE, Volume 5492, pp. 787-798 (2004)., ed. A. F. M. Moorwood & M. Iye, 787–798
- Willman et al. (2004) Willman, B., Governato, F., Wadsley, J., & Quinn, T. 2004, MNRAS, 355, 159
- Wu et al. (1999) Wu, X., Xue, Y., & Fang, L. 1999, ApJ, 524, 22
- Yang et al. (2007) Yang, X., Mo, H. J., van den Bosch, F. C., Pasquali, A., Li, C., & Barden, M. 2007, ApJ, 671, 153
- Zibetti et al. (2005) Zibetti, S., White, S. D. M., Schneider, D. P., & Brinkmann, J. 2005, MNRAS, 358, 949
![[Uncaptioned image]](/html/1011.1310/assets/x1.png)
A histogram of the SN to host galaxy distance for the cluster SNe Ia in the MENeaCS sample, expressed in units of the host’s effective radius, . The four IC SNe discussed in the current work, shown as dashed lines, lie at a host – SN distance from the nearest possible host.
![[Uncaptioned image]](/html/1011.1310/assets/x14.png)
A histogram of the velocity offset between Abell399_3_14_0 and Galaxy 1 for the twenty good SNID template matches to the SN. None of the template redshifts are within 500 km s-1 of the galaxy. We argue that Abell399_3_14_0 is a part of a stellar population which either is unbound or is becoming IC stars since it lies in the outskirts of Galaxy 1, has a significant velocity difference with that system, and Galaxy 1 itself has associated low surface brightness plumes indicating a recent interaction (see discussion in § 3.4.4).
![[Uncaptioned image]](/html/1011.1310/assets/x15.png)
A comparison of the IC stellar mass fraction measured in the current work (solid lined box for our numbers at including Abell399_3_14_0 as an IC SNe; the upper limit assumes that the IC stars are universally old) with the results of Gonzalez et al. (2007), who measured the ICL fraction via direct surface brightness observations for a sample of 23 low redshift galaxy clusters (points with error bars). Also plotted are the intragroup SN results of McGee & Balogh (2010), using both their raw numbers (dashed box) and those made after assuming that the IC stellar population is composed of only old stars (dotted box). The combined SN results confirm the declining IC stellar mass fraction as a function of cluster mass seen by Gonzalez et al. (2007).
![[Uncaptioned image]](/html/1011.1310/assets/x16.png)
The distribution of cluster SN Ia in the MENeaCS survey, with the IC SNe marked by the dark histogram. The IC SNe are more centrally concentrated than the hosted cluster SN Ia population.
| MENeaCS ID | IAUC ID | UT Date | Telescope/ | Type | Template | Phase | Exp. Time | Clustercentric | |
|---|---|---|---|---|---|---|---|---|---|
| Instrument | (days) | (s) | Radius (kpc) | ||||||
| Abell1650_9_13_0 | … | 2009-12-21.45 | MMT/Hecto | Ia-norm | 0.0836 (0.0048) | SN2002er | -0.8 (4.7) | 2700.0 | 468 |
| Abell2495_5_13_0 | SN2009hc | 2009-06-18.58 | Gemini/GMOS | Ia-norm | 0.0796 (0.0032) | SN1998aq | 83.3 (15.1) | 3000.0 | 148 |
| Abell85_6_08_0 | … | 2009-07-04.60 | Gemini/GMOS | Ia-91bg | 0.0617 (0.0007) | SN1991bg | 34.1 (5.5) | 1800.0 | 595 |
| Abell399_3_14_0 | SN2008ih | 2008-11-28.49 | Gemini/GMOS | Ia-norm | 0.0613 (0.0025) | SN2003du | 14.4 (2.4) | 1200.0 | 616 |
| Cluster | Exposure Time | limit | limit | |||
|---|---|---|---|---|---|---|
| (s) | (mag) | (mag) | ||||
| Abell 1650 | 0.0838 | 2280 | -12.47 | … | ||
| 2240 | … | -13.04 | 0.0012 | 0.0172 | ||
| Abell 2495 | 0.0775 | 1920 | -11.72 | -12.37 | 0.0007 | 0.0127 |
| Abell 85 | 0.0578 | 1920 | -11.15 | -11.68 | 0.0004 | 0.0091 |
| Abell 399 | 0.0718 | 720 | -12.54 | .. | ||
| 2400 | … | -12.56 | 0.0009 | 0.0138 |
| Scenario | Correction Factor |
|---|---|
| Hosted to hostless SN detection efficiency | 0.91 |
| Spectroscopic availability bias | 0.91 |
| Hostless follow-up bias | strike Abell2495_5_13_0 from IC calculations |
| Scenario | Num. of IC SNeaaThese are the raw number of SNe, after removing Abell2495_5_13_0 (see § 4.1). The correction factors described in § 4.1 are applied before the IC stellar mass fraction is calculated. See Equation 2. | Num. of hosted SNeaaThese are the raw number of SNe, after removing Abell2495_5_13_0 (see § 4.1). The correction factors described in § 4.1 are applied before the IC stellar mass fraction is calculated. See Equation 2. | IC stellar mass fraction |
|---|---|---|---|
| All hosts | 2 | 20 | |
| All hosts (with Abell399_3_14_0 as IC) | 3 | 19 | |
| Red sequence hosts | 2 | 8 | |
| Red sequence hosts (with Abell399_3_14_0) | 3 | 7 | |
| Hosts within | 2 | 14 | |
| Hosts within (with Abell399_3_14_0) | 3 | 13 | |
| Red sequence hosts within | 2 | 6 | |
| Red sequence hosts within (with Abell399_3_14_0) | 3 | 5 |