Isotope shift and hyperfine splitting of the transition in potassium
Abstract
We have investigated transition ( line) of the potassium isotopes 39K, 40K, and 41K using Doppler-free laser saturation spectroscopy. Our measurements reveal the hyperfine splitting of the state of 40K and we have determined the specific mass shift and the nuclear field shift constants for the blue line.
pacs:
32.10.-f 31.30.GsI Introduction
The dependence of an atomic transition frequency on the properties of the nucleus is a frequently investigated question in laser spectroscopy. Possible effects include the hyperfine interaction, which relies on the coupling of the angular momenta of electrons and the nucleus, and isotope shifts, which depend on the mass of the nucleus and its internal charge distribution.
In atomic potassium, the isotopic composition makes systematic experiments of hyperfine interactions and isotope shifts of atomic transitions very challenging. Two highly abundant isotopes (39K and 41K) are accompanied by many isotopes with very low natural abundance. However, the knowledge of the relative frequency shifts of at least two pairs of isotopes are required to determine the size of the two non-trivial contributions to the isotope shift: the electronic correlation factor and the volume shift due to the charge distribution of the nucleus King1963 . Therefore, spectroscopy of the third-most abundant isotope 40K () is crucial. Aside from the prospect of exploring the fundamental atomic structure of potassium, demand for precise laser spectroscopic properties of 40K also stems from its use in the physics of degenerate Fermi gases, where it is the isotope of choice in many experiments Demarco1999c ; Roati2002 ; Aubin2005 ; Kohl2005b ; Ospelkaus2006 ; Rom2006 ; Klempt2007 ; Wille2008 ; Taglieber2008 ; Tiecke2010 ; Frohlich2011 .
The transition of potassium near 770 nm has been investigated thoroughly several decades ago for isotopes from 38K through 47K Bendali1981 ; Touchard1982 . The results of laser spectroscopic isotope shift measurements have been compared to nuclear physics experiments regarding the nuclear charge radius as well as to theoretical calculations for the electronic correlations Martensson1990 . Meanwhile, frequency-comb based measurements of this transition have significantly improved the accuracy for the isotopes 39K through 41K Falke2006 .
The blue transition of potassium near nm is considerably weaker than the transition, which makes experiments on isotopes with small natural abundance even more difficult. Consequently, investigations of this transition are scarce. However, recently interest in this transition has renewed because advances in semiconductor laser technology make the wavelength easily accessible Uetake2003 . Measurements of the isotope shifts of the transition have been undertaken in 39K and 41K using Doppler-free saturation spectroscopy Halloran2009 and in 39K, 40K, and 41K using resonance ionization mass spectrometry (RIMS) Iwata2010 . While the sensitivity of the RIMS method is good to detect the low-abundant isotope 40K, its spectral resolution is limited. In particular, the hyperfine splitting of the excited state was not observed for any of the isotopes.
II Experimental setup
We perform Doppler-free saturation spectroscopy on a potassium vapor cell containing isotopically enriched 40K (). Our experimental setup is sketched in Figure 1. The cell (length 100 mm) is heated to approximately C to provide sufficient absorption on the transition. The laser source is a diode laser (Mitsubishi ML320G2-11) operating at 405 nm in an external cavity setup Ricci1995 . The laser frequency is swept with a frequency of 11 Hz by angle-tuning the position of the diffraction grating in the laser setup using a piezo transducer.
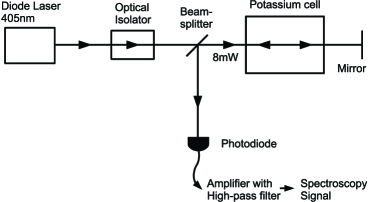
The laser beam is sent through the vapor cell and is retro-reflected from a mirror. After traveling again through the cell, the beam is reflected by a beam splitter to a photodiode. The photodiode signal is amplified and high-pass filtered with a bandwidth of 1 kHz. We use derivatives of Lorentzian functions to fit the measured data and to determine the zero crossing of each line. Afterwards we use the well known ground state splitting of 41K of 254.0 MHz and 40K of 1285.8 MHz Arimondo1977 as normalization of the frequency axis and for linearizing the piezo scan.
The power of the laser when entering the spectroscopy cell is approximately 8 mW in a beam of 5 mm diameter, therefore exceeding the saturation intensity 3.4 W/m2 of this transition by two orders of magnitude. Here, is Planck’s constant, is the speed of light, and ns is the lifetime of the excited state NIST2010 . For the and transitions of 40K we observe a line width of approximately 13 MHz, somewhat larger than the expected saturation-broadened line width of 5 MHz, which possibly could result from residual magnetic fields inside the unshielded vapor cell.

Figure 2 shows the measured spectrum of the three isotopes 39K, 40K, and 41K. The zero of the frequency axis is chosen at the transition of 39K. Here denotes the total angular momentum of the atom comprising of the nuclear spin ( for 39K and 41K, and for 40K) and electronic angular momentum . We use the notation to label the ground state and to label the excited state. We estimate the uncertainty of the frequency calibration to be MHz.
III Hyperfine splitting of the state of 40K
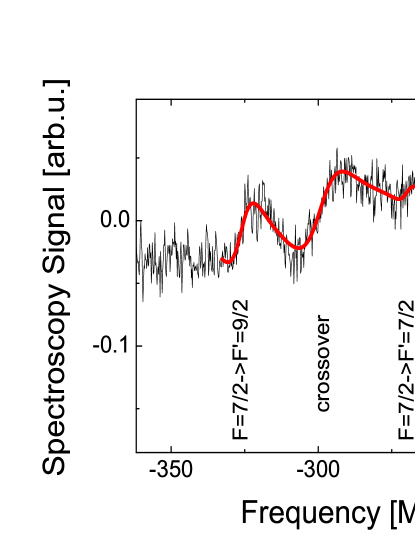
While for the two most abundant isotopes 39K and 41K the hyperfine splitting of the state has been measured previously Arimondo1977 , no such data have been available for 40K. Our Doppler-free saturation spectrum directly reveals the hyperfine splitting of the state of 40K, see Figure 2, on transitions originating from both the ground states and . Figure 3 shows a close-up of the two sections together with our fits. On the manifold we observe three equally strong lines, which correspond to the and transitions together with a crossover resonance in between. On the manifold we observe two strong lines, which we assign to the transition and a crossover resonance, and a very weak signal which we assign to the transition. Theoretically, this line has a line strength which is factor of five smaller than the line which is compatible with our data. From the splitting of the lines we determine the hyperfine interaction constant MHz. Our measured value is in good agreement with the value obtained by scaling the previously known value MHz Arimondo1977 by the known ratio of the nuclear g-factors which would result in MHz. The much smaller excited state hyperfine splitting of the isotopes 39K and 41K is below our resolution.
IV Isotope shifts
The isotope shift of an atomic transition between two different isotopes labeled and arises from a sum of contributions of different physical origins, which can be parameterized by the following expression Martensson1990
| (1) |
Here, is the electron mass, the mass of the lighter nucleus and the mass of the heavier nucleus. This choice defines the convention of the sign of the shift. The first contribution is the normal mass shift (NMS) which results from the change of the reduced mass in the effective two-body problem due to the change of the mass of the nucleus. , with THz NIST2010 denoting the resonance frequency of the transition. Usually, the normal mass shift is the dominant contribution to the observed isotope shift.
The remaining shift, often referred to as the residual mass shift , results from more subtle effects. The constant describing the specific mass shift is the expectation value of the operator of the different electronic momenta . Generally, it is difficult to evaluate this contribution theoretically for atoms with many electrons. However, since depends only on electron-electron correlations, it is a constant for a chosen transition and does not depend on the nuclear mass. In contrast, the contribution of the field shift is determined by the difference of the electron density at the nucleus for two involved states times the difference of the charge radius of the nucleus for the two isotopes. For determining both constants and at least two pairs of isotopes have to be measured if the nuclear charge radii are known.
Our spectrum (see Figure 2) contains all three isotopes 39K, 40K, and 41K and we determine the isotope shifts. We find MHz, which is in agreement with the results of Halloran et al. Halloran2009 and Iwata et al. Iwata2010 . The isotope shift of the low-abundance isotope 40K with respect to 39K is MHz. Our value for this isotope shift is in disagreement with the very recent result of MHz Iwata2010 . This discrepancy could be due to the fact that the hyperfine structure was not resolved in experiment Iwata2010 or because of additional systematic errors, which were estimated up to another in their setup. From the measured isotope shift we determine the residual mass shift . For the residual mass shift we find MHz and MHz.
Using the nuclear charge radii differences for potassium tabulated in reference Martensson1990 we determine GHz amu and MHz fm-2 for the transition. The error bars are largely determined by the uncertainty of the frequency shift. Our results should be compared to GHz amu and MHz fm-2 on the transition Martensson1990 . We conclude that for the transition the specific isotope shift is larger, possibly because the higher electronically excited state gives rise to larger electron-electron correlations. In contrast, the field shift reduces as compared to the transition which could reflect the smaller overlap of the wave function with the nucleus as compared to the electronic wave function.
V Conclusion
In conclusion, we have measured the hyperfine splitting of the state of 40K and determined the isotope shift of the transition, exceeding the previously achieved accuracy for the low-abundance isotope 40K by one order of magnitude. Our results contribute to determining the atomic structure of potassium more accurately. From the measurement of two isotope shifts we could determine the specific mass shift constant GHz amu and field shift constant MHz fm-2 of the transition. The hyperfine interaction constant of MHz is in agreement with the theoretically anticipated value.
The work has been supported by EPSRC (EP/G029547/1) and ERC (Grant number 240335).
References
- (1) W. H. King, Journal of Optical Society 53, 638 (1963)
- (2) B. DeMarco and D. Jin, Science 285, 1703 (1999)
- (3) G. Roati, F. Riboli, G. Modugno, and M. Inguscio, Phys. Rev. Lett. 89, 150403 (2002)
- (4) S. Aubin et al., J. Low. Temp. Phys. 140, 377 (2005)
- (5) M. Köhl, H. Moritz, T. Stöferle, K. Günter, and T. Esslinger, Phys. Rev. Lett. 94, 080403 (2005)
- (6) C. Ospelkaus, S. Ospelkaus, L. Humbert, P. Ernst, K. Sengstock, and K. Bongs, Phys. Rev. Lett. 97, 120402 (Sep 2006)
- (7) T. Rom et al., Nature 444, 733 (2006)
- (8) C. Klempt et al., Phys. Rev. A 76, 020701 (2007)
- (9) E. Wille et al., Phys. Rev. Lett. 100, 053201 (2008)
- (10) M. Taglieber, A.-C. Voigt, T. Aoki, T. W. Hänsch, and K. Dieckmann, Phys. Rev. Lett. 100, 010401 (2008)
- (11) T. G. Tiecke et al., Phys. Rev. Lett. 104, 053202 (2010)
- (12) B. Fröhlich et al., Phys. Rev. Lett. 106, 105301 (2011)
- (13) N. Bendali, H. T. Duong, and J. L. Vialle, J. Phys. B 14, 4231 (1981)
- (14) F. Touchard et al., Phys. Lett. B 108, 169 (1982)
- (15) A. Martensson-Pendrill, L. Pendrill, S. Salomonson, A. Ynnerman, and H. Warston, J. Phys. B 23, 1749 (1990)
- (16) S. Falke, E. Tiemann, C. Lisdat, H. Schnatz, and G. Grosche, Phys. Rev. A 74, 032503 (2006)
- (17) S. Uetake, K. Hayasaka, and M. Watanabe, Japanese Journal of Applied Physics 42, L332 (2003)
- (18) L. Halloran, S. Fostner, E. Paradis, and J. Behr, Optics Communications 282, 554 (2009)
- (19) Y. Iwata, Y. Inoue, and M. Minowa, arXiv:1010:5902, (2010)
- (20) L. Ricci et al., Optics Communications 117, 541 (1995)
- (21) E. Arimondo, M. Inguscio, and P. Violino, Review of Modern Physics 49, 31 (1977)
- (22) Y. Ralchenko, A. Kramida, J. Reader, and NIST ASD Team, “NIST Atomic Spectra Database (version 4.0),” Available: http://physics.nist.gov/asd (2010)