Predicting the frequencies of young and of tiny galaxies
Abstract
A simple, one-equation, galaxy formation model is applied to both the halo merger tree derived from a high-resolution dissipationless cosmological simulation and to a quarter million Monte-Carlo halo merger trees. The galaxy formation model involves a sharp entropy barrier against the accretion of gas onto low-mass halos, the shock heating of infalling gas far from the central regions of massive halos, and supernova feedback that drives the gas out of shallow halo potential wells. With the first approach, we show that the large majority of galaxies within group- and cluster-mass halos, known to be mainly dwarf ellipticals, have acquired the bulk of their stellar mass through gas accretion and not via galaxy mergers. With the second approach, we qualitatively reproduce the downsizing trend of greater ages at greater masses in stars and predict an upsizing trend of greater ages as one proceeds to masses lower than . We find that the fraction of galaxies with very young stellar populations (more than half the stellar mass formed within the last 1.5 Gyr) is a function of present-day stellar mass, which peaks at 0.5% at =, roughly corresponding to the masses of blue compact dwarfs. We predict that the stellar mass function of galaxies should not show a maximum at , with a power-law stellar mass function with slope if the IGM temperature in the outskirts of halos before reionization is set by molecular Hydrogen cooling. We speculate on the nature of the lowest mass galaxies.
1 Introduction
The mass growth of galaxies can occur either by accretion of gas that cools to form molecular clouds in which stars form or by galaxy mergers. While spiral disks are believed to form through the first mode, it is still unclear whether elliptical galaxies are built by mergers or not. We use a very simple toy model of galaxy formation [7] run on top of the dark matter halo merger tree obtained from a high-resolution dissipationless cosmological simulation (CS) to understand how dwarf galaxies acquire their mass. We also use our model to predict the frequency of galaxies such as the very metal-poor (1/50th solar metallicity) galaxy I Zw 18, for which the bulk of the stellar mass is younger than Gyr ([15, 27], see also [1] using HST color-magnitude diagrams) or 500 Myr ([22, 14] from photometric studies).
2 Galaxy formation model
Galaxies form in DM halos, and our toy model gives the mass in stars and cold gas, , as a function of halo mass and epoch , taking into account the fact that for stars to form one needs: 1) gas accretion, which is fully quenched for low-mass halos [26, 12]; 2) in cold form, which becomes inefficient in high-mass halos [4, 17]; and 3) to retain the interstellar gas against supernova (SN) winds [9]:
| (1) |
where = is the cosmic baryon fraction, is the minimum halo circular velocity for gas accretion (which rises abruptly after reionization; for ), is a characteristic velocity for SN feedback, represents the transition from pure cold to mainly hot accretion, and is the fraction of retained baryons in the form of cold gas.
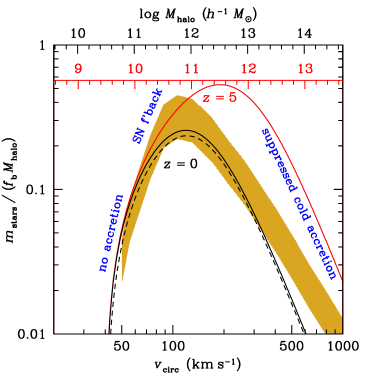
Figure 1 describes the efficiency of galaxy formation, , at =0 and 5, with the parameters tuned to match the observed (0.1) galaxy stellar mass function (MF) of [3]. Galaxy formation occurs in a fairly narrow range of halo masses, that varies with redshift.
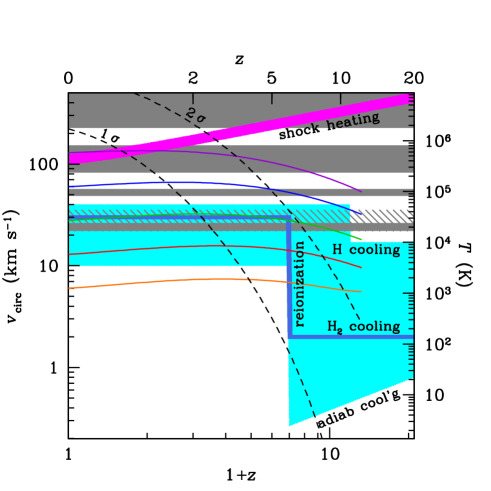
This is further illustrated in Figure 2, which shows the time evolution (from right to left) of halos ending with different circular velocity at . Interestingly, halos evolve, on average, with nearly constant circular velocity (however individual halos have constant , hence decreasing in their quiescent mode, so this decrease is compensated by the increases caused by mergers). Also, the temperatures affected by thermal instability (TI) are fairly narrow for the lowest mass galaxies, and TI can therefore be neglected to first order in our analysis.
We first apply equation (1) to the merger tree obtained from the halos and subhalos (AHF algorithm of [18]) of a high resolution dark matter CS. When a halo enters a more massive one, it becomes a subhalo and its galaxy becomes a satellite. The subhalo orbit is followed until either 1) dynamical friction (DF) causes it to fall to the halo center and necessarily see its galaxy merge with the central galaxy of the parent halo, or 2) it is tidally stripped and heated by the global halo potential to the point that there are insufficient particles to follow it. In this latter case (, corresponding to at ), we assume that the satellite galaxy merges with the central one after a delay set by DF, for which we adopt the timescale carefully calibrated by [16] with hydrodynamical CSs.
The present-day relation between stellar and halo mass obtained when our model (with , which is adequate for massive galaxies) is applied to the CS [7] is impressively close to the prediction derived by abundance matching [13]. Moreover, the variation of the stellar mass functions in different bins of halo mass matches very well the measurements from the SDSS [28].
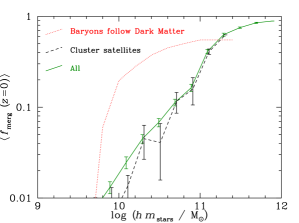
Figure 3 shows that while mergers dominate the growth of the massive galaxies (as expected from the toy model, since gas accretion is quenched at high masses), their importance drops sharply when one moves to stellar masses below (the mass resolution is , where the median fraction of stellar mass acquired by mergers no longer decreases with faster than in our reference model where baryons trace the dark matter [red dotted line]). This dominance of gas accretion at low mass is also true for the satellites of clusters (dashed line). Since observations indicate that most satellites of clusters are dwarf ellipticals (dEs), we conclude that cluster dEs are most often not built by mergers. One must resort to other mechanisms (not included in our toy model) that transform dwarf irregulars into dEs (e.g. harassment [20] or ram pressure stripping [5]).
3 When do dwarf galaxies form their stars?
We have used the halo merger tree code of [21] to statistically study the star formation histories (SFHs) of dwarf galaxies. We consider 24 final halo masses geometrically spaced between and , and run each halo merger tree 10 000 times. We run the toy model (eq. [1] with ) on the branches of the halo merger tree (moving forward in time) to follow the evolution of stellar mass. To compare our predictions to SDSS measurements (at ), we correct our stellar masses for the non-inclusion of gas in equation (1), assuming that the gas-to-star fraction is
| (2) |
where we derive and by fitting a straight line through Fig. 11 of [2]. This correction involves solving an implicit equation, which we perform iteratively.
The predicted MFs match fairly well the observed MFs. The left panel of Fig. 4 suggests that reionization must occur late (=6).
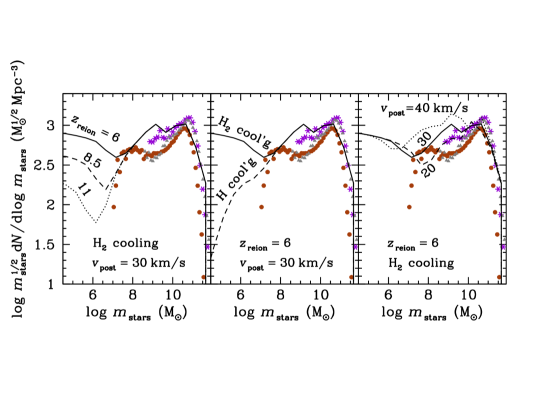
The middle panel hints that, before reionization, the temperature of the IGM must be set by molecular cooling (). The right panel indicates a good match between predicted and observed stellar MFs when the IGM after reionization is not too cool ().
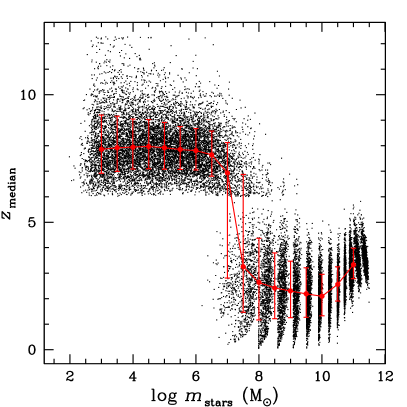
According to the left panel of Figure 5, as one proceeds from the highest final stellar masses to lower ones, the median stellar age first diminishes, qualitatively reproducing the downsizing of star formation. However this downsizing stops at and as one proceeds to even lower masses, one notices an upsizing of stellar ages, first weak, becoming strong at . In our model, the smallest galaxies form most of their stars before reionization.

Classical dwarf spheroidals, with should have moderately old stellar populations, with a large scatter (caused by the nearly constant average evolution of halo circular velocity), while ultra-faint dwarfs should be extremely old (see also [23]). Note that our model predicts a discontinuity in median age versus mass at , which appears to be in conflict with the continuity of the metallicity-mass relation [19].
Young galaxies must cross the low-mass (entropy) barrier (thick broken line in Fig. 2) only very late. The right panel of Figure 5 shows that the frequency of galaxies with the bulk of their mass in stars acquired within the last 1.5 Gyr is maximal at at =. The presence of a young galaxy such as I Zw 18, whose stellar mass is of order [27], is consistent with our model: we predict 0.02% of young galaxies at , and with 941 in this mass range in the SDSS, we expect 0.2 young galaxies in SDSS at this mass, hence (from Poisson statistics) there is a probability of 18% of detecting at least one galaxy as young as I Zw 18 in this mass bin.
Our model also predicts several hundred young galaxies in the SDSS, mostly at (fraction of 0.2%). In comparison, a first analysis of luminosity-weighted ages of high surface brightness SDSS galaxies by [10] leads to times higher fractions of young galaxies: 16% with ages younger than 1 Gyr at . A second analysis by the same team, this time of mass-weighted stellar ages for a large fraction of SDSS galaxies [11], reveals much lower fractions of young galaxies: 1.4% at , but still as much as 15% at , still respectively 7 and 30 times higher than our predictions. Also, the fraction of ages (summing over all masses) less than 4 Gyr derived from a much more-refined semi-analytical model [8] run on the Millennium cosmological dark matter simulation [25] is negligible in comparison with [11]’s prediction of 3%. This discrepancy in the predicted fractions of young stellar populations among galaxies of intermediate mass is thus an open issue worth further exploration.
4 The lowest mass galaxies
The middle panel of Figure 4 indicates that there is no peak in the best fitting galaxy MF, if the IGM temperature before reionization is set by molecular Hydrogen cooling (=) with a low-end slope of . This is in excellent agreement with the slope of found by [2]. If, instead, the IGM temperature before reionization is set by atomic Hydrogen cooling (=), the mass function peaks at =. This maximum is probably not caused by of our mass resolution, since no such peak is seen when the pre-reionization IGM temperature is set by cooling.
The importance of the low-end tail of the galaxy MF raises the question of the nature of very low mass objects (). Two classes of objects come to mind: Globular Clusters (GCs) and High Velocity Clouds (HVCs). However, in our model, these objects must be (or have been) associated with DM halos. While Galactic HVCs do appear to require DM [6], Galactic GCs don’t (e.g. [24]), perhaps because they are closer and more tidally stripped.
Acknowledgments
We thank Joe Silk for useful discussions, the Editors for useful suggestions and Jarle Brinchmann and Anna Gallazzi for respectively supplying us with the stellar masses and fractions of young galaxies in the SDSS.
References
- Aloisi et al. [2007] A. Aloisi, G. Clementini, M. Tosi, et al. 2007, ApJ, 667, L151
- Baldry et al. [2008] I. K. Baldry, K. Glazebrook, and S. P. Driver, 2008, MNRAS, 388, 945
- Bell et al. [2003] E. F. Bell, D. H. McIntosh, N. Katz, and M. D. Weinberg, 2003, ApJS, 149, 289
- Birnboim and Dekel [2003] Y. Birnboim and A. Dekel, 2003, MNRAS, 345, 349
- Boselli et al. [2008] A. Boselli, S. Boissier, L. Cortese, and G. Gavazzi, 2008, ApJ, 674, 742
- Brüns and Westmeier [2004] C. Brüns and T. Westmeier, 2004, A&A, 426, L9
- Cattaneo et al. [2011] A. Cattaneo, G. A. Mamon, K. Warnick, and A. Knebe, 2011, A&A, submitted, arXiv:1002.3257
- De Lucia and Blaizot [2007] G. De Lucia and J. Blaizot, 2007, MNRAS, 375, 2
- Dekel and Silk [1986] A. Dekel and J. Silk, 1986, ApJ, 303, 39
- Gallazzi et al. [2005] A. Gallazzi, S. Charlot, J. Brinchmann, S. D. M. White, and C. A. Tremonti, 2005, MNRAS, 362, 41
- Gallazzi et al. [2008] A. Gallazzi, J. Brinchmann, S. Charlot, and S. D. M. White, 2008, MNRAS, 383, 1439
- Gnedin [2000] N. Y. Gnedin, 2000, ApJ, 542, 535
- Guo et al. [2010] Q. Guo, S. D. M. White, C. Li and M. Boylan-Kolchin, 2010, MNRAS, 404, 1111
- Hunt et al. [2003] L. K. Hunt, T. X. Thuan, and Y. I. Izotov, 2003, ApJ, 588, 281
- Izotov and Thuan [2004] Y. I. Izotov and T. X. Thuan, 2004, ApJ, 616, 768
- Jiang et al. [2008] C. Y. Jiang, Y. P. Jing, A. Faltenbacher, W. P. Lin, and C. Li, 2008, ApJ, 675, 1095
- Kereš et al. [2009] D. Kereš, N. Katz, M. Fardal, R. Davé, and D. H. Weinberg, 2009, MNRAS, 395, 160
- Knollmann and Knebe [2009] S. R. Knollmann and A. Knebe, 2009, ApJS, 182, 608
- Lee et al. [2006] H. Lee, E. D. Skillman, E. D. Cannon, et al. 2006, ApJ, 647, 970
- Mastropietro et al. [2005] C. Mastropietro, B. Moore, L. Mayer, et al. 2005, MNRAS, 364, 607
- Neistein and Dekel [2008] E. Neistein and A. Dekel, 2008, MNRAS, 383, 615
- Papaderos et al. [2002] P. Papaderos, Y. I. Izotov, T. X. Thuan, et al. 2002, A&A, 393, 461
- Salvadori and Ferrara [2009] S. Salvadori and A. Ferrara, 2009, MNRAS, 395, L6
- Sollima et al. [2009] A. Sollima, M. Bellazzini, R. L. Smart, M. Correnti, E. Pancino, F. R. Ferraro, and D. Romano, 2009, MNRAS, 396, 2183
- Springel et al. [2005] V. Springel, S. D. M. White, A. Jenkins, et al. 2005, Nature, 435, 629
- Thoul and Weinberg [1996] A. A. Thoul and D. H. Weinberg, 1996, ApJ, 465, 608
- Thuan et al. [2011] T. X. Thuan, T. M. Yakobchuk, and Y. I. Izotov, 2011, ApJ, submitted
- Yang et al. [2009] X. Yang, H. J. Mo, and F. C. van den Bosch, 2009, ApJ, 695, 900