Seeding for pervasively overlapping communities
Abstract
In some social and biological networks, the majority of nodes belong to multiple communities. It has recently been shown that a number of the algorithms that are designed to detect overlapping communities do not perform well in such highly overlapping settings. Here, we consider one class of these algorithms, those which optimize a local fitness measure, typically by using a greedy heuristic to expand a seed into a community. We perform synthetic benchmarks which indicate that an appropriate seeding strategy becomes increasingly important as the extent of community overlap increases. We find that distinct cliques provide the best seeds. We find further support for this seeding strategy with benchmarks on a Facebook network and the yeast interactome.
pacs:
05.10.-a., 89.65.Ef, 87.15.km, 89.75.KdI Introduction
In social networks such as Facebook, users commonly belong to multiple communities that may correspond to family, school, and professional groups (Marlow et al., 2009). Similarly, in biological networks some proteins belong to multiple functional complexes (Sawardecker et al., 2009; Palla et al., 2005). Driven by these observations, many community assignment algorithms have been developed that are, in principle, capable of detecting overlapping communities.
Ahn et al. (2010) have recently pointed out that the extent of this overlap is often greater than previously assumed, to the point where the community structure may be described as pervasively overlapping, a condition in which nearly all nodes belong to multiple communities. As noted by Ahn et al., pervasive overlap violates one of the only commonly accepted properties of network communities, namely, that they contain more internal than external edges (Radicchi et al., 2004; Newman and Girvan, 2004; Lancichinetti et al., 2009; Clauset, 2005). As a result, some of the basic assumptions behind many of these overlapping community assignment algorithms are inappropriate.
In Lee et al. (2010), we benchmarked several of these algorithms and found that although they are designed to detect overlapping communities, they perform poorly on networks with pervasively overlapping communities. Our purpose here is to discover why a certain class of these algorithms perform poorly on such networks: those which optimize a local fitness measure, typically by using a greedy heuristic to expand a seed node or edge into a community (including Lancichinetti et al., 2009; Clauset, 2005; Baumes et al., 2005a; Bagrow, 2008; Mislove et al., 2010; Luo et al., 2008; Lee et al., 2010; Havemann et al., 2010). By expanding a set of seeds independently, either in serial or in parallel, the objective is to discover all communities in the network.
Using synthetic data, we demonstrate that in networks with pervasively overlapping communities, an appropriate seeding strategy is crucial, and that several proposed seeding strategies perform poorly. Our results, which are supported by benchmarks on empirical networks, indicate that the best strategy is to seed with distinct cliques.
II Background
In this section, we describe the core concepts and terminology of the local algorithms addressed by this paper: community fitness functions, greedy expansion, and community distance measures. We also describe some of the key points on which these algorithms differ. We neither fully specify these algorithms nor exhaustively list the differences between them—here we merely provide a basic understanding so that readers may see how all of these methods can benefit from an improved seeding strategy.
We begin with terminology. Given an undirected, unweighted graph , we define a community to be a set of vertices in . Two sets of edges are associated with each community: , the edges induced by , and , the set of all edges that have one end in and the other end in the complement of . We will find it useful to refer to the frontier of , which we define as the set of all nodes in that are adjacent to, but not included in, . In what follows, we assume the graph is connected and unweighted, and simple, although it is trivial to extend the following methods to the case of weighted or disconnected graphs.
A community fitness function assigns a real value to a community , where a community with a higher fitness value corresponds to a better defined community. For example, the fitness function used in the experiments of Baumes et al. (2005a) is defined as
| (1) |
which returns values between 0 and 1, with a trivial maximum when .
It will also be useful to be able to quantify the similarity of two communities. Along the lines of Baumes et al. (2005a), we define a community distance measure. We choose a symmetric measure of community distance that can be thought of as the percent non-embedded. Given two communities and , this measure is defined as
| (2) |
which can be interpreted as the proportion of the smaller community’s nodes that are not embedded in the larger community. We will refer to a community (or seed) that is within some distance of some other community (or seed) of equal or larger size as a near-duplicate of that community.
We now move on to the idea of greedy expansion. Given such a fitness function and a seed (which is typically a node or an edge) the seed will is expanded into a community, which we will refer to as the seed’s target community. We begin by initializing to be the seed. We then expand step-wise, one node at a time. At each expansion step, we decide which node to add to by looping over each node in the frontier of , and calculating how the fitness of would increase if were added to it. If no would increase the fitness of , then we terminate the expansion and return . Otherwise, we add to the that would most increase the fitness of , and proceed to the next expansion step.
While the fundamental strategy of many algorithms closely resembles the one that we have just presented, they differ on their seeding techniques (discussed in section III), the details of their expansion (some are not strictly greedy), their fitness functions, and their stopping criteria. For example, rather than adding only one node at a time, Luo et al. (2008)’s algorithm adds several nodes at each expansion step. Another variant on the greedy expansion is to alternate between expansion steps and contraction steps. The algorithms of Lancichinetti et al. (2009) and Luo et al. (2008) include such contraction steps, during which nodes whose removal from would result in increased fitness are purged from .
Additional differences between these fitness functions are largely due to a particular problem: the stopping criterion. As pointed out by others (Lancichinetti et al., 2009; Mislove et al., 2010), eq. 1 has the problem that as a community expands, the fitness function may never reach a local maximum until the entire graph is included in one big community. In other words, the local maximum of fitness does not serve as a good termination criterion.
In the present work we benchmark the performance of four of these expansion strategies, testing each with five seeding strategies. Our purpose here is to discover how the seeding strategies are affected by highly overlapping community structure. Because the focus here is on seeding strategies, we describe these in the next section in detail. Due to space constraints we will only briefly list the four expansion techniques benchmarked below are:
-
•
Greedy Clique Expansion (GCE) as in Lee et al. (2010), which essentially greedily optimizes the fitness function in eq. 1 with the addition of a resolution parameter, which we leave set at its default value of 1.0 for the experiments below. This technique is based on and very similar to Lancichinetti et al. (2009),
-
•
Local Modularity as in Clauset (2005),
-
•
Normalized Conductance, as in Mislove et al. (2010), and
-
•
Iterative Scan, which also uses the fitness function in eq. 1, although expands using “scans” rather than in a strictly greedy fashion.
We refer the reader to the original papers in which these methods were introduced for details.
III Seeding techniques
Much analysis of local methods neglects the problem of seeding altogether, treating seeds as user-provided parameters (Clauset, 2005; Bagrow, 2008; Luo et al., 2008). Other literature suggests seeding techniques that work for only a narrow range of situations, such as using search engine results for seeding communities of web pages (Andersen and Lang, 2006), or profile attributes (Mislove et al., 2010). However, it is often not possible to obtain such data, or such seeding may lead to communities of an undesired scale—for example, seeding with all nodes of a particular gender, dorm, or academic major may produce seeds that are larger than desired. We now list schemes that discover seeds from graph topology alone, and which we have implemented for our experiments in section IV. We note that all of the following techniques have been proposed specifically for detecting overlapping communities.
-
•
Random Seeding Lancichinetti et al. (2009). Take as a seed a random node from the graph that has not yet been assigned to any community. Expand that seed until that seed’s community has been found (by greedily optimizing the fitness function in eq. 1 to its first local maximum). Repeat this process until all nodes have been assigned to at least one community.
-
•
Rank Removal (RaRe and RaRe Core) Baumes et al. (2005a). Nodes are first ranked by some measure of importance; the authors suggest PageRank works best. The highest ranked nodes are then iteratively removed from the graph, and the graph begins to break into disconnected components. When the size of the largest component is smaller than some user-defined value (which we will call the “maximum core size”), one is left with cores. Cores below some minimum size are removed. Once the cores have been found, each of the removed vertices is added to any core to which it is connected. In our implementation we used all parameter settings as suggested in Baumes et al. (2005a) (including PageRank for ranking the nodes, the maximum core size set to fifteen, and the minimum core size to three). We also implemented a version where the removed nodes are not added back to the cores—we refer to this strategy as RaReCore.
-
•
Link Aggregate (LinkAgg) Baumes et al. (2005b). Like in RaRe, nodes are first ranked, typically using PageRank. Next a list of seeds is created, which is initially empty. In order of decreasing rank, each node is then assigned to every seed whose fitness it would increase. If a node is not assigned to any seed, it becomes a new seed and is appended on to the list of seeds.
-
•
Distinct Cliques Lee et al. (2010) Distinct cliques are the seeds used by the GCE algorithm described above. They are maximal cliques that are not within a given distance of any other maximal cliques of equal or greater size, where distance is as in eq. 2. That is, they are a set of the maximal cliques for which no near-duplicates exist. This seeding technique has two parameters, , which specifies the minimum clique size, and , which determines how similar to maximal cliques must be for them to be considered near duplicates. In our benchmarks, we set and unless otherwise noted. Furthermore, to speed up the removal of near duplicates, we use the CCH heuristic as suggested in Lee et al. (2010). This method is labeled as “DistinctC” in the figures.
-
•
Clique percolation. Palla et al. (2005) introduced the concept of clique percolation to find overlapping communities, and the method has become well known. In his comprehensive review article, Fortunato (2010) notes that the method has problems with leaf-nodes which are part of a community but not part of a large enough clique: “Another big problem is that on real networks there is a considerable fraction of vertices that are left out of the communities, like leaves. One could think of some post-processing procedure to include them in the communities, but for that it is necessary to introduce a new criterion, outside the framework that inspired the method.” The greedy expansion framework that we use to expand seeds here corresponds to the type of post-processing procedure suggested by Fortunato. Thus we test this suggestion, using k-clique communities as seeds. This seeding strategy includes one parameter, , which we set to four in the following benchmarks unless otherwise noted.
In all of the experiments below, after the seeds have been expanded we perform a post-processing step that removes near-duplicate communities. We compare all pairs of communities, and if a smaller community is a near duplicate of a larger community (as defined above, with ), we remove it. If two equally-sized communities are near-duplicates, we randomly remove one of them. For this reason, even when expansion techniques are seeded with the same method, they can detect differing numbers of communities, as we will see in the following section. Some expansion techniques expand several of its seeds into near duplicate communities, which are filtered out, while others expand them into distinct communities..
IV Experiment methodology and results
We now evaluate the performance of the seeding strategies described in section III. We begin by presenting the result of experiments on synthetic graphs, and then proceed to results on empirical data.
IV.1 Synthetic Benchmarks
An overview of our synthetic benchmark procedure is as follows: first, we create a synthetic graph which, by construction, contains communities planted in it. We will refer to these communities as the ground truth communities. Next, we run the algorithm on this graph and call the returned communities the found communities. Finally, we use some metric to compare the similarity of the ground truth communities to the found communities.
To construct synthetic graphs, we use the LFR specification of Lancichinetti and Fortunato (2009), which allows one to create graphs with realistic properties such as scale-free degree and community size distributions. Our purpose here is to evaluate how various seeding strategies perform on graphs with pervasively overlapping community structure. As such, we here specify a series of five LFR graphs which each contain 2000 nodes, but with increasing amounts of community overlap. In the first graph, communities are disjoint; in the second graph, each node belongs two communities, and so on, until in the fifth graph each node belongs to five communities. To allow each node to belong to an increasing number of communities, the degree of each node increases in each successive graph specification. In the first graph, the average degree is 18, in the second graph, the average degree doubles to 36, and so on, until in the fifth graph the average degree is 90. The other parameters remain the same over all five graph specifications: , , , , , , and .
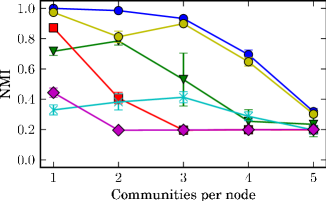
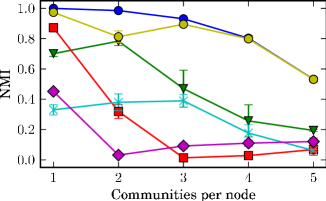
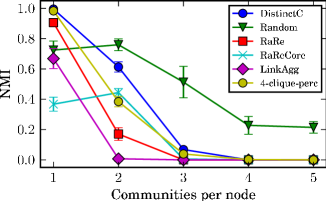
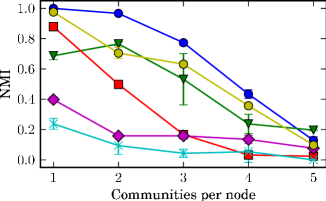
To measure the similarity of ground truth communities and found communities, we use normalized mutual information (NMI), an information-theoretic similarity measure. This measure is normalized such that the NMI of two sets of communities is 1 if they are identical, and 0 if they are totally independent of each other. Danon et al. (2005) first applied NMI to the problem of evaluating the similarity of two sets of communities, but defined the measure only for partitions. In our benchmarks, we employ a variant of NMI introduced by Lancichinetti et al. (2009) that is defined for covers, in which nodes may belong to multiple communities111For creating the LFR graphs and measuring overlapping NMI, we use the implementations provided by the authors, both of which are freely available at http://sites.google.com/site/andrealancichinetti/software..
The results in fig. 1 show that the distinct clique seeding strategy and the percolated-clique seeding strategy perform best in this benchmark. They can provide good results even when every node belongs to three or four communities. RaReCore and Link Aggregate are wholly unsuited to this kind of network, even when the community structure has no overlap.
Significantly, for three of the expansion methods, we see that performance depends more on the seeding strategy than on the expansion method. In contrast to the other three expansion methods, the clique-based seeding methods to not work well with Iterative Scan. We discuss the possible causes of these results in section V.
IV.2 Empirical benchmarks
Ideally, the empirical datasets would each come with a complete ground truth, just like the synthetic datasets. However, the empirical networks for which complete ground-truth data is known (such as Zachary’s Karate Club), are small networks that tend to have community structure which is easy to recover. We were able to find two larger networks that contain incomplete ground truths: Caltech’s Facebook network and the yeast interactome.
The Caltech data set consists of 769 nodes and 16656 edges. The data originates from a Facebook employee, and includes all Caltech Facebook users from June 2005 (excluding isolates) and the friendships between them. Seventy-eight percent of these users indicated to which residential house they belong. The paper in which this data set appeared, Traud et al. (2008), explains the significance of the residential housing system:
The undergraduate “House” system at Caltech, appearing in lieu of dormitory residence in our data, is modeled after the Oxbridge college system. Caltech’s Housing system impacts student life enormously, both socially and academically, and is even used by the university as one of its primary selling points in attracting new undergraduates. At the beginning of their first year at Caltech, undergraduate students choose one of the eight Houses and usually remain a member of it throughout their collegiate career.
Given this description, we expect any good community assignment algorithm to detect the residential houses as communities.
However, in addition to the houses, there may exist additional communities that correspond to, for example, study groups or sports teams. The collection of houses is therefore an incomplete ground truth, and a reasonable benchmark should not penalize an algorithm for detecting additional communities. The consequence is that while we are able to measure the sensitivity of the algorithms with respect to the partial ground truth, we cannot measure the specificity of the methods (i.e., we cannot distinguish false positives from true positives.) For this reason, we abandon NMI as our metric of similarity between the ground truth and found communities, and instead measure sensitivity to the ground truth communities by matching each ground truth community with its most similar counterpart in the set of found communities.
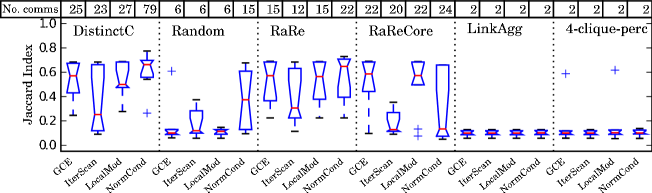
Specifically, our benchmarking procedure is as follows. We first run the community finding algorithm and are left with a set of found communities. We remove all nodes for which house data is unknown (22%) from both the found communities and the ground truth. For each house in the ground truth, we find the most similar found community, where similarity is measured using the Jaccard index. For each algorithm, we keep track of these maximum similarities and present their distribution in a boxplot in fig. 2. Although this evaluation does not return a number indicating the specificity of each method, we note that none of the algorithms “cheated” this shortcoming of the benchmark by simply finding a huge number of communities.
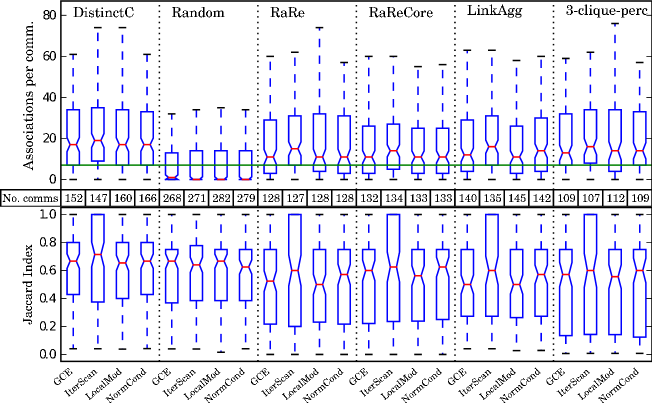
In the bottom row of boxplots in fig. 3, we display the results of a similar benchmark based on data from the yeast interactome. To construct this protein-protein interaction network, we used the Combined-AP/MS data, which contains 9070 interactions between 1622 proteins Collins et al. (2007). The protein complexes identified by Pu et al. (2009) in the CYC dataset provide an incomplete ground truth for this network. Both the yeast interactome and the protein complex dataset are publicly available 222Combined-AP/MS data available at http://interactome.dfci.harvard.edu/S_cerevisiae/; CYC protein complex dataset available at http://wodaklab.org/cyc2008/. This ground truth is peculiar in that it contains a large number of communities which contain either two or three nodes or that contain no edges whatsoever in the interactome data. The latter condition may be a result of the incompleteness of the protein-protein interaction network, which is a well-known problem. We decided that for any community detection algorithm to have a reasonable chance of detecting a protein complex based on the network alone, it must contain at least one triangle. After filtering out all ground truth complexes except those with at least one triangle, 126 remained. Because many protein complexes are small (and this would presumably be known by anyone using community finding algorithms to detect protein complexes), we set for both the distinct clique and clique percolation seeding schemes for this benchmark.
Unlike the Caltech dataset, the yeast interactome has been the focus of much research, allowing us to run a second benchmark which sheds some light on specificity. We use version 2.0 of FuncAssociate (introduced in Berriz et al. (2009)) to test whether the set of proteins that make up each community is more enriched in any Gene Ontology (GO) attributes than one would expect by chance. FuncAssociate corrects for multiple hypothesis testing using empirical resampling, and takes into account that our experiment selected from only those proteins contained in the Combined-AP/MS interactome.333Our purpose here is, given a community, to decide whether that community is significantly associated with any of several GO attributes. Because for each community we test several hypotheses, we have to correct for multiple hypothesis testing. If instead we were given a set of communities, and our goal were to say which communities in that set are associated with any of the several GO attributes, then we would also want to further correct for the extra level of multiple hypothesis testing. To produce each of the boxplots in the top row of fig. 3, we calculated the number of statistically significant GO attributes associated with each community, with .
To measure the specificity of each method, one needs some way of defining a false positive. One could argue that if a community is associated with zero or very few GO attributes, then it is more likely to be a false positive. Along these lines, we can make a couple of observations regarding sensitivity. Seeding with the random technique led to the detection of approximately twice as many communities as the other seeding techniques. We observe that although the random seeding had good sensitivity with regard to the ground truth, around half of the communities it found had no significant GO associations, meaning they are likely false positives. We can also observe that around 75% of the communities found by seeding with the clique-based seeding strategies (DistinctC and 3-clique-perc) had 7 or more significant GO associations (which corresponds to the green line). Because these methods produced relatively few communities with zero or very few GO associations, it can be argued that in this experiment they were the most specific seeding techniques.
Comparing the results of these empirical benchmarks to the results of the synthetic benchmarks reveals some interesting similarities and differences. The distinct clique seeding strategy, especially when used with either GCE or local modularity as the expansion technique, is the only seeding strategy that performs well both in the synthetic and empirical benchmarks. The clique percolation method performed well on the synthetic data, but performed especially poorly on the Caltech data set, whereas RaRe did well in the empirical benchmarks but performed particularly poorly in the synthetic benchmarks. One cause for the difference may be that while in the synthetic networks, each node belongs to up to five communities, in the empirical datasets used here, the community structure may not overlap so heavily.
V Discussion
V.1 Poor recall of Link Aggregate, RaRe, RaReCore, and Random
In the synthetic benchmarks the poor performing seeding schemes (Link Aggregate, RaRe, RaReCore, and Random) failed because of low sensitivity. As each of the five successive graphs contain more and more communities, these schemes produce fewer, rather than more, seeds.
RaRe works on the assumption that the high-ranking nodes (i.e., hubs) tend to be special in that they span multiple communities, while low ranking nodes belong to only one community. If that is true, then when one removes a relatively small proportion of high-ranking nodes, the graph should break up into many components, each of which corresponds to some community. However, if each node belongs to many overlapping communities (even the low ranking nodes), then so many nodes will need to be removed to break the network up into small disconnected components that few cores will remain. The small number of cores causes this seeding strategy have low sensitivity.
For a community to be seeded, the Link Aggregate method requires that at least one of that community’s nodes does not yet belong to any other community’s seed when it is iterated over. This requirement may, in graphs with pervasive overlap, lead to many unseeded communities. However, this method did not even work on synthetic graphs with disjoint community structure, pointing to more fundamental problems.
The random seeding strategy has a basic arbitrariness that causes trouble in graphs with pervasive overlap. Remember, the stopping criterion for selecting new random seeds is that each node must belong to at least one community. However, it would be just as valid (and arbitrary) if one seeded the graph until each node belongs to three communities. In graphs in which every node belongs to several communities, leaving this value set to one has the consequence that the random seeding prematurely terminates.
In general, RaRe, RaReCore, Link Aggregate, and the random seeding technique all place an upper bound on the number of seeds that can be detected, namely, . This upper bound could be problematic for networks with pervasive overlap, in which the number of communities can easily be much larger. Even if there are not more communities than nodes, if certain dense areas of the graph contain a relatively high number of communities, then this dense region may form a subgraph with more communities than nodes. These regions will not be sufficiently seeded by these methods.
We note in passing that in some networks, there might be many nodes that belong to no community whatsoever. In such cases, by forcing all nodes into communities, these methods (except for RaReCore) may have low specificity because they may detect seeds in regions where no communities exist. The yeast interactome, for example, contains many low degree nodes that may not belong to any community. Nevertheless, the random technique forces every node into at least one community, which may have led to the poor specificity observed on that network.
V.2 Critical threshold of clique percolation
Although the clique percolation method for detecting seeds worked well on the synthetic graphs, it performed especially poorly on the Caltech data. In the Caltech network, the parameter value of is low enough to above the critical value, at which the giant k-clique community emerges. This explains why only three seeds were detected, the first containing 673 nodes (or 88% of the graph), while the other two each contained four nodes. Similar results are obtained when takes the value 5-9—for these values, over half of the nodes in the network are contained in the largest seed. Using values of larger than 9 is problematic because it is not reasonable to assume that every community which we want to find contains at least one 10-clique. Thus no parameter value leads to acceptable results.
The results were better on the yeast interactome, partially because the two empirical networks have quite different clique densities. The Caltech network contains 31745 maximal cliques with four or more nodes (41.3/node), while the yeast interactome contains 4485 such clique (2.8/node). However, because we lowered the value of to three for the yeast interactome to improve clique percolation’s ability to pick up the small structures that are common for protein complex, there existed one seed that was much larger than all the others, containing 358 proteins. It seems that for a certain dense part of the graph, cliques percolated into a seed larger than desired.
The synthetic data is generated by embedding denser graphs into a less dense graph. Because this process (rather unrealistically) does not include any mechanism that leads to a high clustering coefficient, cliques in these graphs tend to be rare and not adjacent to each other when compared with empirical data. Thus, on these graphs the clique percolation method of seeding did not have the problem of no ideal value for .
V.3 Advantages of distinct cliques as seeds
Seeding with distinct cliques leads to higher specificity and sensitivity because while such cliques are rare in the graph in general, they are common in communities. The strategy should work well if one can select a value for such that: (1) it is likely that any clique of size is embedded in a community, and (2) nearly all communities that ought to be found contain at least one clique of size or larger.
While cliques are fundamental to both clique percolation and the distinct seeding strategy, the latter does not perform any percolation and so it does not suffer from the critical value problem.
VI Conclusion & Future Work
Our benchmarks indicate that seeding methods which work well for detecting disjoint or nearly disjoint community structure may perform poorly on networks in which communities pervasively overlap. Many of the methods proposed for detecting overlapping community structure rely on the implicit assumption that most nodes belong to one community—such methods put an arbitrary upper bound of on the number of possible seeds. This assumption is inappropriate for networks with pervasive overlap, and as a result these perform poorly in such networks.
We considered two clique-based approaches for detecting seeds that do not make such an assumption: distinct cliques and clique percolation. Clique percolation is problematic because if the value for is too low, then this method will detect one giant seed, whereas if it is too high, then any communities lacking cliques of size will not be seeded. Seeding with distinct cliques worked well in all of the benchmarks that we considered.
We have focused on seeding, which is just one aspect of local community detection. It is still unclear which local fitness function, expansion strategy, and termination criterion should be used. The seeding strategies described here may also be used in heuristics that optimize a global fitness function.
A more pressing matter, however, is benchmarking these algorithms. While Ahn et al. made good progress on this topic in order to demonstrate that their community finding algorithm works on empirical graphs, their benchmarking data and software is not publicly available. It is our opinion that before future work can make great progress on any of these topics, better empirical benchmarking techniques must be developed and made widely available.
VII Acknowledgments
This work is supported by Science Foundation Ireland under grant 08/SRC/I1407, Clique: Graph and Network Analysis Cluster. We thank Colm Ryan for his contribution to the experiments based on the yeast interactome.
References
- Marlow et al. (2009) C. Marlow, L. Byron, T. Lento, and I. Rosenn, “Maintained relationships on facebook,” (2009).
- Sawardecker et al. (2009) E. Sawardecker, M. Sales-Pardo, and L. Amaral, Euro. Phys. Journ. B 67, 277 (2009).
- Palla et al. (2005) G. Palla, I. Derenyi, I. Farkas, and T. Vicsek, Nature 435, 814 (2005).
- Ahn et al. (2010) Y.-Y. Ahn, J. P. Bagrow, and S. Lehmann, Nature advance on (2010), 10.1038/nature09182.
- Radicchi et al. (2004) F. Radicchi, C. Castellano, F. Cecconi, V. Loreto, and D. Parisi, Proc. Natl. Acad. Sci. USA 101, 2658 (2004).
- Newman and Girvan (2004) M.E.J. Newman and M. Girvan, Phys. Rev. E 69, 026113 (2004).
- Lancichinetti et al. (2009) A. Lancichinetti, S. Fortunato, and J. Kertesz, New Journal of Physics 11, 033015 (2009) (2009).
- Clauset (2005) A. Clauset, Phys. Rev. E 72, 26132 (2005).
- Lee et al. (2010) C. Lee, F. Reid, A. McDaid, and N. Hurley, in SNA-KDD 2010 (ACM, Washington, DC, 2010) pp. 33–42.
- Baumes et al. (2005a) J. Baumes, M. Goldberg, M. Krishnamoorthy, M. Magdon-Ismail, and N. Preston, in International Conference on Applied Computing (IADIS 2005) (2005).
- Bagrow (2008) J. P. Bagrow, Journal of Statistical Mechanics: Theory and Experiment 2008, P05001 (2008).
- Mislove et al. (2010) A. Mislove, B. Viswanath, K. P. Gummadi, and P. Druschel, in Web Search and Web Data Mining (2010) pp. 251–260.
- Luo et al. (2008) F. Luo, J. Z. Wang, and E. Promislow, Web Intelligence & Agent Systems 6, 387 (2008).
- Havemann et al. (2010) F. Havemann, M. Heinz, A. Struck, and J. Gläser, Arxiv preprint arXiv:1008.1004 (2010).
- Andersen and Lang (2006) R. Andersen and K. J. Lang, in International World Wide Web Conference (2006) p. 223.
- Baumes et al. (2005b) J. Baumes, M. Goldberg, and M. Magdon-Ismail, in IEEE International Conference on Intelligence and Security Informatics (ISI) (Springer, 2005) pp. 27–36.
- Fortunato (2010) S. Fortunato, Physics Reports 486, 75 (2010).
- Lancichinetti and Fortunato (2009) A. Lancichinetti and S. Fortunato, Phys. Rev. E 80, 16118 (2009).
- Danon et al. (2005) L. Danon, A. D. Guilera, J. Duch, and A. Arenas, Journal of Statistical Mechanics: Theory and Experiment 2005, P09008 (2005).
- Not (a) To create the LFR graphs and measure overlapping NMI, we use the implementations provided by the authors, both of which are freely available at http://sites.google.com/site/andrealancichinetti/software.
- Traud et al. (2008) A. Traud, E. Kelsic, P. Mucha, and M. Porter, Arxiv preprint arXiv:0809.0690 (2008).
- Collins et al. (2007) S. R. Collins, P. Kemmeren, and et al., Molecular & cellular proteomics : MCP 6, 439 (2007).
- Pu et al. (2009) S. Pu, J. Wong, B. Turner, E. Cho, and S. Wodak, Nucleic Acids Research 37, 825 (2009).
- Not (b) The combined-AP/MS data is available at http://interactome.dfci.harvard.edu/S_cerevisiae/; the CYC protein complex dataset is available at http://wodaklab.org/cyc2008/.
- Berriz et al. (2009) G. F. Berriz, J. E. Beaver, C. Cenik, M. Tasan, and F. P. Roth, Bioinformatics (Oxford, England) 25, 3043 (2009).
- Not (c) Our purpose here is, given a community, decide whether that community is significantly associated with any of several GO attributes. Because for each community we test several hypotheses, we have to correct for multiple hypothesis testing. If instead we were given a set of communities, and our goal were to say which communities in that set are associated with any of the several GO attributes, then we would also want to further correct for the extra level of multiple hypothesis testing.