Core-shift and precession in the jet of LS I +61∘303
Abstract
LS I +61∘303 is one of the few GeV- and TeV-emitting X-ray binaries with a prominent, well-studied modulated radio and gamma-ray emission. Changes in its radio morphology suggested in the past the hypothesis of a precessing microquasar. In 2006, a set of VLBA observations performed all around the orbit and confirming the fast variation in morphology were not used to study the precession because the souce was explained in the context of the pulsar model, the alternative model for this system. However, a recent radio spectral index analysis over 6.7 years from Green Bank Interferometer data at 2.2 GHz and 8.3 GHz has well confirmed the predictions of the microquasar scenario in LS I +61∘303. At the light of these results we reanalysed the set of VLBA observations that constitutes a unique tool to determine the precession period and render a better understanding of the physical mechanism behind the precession. We improved the dynamic range of the images by a factor of four using self-calibration, and the self-calibrated maps reveal, in six out of ten images, a double-sided structure. The double-sided structure has variable position angle and switches at some epochs to a one-sided structure. These variations indicate a scenario where the precessing jet, inducing variable Doppler boosting, points close to our line of sight - a microblazar, the galactic version of the extra-galactic blazars. High energy observations of LS I +61∘303 are consistent with the microblazar nature of this object. Moreover, we suggest in LS I +61∘303 the first case of core shift effect observed in a microquasar. Because of this effect, well known in AGN, the cm-core of the jet is rather displaced from the system center. In LS I +61∘303, the cm-core of the jet traces a large ellipse, 7 times larger than the orbit, in a period of about 28 d. Our hypothesis is that this ellipse is the cross-section of the precession cone of the jet at the distance of the 3.6 cm-core, and its period is the precession period.
I Introduction
LS I +61∘303 is a high-mass X-ray binary (HMXB) where the compact object travels through the dense equatorial wind of a rapidly rotating B0 Ve star. The nature of the compact object is still unknown due to its large mass range, 1.4 , which implies either a neutron star or a black hole.
Two models have been proposed for this special HMXB, a strong and variable source at all wavelenghts of the electromagnetic spectrum, from radio to TeV. One model assumes that the compact object is a non-accreting young pulsar whose relativistic wind strongly interacts with the wind of the Be star. The second model instead proposes a microquasar, that is, an accreting object whose steady jet, perpendicular to the accretion disk, is occasionally travelled by shocks associated to transients. The peculiarity of LS I +61∘303 is that, due to the eccentricity of the system, two episodes of a large mass accretion rate may occur along the orbit and consequently two transients may occur per orbital period (26.496 d) (see references in [1]).
In 1993, VLBI observations of LS I +61∘303 showed that the radio emission had a structure of milliarcsecond (mas) size corresponding to a few AU at the distance of 2.0 kpc Massi et al. (1993). However, the complex morphology in successive VLBI observations Peracaula et al. (1998); Paredes et al. (1998); Taylor et al. (2000); Massi et al. (2001, 2004) made an interpretation in terms of a collimated ejection with a constant position angle difficult. The radio morphology not only changes position angle, but sometimes it is even one-sided while at other times two-sided. This fact suggested the hypothesis of LS I +61∘303 being a precessing microblazar (Massi et al., 2004).
A microblazar should be the galactic version of the extragalactic blazars, i.e., AGN with radio jets forming a small angle, , with respect to the observer’s line of sight. Doppler boosting enhances the radiation from material that is moving towards the observer, and attenuates it, if it moves in the opposite direction. For remarkable flux attenuation of the receding jet (i.e., attenuated to a level under the sensitivity of radio images) the structure will appear as a one-sided jet. A precession of the jet implies a variation of the angle and therefore variable Doppler boosting. The result is both, a continuous variation of the position angle of the radio emitting structure and of the flux density ratio between approaching and receding jet (Massi, 2007).
In known precessing X-ray binaries, the timescale for tidally forced precession of the accretion disk around the compact object, induced by the companion star, lies within the range times the orbital period (Larwood, 1998; Massi & Zimmermann, 2010). In this context, the peculiarity of the variations of LS I +61∘303 is their short timescale with respect to the predicted (822) d. In fact, MERLIN images revealed a surprising variation of 60∘ in position angle in only one day (Massi et al., 2004). Even if quantitatively the relationship between position angle in the image and the viewing angle is not straightforward, a fast variation in position angle implies nevertheless clearly a fast variation in . The fast position angle variation measured with MERLIN was confirmed by VLBA observations (Dhawan et al., 2006) measuring in VLBA images a rotation of the inner structure of roughly 5∘7∘ in 2.5 hrs, that is again almost 60∘/day. In that work some one-sided structures were taken as evidence for the cometary tail of the pulsar model. If the compact object is a pulsar, the interaction between its relativistic wind and the equatorial wind of the Be star is predicted to create a bow-shock around the pulsar with a sort of cometary tail, i.e., a one-sided structure, extending away from the Be star (Dubus, 2006).
However, recent analysis of the radio spectral index over 6.7 years from Green Bank Interferometer data at 2.2 GHz and 8.3 GHz discovered new characteristics in the radio emission of LS I +61∘303 Massi & Kaufman Bernadó (2009). This analysis has proven that in LS I +61∘303 occurs the typical characteristic of microquasars of an optically thin outburst after an interval of optically thick emission. In microquasars, the so called transient jet, associated to the large optically thin outburst, is related to shocks travelling in a pre-existing steady jet, that is a slow moving continuous conical outflow with a composite flat/inverted radio spectrum (i.e., optically thick emission) (Fender et al., 2004; Massi, 2011). The remarkable fact in LS I +61∘303 is that, during the maximum of the long-term radio periodicity (4.6 yr) present in this source, the alternance, optically thick/thin emission, occurs twice along the orbit, first around periastron and then again, shifted almost 0.30.4 in orbital phase towards apastron (i.e, (0.30.4) 26.496 d = (811) d after periastron) (Massi & Kaufman Bernadó, 2009). This agrees qualitatively and quantitatively with the well known “two peak accretion/ejection model”, applied by several authors in LS I +61∘303, predicting for large mass accretion rate, , two events: one event around periastron and the second one shifted about 0.3 in orbital phase towards apastron (Taylor et al., 1992; Marti & Paredes, 1995; boschramon06, ; Romero et al., 2007).
As a matter of fact, the radio spectral index data corroborate the microquasar model for LS I +61∘303. Then, the open issue is what would produce the observed fast precession. The basis for such a study is to establish the precessional period. This important parameter could be derived by the re-analysis of the VLBA observations performed every 3 days over 30 consecutive days, towards the minimum of the long-term radio periodicity (Dhawan et al., 2006). We present here preliminary results of our analysis (Massi et al., 2012).
II Results
II.1 Images: the fast changing structure from a double-sided morphology to a one-sided morphology
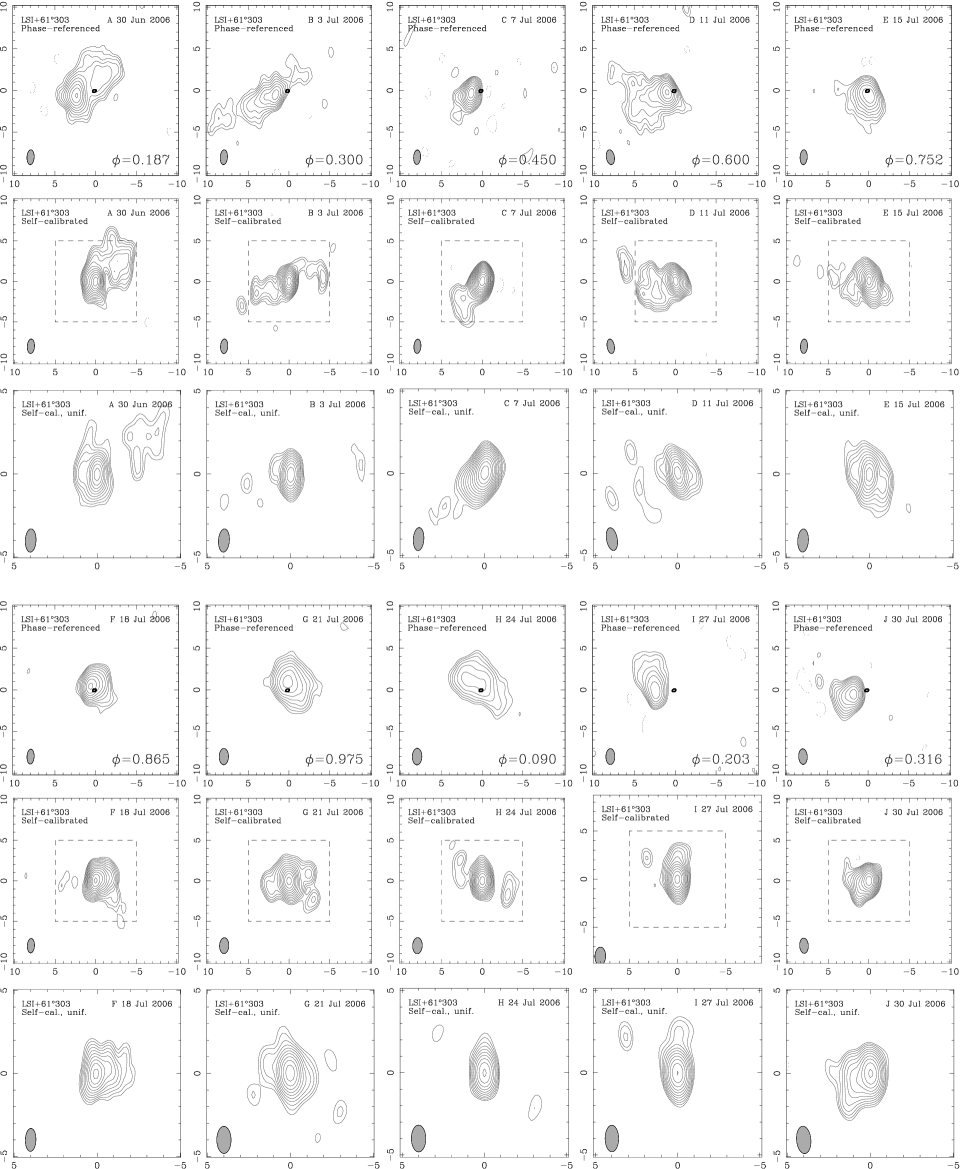
The 8.4 GHz phase-referenced images (with respect to J02446228) shown in Fig. 1-Top, well reproduce the structures in (Dhawan et al., 2006). At their center, we show the orbit with semimajor axis of mas ( cm at a distance of 2 kpc), derived from Kepler’s 3rd law for d with a mass for the B0 star of 17 and a mass of the compact object of , and traced using the orbital parameters from (Casares et al., 2005). The orbit is not only much smaller than the radio emitting region, but also less than the interferometric beam of the VLBA at this wavelength. We remark this, because the zoomed orbit in Fig. 3 of (Dhawan et al., 2006) (zoomed to better show the orbital phase of each run) may unfortunately produce the wrong impression that the orbit is resolved whereas it is not.
For each run are presented, in Fig. 1, along with the phase-referenced ones also the self-calibrated images with natural and uniform weights respectively. The self-calibrated images were produced with the automatic procedure Muppet of the Caltech Difmap imaging package (Shepherd, 1997). Using self-calibration, the information on absolute flux density and absolute position are lost, but the removal of residual calibration errors improves the dynamic range up to a factor of 4 for our maps. The higher dynamic range of the self-calibrated maps show in the image of run A a double component structure. The double structure in run A is clearly unlikely for a pulsar nebula, whereas it could be compatible with either the approaching and receding component of a transient jet, or with variable Doppler boosting along a one-sided twisted jet. Image B shows already in the phase referenced map with natural weighting a double-sided morphology difficult to conciliate with the pulsar nebula. The self-calibrated map shows an intriguing twisted jet as expected for a fast precession. Runs C, F, I, and J show a one-sided jet or alternatively a pulsar cometary-tail but again runs D, E, G, and H show the double-sided jet structure.
II.2 Astrometry: all points form one ellipse
The peak position in the phase-referenced maps are plotted in Fig. 2-Bottom. It is evident that the peaks trace well an ellipse 67 times larger than the orbit. Our hypothesis is that this ellipse is the cross-section of the precession cone, at the distance of the 3.6 cm-core ( GHz) of the steady jet.
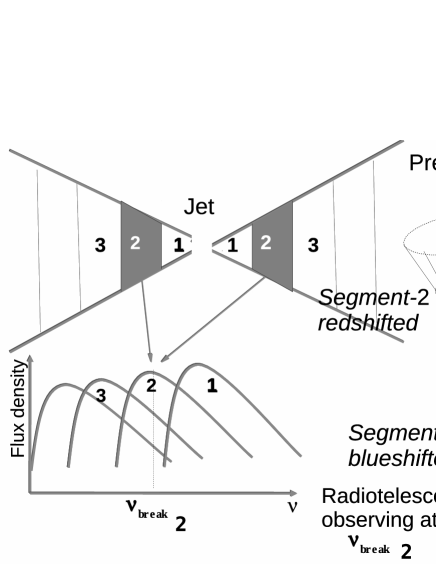
In fact, changes in the electron energy distribution and the decay of the magnetic field along the conical outflow forming the steady jet, imply that the critical frequency, , of the synchrotron spectrum varies along the jet (Marscher, 1995; Massi, 2011). In microquasars, the for the part of the steady jet closest to the engine (i.e., in Fig. 2) lies in the infrared (Russell et al., 2006), whereas in AGN the observed turnover lies in the millimeter range (Marscher, 1995). Observing at longer wavelengths than infrared, i.e., in the radio band, gives rise to two results: a flat spectrum and the “core shift”. Multi-wavelength observations result in fact in the flat/inverted spectrum discussed in the introduction, typical for a steady jet. Imaging a steady jet at one observing frequency , gives rise to the effect known as “core shift”(Lobanov, 1998), with the displacement from the center as a function of the observing frequency . At the emission of the segment will dominate, whose spectrum peaks at that frequency plus small contributions from neighboring segments (see Fig. 1 in (Markoff, 2010)). With the engine being close to the “infrared-core”, it is clear that the 3.6 cm-core can be rather displaced from the center (like segment 2 is displaced with respect to the center in Fig. 2 Top-Left) (Marscher, 1995; Massi, 2011; Lobanov, 1998). If a jet is pointing towards us (i.e., a microblazar as in Fig. 2 Top-Right) the core will be dominated by the approaching jet, because of Doppler boosting. If the jet is precessing, then the core will describe an ellipse (see both ellipses, the observed ellipse in Fig. 2-Bottom and the predicted ellipse for the blueshifted segment-2 in Fig. 2 Top-Right). A transient jet, on the contrary, can have any shift from the center, depending on the velocity and the time elapsed from the transient. The peak of map E, even if displaced from the other ones, and therefore likely affected by the approaching component of the transient jet, is at a position angle which is consistent with the other peaks.
Note as after 27 d, the peak of run I is rather close to completing the cycle, i.e. to overlap with the peak of the starting run A. The same occurs for peak of run J, that 27 d after run B, nearly overlaps with peak B. The peak of run J, 30 d after run A, is clearly rather displaced from the A peak. The period seems therefore to be in the range (2728) d.

III Conclusions and Discussion
LS I +61∘303 is one of the few established massive X-ray binaries that emit in the high and very high energy range. It is formed by a compact object of unknown nature (black hole or neutron star) travelling with a period of 26.496 d around a Be star. Two models have been proposed in the past: a millisecond pulsar and a microquasar model. Recent analysis of the radio spectral index has proven in LS I +61∘303 the typical characteristic of microquasars of an optically thin outburst after an interval of optically thick emission twice along the orbit, as predicted by the two peak microquasar model.
The results of our re-analysis of VLBA observations of LS I +61∘303 presented here are that the radio emission has in several images a double-sided structure (see. Fig. 1). The astrometry show that the peaks of the images trace a well defined ellipse in (2728) d (see Fig. 2). The pulsar model explains neither the double-sided morphology nor the observed change from double sided to a one-sided structure. The microquasar model can explain them with variable Doppler boosting, i.e., with a precessing jet. The cm-core of a precessing steady jet pointing close to our line of sight, as in a microblazar, is expected to describe an ellipse during the precession. During the transient jet phase there will be an additional shift due to the approaching jet component. We conclude therefore that the precession period is the time of (2728) d necessary to complete the ellipse.
A precession period of (2728) d for the accretion disk in LS I +61∘303 induced by tidal forces of the Be star (Massi & Zimmermann, 2010) would require the unrealistic value for the size of the accretion disk of cm, i.e., nearly the semi-major axis, and can therefore be ruled out. On the contrary, for a slow rotating compact object, a precession period of 28 d induced by Lense-Thirring effect (i.e., frame dragging produced by the rotation of the compact object) could be compatible Massi & Zimmermann (2010).
High energy observations of LS I +61∘303 are consistent with the microblazar nature of this object. Simultaneous X-ray and VHE observations during an outburst of LS I +61∘303 resulted in a correlation, indicating a simultaneity in the emission processes (Anderhub & al., 2009). In particular, with respect to the comparison with blazars, it has been noticed (Massi & Zimmermann, 2010) as the two fluxes result in with in agreement with the correlation observed in blazars (Katarzyǹski & Walczewska, 2010). In addition, the respective values of the photon indices seem to be comparable. During a bright flaring event of the blazar 1ES 2344+514, VERITAS measured a photon index of 0.22, whereas for the X-ray emission, RXTE and Swift-XRT measured a hard photon index of 1.9 (Acciari et al., 2011). For LS I +61∘303: MAGIC had a and the X-ray emission detected by XMM-Newton and Swift-XRT a harder photon index of 1.5-1.8 (Anderhub & al., 2009). In blazars the X-ray emission is due to synchrotron, and VHE is synchrotron self-Compton (SSC) (Katarzyński et al., 2005). As discussed in (Zimmermann & Massi, 1012), several authors have in fact explained the X-ray excess around apastron in LS I +61∘303 with synchrotron and the VHE with either external inverse Compton (EIC) or SSC emission (Gupta & Boettcher, 2006; Zabalza et al., 2011). In particular, the X-ray/VHE correlation in LS I +61∘303 (Anderhub & al., 2009) is compatible with a one zone leptonic particle population producing the emission (Anderhub & al., 2009; Zabalza et al., 2011). Concerning high energy emission in the GeV range, detected e.g., with Fermi-LAT, GeV emission is seen all along the orbit. In fact, electrons from the steady jet can always upscatter stellar UV photons to GeV energies (i.e., EIC see (boschramon06, )). Nevertheless, more energetic particles from the transient jet could in addition also produce GeV emission via EIC and SSC. Intriguingly, the spectrum measured by Fermi-LAT shows, in addition to a power law with a cut-off around 6 GeV, upper limits possibly compatible with the spectrum measured with MAGIC and VERITAS (see e.g., Figs. 2 and 3 in (Hadasch, 2011) and discussion in (Zimmermann & Massi, 1012)). As a matter of fact, there is an interesting increase in the overall flux level observed with Fermi-LAT after March 2009 together with a broadening of the peak shape (Hadasch, 2011). The up to now observed Fermi-LAT variations are therefore consistent with a long term variation. Similarly, strong variations are observed at very high energies. With VERITAS the source went from being detected around apastron to becoming quiescent between 2008 and 2010 (Acciari et al., 2011). With respect to the long-term, 4.6 yr, radio periodicity mentioned in Sect. 1, the insufficient temporal coverage at high energy, evident in Fig. 1 of (Zimmermann & Massi, 1012), does not allow at the moment a more closer comparison. However, a different trend with respect to the 4.6 yr radio periodicity is expected. In fact, the high energy emission is indeed related to the steady jet but its peak seems to occur during the transient jet and not during the steady one (Fig. 4 in (Massi, 2011)). As a matter of fact the steady jet, related to the radio periodicity, is not always followed by the transient one. A timing analysis of the transient jet is in progress.
References
- Massi & Kaufman Bernadó (2009) Massi, M., & Kaufman Bernadó, M., “Radio Spectral Index Analysis and Classes of Ejection in LS I +61∘303”, 2009, ApJ, 702, 1179
- Massi et al. (1993) Massi, M., Paredes, J.M., Estalella, R., & Felli, M., “High resolution radio map of the X-ray binary LS I +61∘303”, 1993, A&A, 269, 249
- Massi et al. (2001) Massi, M., Ribó, M., Paredes, J. M., Peracaula, M., & Estalella, R., “One-Sided Elongated Feature in LS I +61∘303”, 2001, A&A, 376, 217
- Massi et al. (2004) Massi, M., Ribó, M, Paredes, J. M., et al., “Hints for a fast precessing relativistic radio jet in LS I +61∘303”, 2004, A&A, 414, L1
- Peracaula et al. (1998) Peracaula, M., Gabuzda, D. C., & Taylor, A. R., “Rapid expansion in the VLBI structure of LS I +61∘303”, 1998, A&A, 330, 612
- Paredes et al. (1998) Paredes, J. M., Massi, M., Estalella, R., & Peracaula, M., “Milliarcsecond radio structure of LS I +61∘303”, 1998, A&A, 335, 539
- Taylor et al. (2000) Taylor, A.R., Dougherty, S.M., Scott, W.K., Peracaula, M., & Paredes, J.M., “VSOP Imaging of the Unusual X-Ray Binary Star”, 2000, Proc. of Astrophysical Phenomena Revealed by Space VLBI, eds. H. Hirabayashi, P.G. Edwards, and D.W. Murphy., p. 223
- Massi (2007) Massi, M., “The Enigmatic Compact Object in the Stellar System LS I +61∘303: Accreting or Not Accreting?”, 2007, The Multicolored Landscape of Compact Objects and Their Explosive Origins, 924, 729
- Larwood (1998) Larwood, J., “On the precession of accretion discs in X-ray binaries”, 1998, MNRAS, 299, L32
- Massi & Zimmermann (2010) Massi, M., & Zimmermann, L., “Feasibility study of Lense-Thirring precession in LS I +61∘303”, 2010, A&A, 515, A82
- Dhawan et al. (2006) Dhawan, V., Mioduszewski, A., & Rupen, M., “LS I +61∘303 is a Be-Pulsar binary, not a Microquasar”, 2006, Proceedings of the VI Microquasar Workshop, p. 52.1
- Dubus (2006) Dubus, G., “Gamma-ray binaries: pulsars in disguise?”, 2006, A&A, 456, 801
- Fender et al. (2004) Fender, R. P., Belloni, T. M., & Gallo, E., “Towards a unified model for black hole X-ray binary jets”, 2004, MNRAS, 355, 1105
- Massi (2011) Massi, M. “Steady jets and transient jets: observational characteristics and models”, 2011, Mem. Soc. Astron. It., 82, 24
- (15) Bosch-Ramon, V., Paredes, J. M., Romero, G. E., & Ribó, M., “The radio to TeV orbital variability of the microquasar LS I +61∘303”, 2006, A&A, 459, L25
- Marti & Paredes (1995) Marti, J., & Paredes, J. M., “Modelling of LS I +61∘303 from near infrared data”, 1995, A&A, 298, 151
- Romero et al. (2007) Romero, G. E., Okazaki, A. T., Orellana, M., & Owocki, S. P., “Accretion vs. colliding wind models for the gamma-ray binary LS I +61∘303: an assessment”, 2007, A&A, 474, 15
- Taylor et al. (1992) Taylor, A. R., Kenny, H. T., Spencer, R. E., & Tzioumis, A., “VLBI observations of the X-ray binary LS I +61∘303”, 1992, ApJ, 395, 268
- Massi et al. (2012) Massi, M., Ros, E., & Zimmermann, L., “VLBA images of the precessing jet of LS I +61∘303”, 2012 A&A, 540, A142
- Casares et al. (2005) Casares, J., Ribas, I., Paredes, J. M., Martí, J., & Allende Prieto, C., “Orbital parameters of the microquasar LS I +61∘303”, 2005, MNRAS, 360, 1105
- Shepherd (1997) Shepherd, M. C., “Difmap: an Interactive Program for Synthesis Imaging”, 1997, Astronomical Data Analysis Software and Systems VI, A.S.P. Conference Series Gareth Hunt and H. E. Payne, eds., 125, 77
- Marscher (1995) Marscher, A. P., ‘Probes of the Inner Jets of Blazars”, 1995, Proceedings of the National Academy of Science, 92, 11439
- Russell et al. (2006) Russell, D. M., Fender, R. P., Hynes, R. I., Brocksopp, C., Homan, J., Jonker, P. G., & Buxton, M. M., “Global optical/infrared-X-ray correlations in X-ray binaries: quantifying disc and jet contributions”, 2006, MNRAS, 371, 1334
- Markoff (2010) Markoff, S., “From Multiwavelength to Mass Scaling: Accretion and Ejection in Microquasars and AGN”, 2010, Lecture Notes in Physics, Berlin Springer Verlag, 794, p.143
- Lobanov (1998) Lobanov, A. P., “Ultracompact jets in active galactic nuclei”, 1998, A&A, 330, 79
- Anderhub & al. (2009) Anderhub, H., et al., “Correlated X-Ray and Very High Energy Emission in the Gamma-Ray Binary LS I +61∘303”, 2009, ApJ, 706, L27
- Katarzyǹski & Walczewska (2010) Katarzyǹski, K., Walczewska, K., “On the correlation between the X-ray and gamma-ray emission in TeV blazars”, 2010, A&A, 510, A63
- Acciari et al. (2011) Acciari, V. A., Aliu, E., Arlen, T., et al., “Multiwavelength Observations of the Very High Energy Blazar 1ES 2344+514”, 2011, ApJ, 738, 169
- Katarzyński et al. (2005) Katarzyński, K., et al., “Correlation between the TeV and X-ray emission in high-energy peaked BL Lac objects”, 2005, A&A, 433, 479
- Zimmermann & Massi (1012) Zimmermann, L. & Massi, M., “Implications of the radio spectral index transition in LS I +61∘303 for its INTEGRAL data analysis”, 2012, A&A, 537, A82
- Gupta & Boettcher (2006) Gupta, S. & Boettcher, M., “A Time-dependent Leptonic Model for Microquasar Jets: Application to LS I +61∘303”, 2006, ApJ, 650, L123
- Zabalza et al. (2011) Zabalza, V., Paredes, J. M., & Bosch-Ramon, V., “On the origin of correlated X-ray/VHE emission from LS I +61∘303”, 2011, A&A, 527, A9
- Hadasch (2011) Hadasch, D., & for the Fermi-LAT collaboration, “Results from the binaries LS I +61∘303 and LS 5039 after 2.5 years of Fermi monitoring”, Fermi Symposium proceedings-eConf C110509, ed. Morselli, 2011, [arXiv:1111.0350]
- Acciari et al. (2011) Acciari, V. A., Aliu, E., Arlen, T., et al., “VERITAS Observations of the TeV Binary LS I +61∘303 During 2008-2010”, 2011, ApJ, 738, 3
- Massi (2011) Massi, M., “The two-peak model of LS I +61303: radio spectral index analysis”, 2011, Mem. Soc. Astron. It., 82, 77