Phase stacking diagram of colloidal mixtures under gravity
Abstract
The observation of stacks of distinct layers in a colloidal or liquid mixture in sedimentation-diffusion equilibrium is a striking consequence of bulk phase separation. Drawing quantitative conclusions about the phase diagram is, however, very delicate. Here we introduce the Legendre transform of the chemical potential representation of the bulk phase diagram to obtain a unique stacking diagram of all possible stacks under gravity. Simple bulk phase diagrams generically lead to complex stacking diagrams. We apply the theory to a binary hard core platelet mixture with only two-phase bulk coexistence, and find that the stacking diagram contains six types of stacks with up to four distinct layers. These results can be tested experimentally in colloidal platelet mixtures. In general, an extended Gibbs phase rule determines the maximum number of sedimented layers to be , where is the number of binodals and is the number of their inflection points.
Adding a second component to a colloidal dispersion generates a wealth of new phenomena, such as the induction of effective interactions of the primary colloidal component by adding a depletion agent tuinier2003depletion , the formation of complex ionic colloidal crystals by adding an oppositely charged component leunissen2005ionic , and the self-assembly of patchy colloidal mixtures into two interpenetrating networks C1SM06948A ; varrato2012arrested . Binary colloidal crystals are promising candidates for e.g. photonic applications vermolen . Gravity can have a strong effect on colloidal mixtures because on typical length scales in the lab the gravitational energy and the thermal energy are comparable. The resulting observations are often very counter-intuitive, including denser particles floating on top of a fluid of lighter colloidal spheres C2SM26120K , or the emergence of a floating nematic phase sandwiched between two isotropic phases in mixtures of colloidal platelets and spheres floating . The number of distinct layers in a sample in sedimentation-diffusion equilibrium can be considerably large: e.g. a vertical stack of six different phases was observed in mixtures containing charged colloidal platelets doi:10.1021/la804023b . Much attention was devoted to sedimentation in charged colloidal systems Philipse . Although the investigation of the bulk phase behaviour of colloidal mixtures is often based on sedimentation experiments C1SM06535A , the interpretation of the experimental findings, and in particular drawing quantitative conclusions about the bulk phase diagram, can be a very subtle issue. Understanding and controlling the stacking sequence of colloidal mixtures is of potential interest in industrial applications, such as preventing phase separation in commercial colloidal products and inducing demixing in order to sort colloidal particles by size or density serrano . In molecular rather than colloidal mixtures corresponding effects due to gravity arise on larger length scales, as e.g. relevant for species segregation with depth in oil reservoirs Debenedetti1988 ; EspositoEtAl2000 .
Here we show for the first time that the phenomenology of all possible stacking sequences of a colloidal or liquid mixture is directly related to the bulk phase diagram of the system, without requiring further information about the equation of state. A systematic stacking diagram follows from the bulk phase diagram by Legendre transform in a unique way. Here the Legendre transform acts on the features of the bulk phase diagram, such as the binodal(s), critical point(s) etc., rather than on the thermodynamic potential(s). The Legendre transform introduces the ratio of the buoyant masses as a control parameter. In experiments this could be varied by e.g. changing the solvent of a colloidal mixture. We apply the theory to predict the stacking diagram of a mixture of colloidal platelets, using density functional theory to first obtain the bulk phase diagram. The mixture models a binary smectite-gibbsite platelet system, and hence the results can be tested experimentally.
I Theory
We base our theory on the chemical potential as the central quantity. In the presence of gravity, one can define a height- and species-dependent local chemical potential hansen06 ; schmidt04aog ; floating :
| (1) |
where is the vertical coordinate, is the chemical potential of species , is its buoyant mass and is the acceleration due to gravity. Eq. (1) immediately implies that the difference in the local chemical potential between two different heights is experimentally accessible by measuring the difference in height between the two points. Eliminating from (1) yields
| (2) |
where the constants are and . Eq. (2) describes a straight line in the plane of local chemical potentials . The slope of this “sedimentation path” is given by the ratio of the buoyant masses or, equivalently, by the inverse ratio of the gravitational heights, , where is the gravitational height of species ; here is the Boltzmann constant and is absolute temperature.
Eq. (2) attains great significance when combined with a local density approximation (LDA) hansen06 , which applies when all relevant correlation lengths in the system are small compared to all ; this is analogous to dividing the system in small horizontal slabs, which are treated as individual equilibrium systems Debenedetti1988 ; EspositoEtAl2000 . Then one can assume that the state of the system at height is analogous to a bulk state with chemical potentials and that
| (3) |
As a consequence, the sedimentation path (2) is directly related to the experimentally observed stacking sequence in the vessel schmidt04aog ; floating . Local phase coexistence between A and B occurs at height , provided that for both species; here is the chemical potential of species at bulk coexistence between phases A and B. As a result a (horizontal) AB interface at height is observed in the sample.
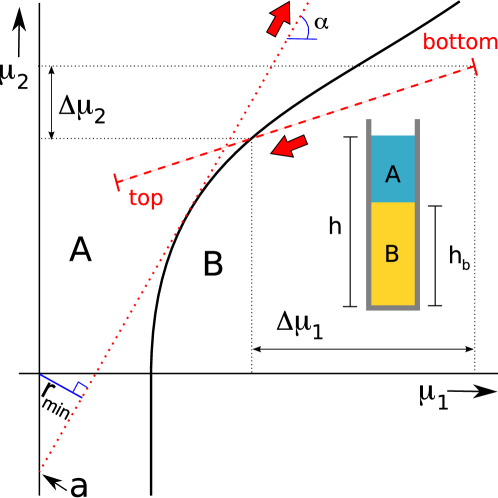
In order to illustrate these effects, we plot in Fig. 1 a schematic bulk phase diagram of a mixture with stable A and B bulk phases. We show a sedimentation path that starts in the region where B is stable, crosses the binodal, and ends in the region of stability of A. The corresponding stacking sequence consists of bottom B and top A, which we write as BA. Clearly, the thickness of each sedimentation layer is proportional to the difference in chemical potentials between its upper and lower interface, cf. Eq. (1). The difference in chemical potentials between the crossing of the sedimentation path and the binodal and the bottom of the sample in Fig. 1 is simply , with the macroscopic thickness of the bottom sedimentation layer. Neglecting effects due to finite sample height (to which we will turn below), the conditions for a sedimented sample are fully determined by the parameters and , which we now treat as new (state) variables. Each pair , determines uniquely a sedimentation path (2). We will in the following identify three types of boundaries in the plane, where the sedimentation behaviour changes qualitatively upon infinitesimal deviation of the parameters. We refer to these boundaries as: the sedimentation binodal, the terminal line, and the asymptotic terminal line.
(i) Sedimentation binodal. As , the Gibbs phase rule leaves one remaining free thermodynamic variable to parameterize . Choosing this parameter as results in and , from which one obtains at coexistence
| (4) |
The marginal case is obtained when the slope of the sedimentation path equals the slope of the binodal, which implies that
| (5) |
is simultaneously satisfied with (4); in (5) the prime denotes the derivative with respect to the argument. Multiplying (5) by , subtracting it from (4), and observing the structure (2) yields
| (6) |
where is the intercept of the marginal case. Eq. (6) establishes as the Legendre transform of the chemical potential representation of the bulk binodal. Hence any path (2), where the parameters are linked via , is special in that it divides the parameter space into distinct regions. These regions differ in that a qualitative change in the stacking sequence occur, namely the emergence of a floating phase (e.g. from A to ABA). All paths that satisfy (6) are tangent to the binodal (see Fig. 1).
(ii) Terminal line. The systems reaches a critical point, when locally for both components
| (7) |
from which follows, upon using the general expression (2), that
| (8) |
which is linear in , implying that a critical point corresponds to a straight (terminal) line in the -space of sedimentation paths. Indeed the same reasoning can be applied to the triple point and other “special” points in the phase diagram, at which a binodal ends. In each of these cases the result is analogous to (8). The sedimentation paths that correspond to (8), i.e. that lie on the terminal line, are those that cross the special point.
(iii) Asymptotic terminal line. A bulk binodal that does not terminate at finite values of can either be connected to a phase transition of one of the pure subsystems or it can represent a large demixing region at very high chemical potentials. In both cases the bulk binodal tends to an asymptote with well-defined slope,
| (9) |
and a corresponding (asymptotic terminal) line emerges in the stacking diagram, which is described by , for all values of . The paths that are described by (9) are those that are parallel to the asymptote of the binodal.
II Results
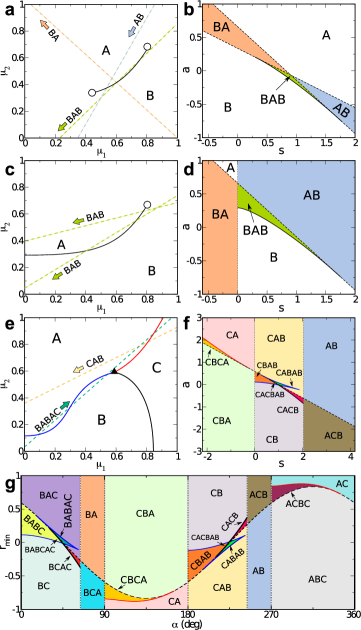
We show in Fig. 2 three schematic bulk phase diagrams in the plane (a,c,e) and the corresponding stacking diagrams in the plane (b,d,f). The simplest example (a) consists of a binodal that ends at two critical points. This topology corresponds to a closed immiscibility loop in the pressure-composition or density-density plane, as predicted, e.g., for mixtures of patchy colloids C0SM01493A . Two sedimentation paths with the same slope but opposite directions correspond to stacking sequences with inverse order (e.g., AB and BA); in order to avoid this ambiguity we only consider the case . The corresponding stacking diagram (b) contains one sedimentation binodal and one terminal line for each of the two critical points. Each terminal line is tangent to its end of the sedimentation binodal. The crossing point, where the two terminal lines intersect, represents the sedimentation path that connects the two critical points in the bulk phase diagram. The sedimentation binodal and the terminal lines divide the plane into five different regions with differing stacking sequences. Those paths that cross the bulk binodal twice generate the stacking sequence BAB. This triple stacks occurs although there is no triple point in the bulk phase diagram nor are there three different phases. A similar stacking sequence, a nematic phase sandwiched between two isotropic phases, has been theoretically predicted and experimentally observed very recently floating in mixtures of silica spheres and gibbsite platelets. In general, two consecutive phases in the stacking sequence coexist in bulk, but two non-consecutive phases may or may not coexist in bulk and, as the example demonstrates, the same phase (B) can reenter the sequence. An obvious consequence is that the Gibbs phase rule does not apply to the maximum number of layers in sedimentation equilibrium. Instead, the maximum number of sedimented layers in a mixture under gravity is , where is the number of bulk binodals and is the total number of inflection points in all binodals. This maximal number of layers occurs if a sedimentation path crosses each binodal times, with the number of inflection points of each binodal. The occurrence of an inflection point in a binodal has been predicted in colloidal platelet-sphere mixtures floating . It is also a natural consequence of a binodal that connects two phase transitions in the pure components of the mixture. An example is the isotropic-nematic transition in binary platelets mixtures, to which we turn below.
We next consider a case (c) where the AB phase transition persists in the pure system of species 2. The bulk binodal tends asymptotically to the value of at the phase transition of the pure species 2 when . In the stacking diagram (d) an asymptotic terminal line appears: as laid out above, this vertical line is at a position that gives the slope of the asymptote of the bulk binodal.
The complexity of the stacking diagram increases very significantly with the number of stable phases in the bulk phase diagram. In Fig.1 (e) we show a still rather simple bulk phase diagram with three bulk phases A, B and C that coexist at a triple point. The pure species 1 undergoes a BC phase transition that persists in the mixture and ends at the triple point. The BC bulk binodal tends asymptotically to the value of at the phase transition of the monodisperse system of species when (vertical asymptote). The component of the mixture undergoes an AB phase transition. The binodal has a horizontal asymptote and ends at the triple point. At chemical potentials above the triple point there is strong demixing between A and C. The AC binodal has asymptotically a well-defined slope, for which the general expression holds: , with the jump in density of species at the phase transition. At very high chemical potentials both species approach the close packing density and the slope of the binodal will be constant. The corresponding stacking diagram, Fig.2 (f), has three sedimentation binodals (one for each bulk binodal), one terminal line due to the triple point, and two asymptotic terminal lines. The asymptotic terminal line of the BC bulk binodal is not visible because its slope is infinite. To overcome this problem, we show in panel (g) the stacking diagram in the plane, where is the distance of the sedimentation path to the origin in the plane and , cf. Fig. 1. Here we use the sign convention that is positive (negative) for a clockwise (counterclockwise) path in order to discriminate between paths with identical value of , but negative value of . We find six sedimentation binodals (two for each bulk binodal because in this plane we plot all possible paths, , lifting any sign restriction on ), one terminal line, and six asymptotic terminal lines at , and . Each pair and represents the asymptotic behaviour (and direction) of a bulk binodal in the stacking diagram. All intersections between sedimentation binodals and terminal lines define the boundaries of the sedimented phases. There are 22 different stacking sequences, which vary in complexity from the simple AC to the exotic CACBAB. Sedimentation monophases do not occur, as each path crosses at least one binodal. These examples demonstrate the extreme richness of the stacking diagram.
We next apply the theory to a mixture of infinitely thin circular hard platelets with aspect ratio , where is the radius of species . We use a microscopic geometry-based density functional to calculate the bulk phase diagram. The functional goes beyond the Onsager limit and has been used previously to analyze the bulk phase diagram of platelet-platelet mixtures with different aspect ratios PhysRevE.81.041401 . The pure fluid of hard platelets undergoes an isotropic-nematic (IN) phase transition as a function of the chemical potential. Further phases with positional order, such as columnar or crystal phases, are not present in the model due to the vanishing thickness of the particles PhysRevE.57.4824 . The bulk phase diagram of the binary mixture is depicted in the plane in Fig. 3 (a). The IN bulk binodal connects the phase transitions of the pure components. The chemical potential of the small platelets, , decreases when a small fraction of big platelets is added to the pure fluid of small platelets (big platelets favour the orientational order of the small platelets). The behaviour of is the opposite: its coexistence value increases if a tiny fraction of small platelets is added to the pure system of big platelets. As a result, the bulk binodal, that connects both limits, has a curvature change and a maximum at intermediate values of composition.
The stacking diagram of the mixture is plotted in Fig. 3 (b) in the plane. There are two sedimentation binodals and four asymptotic terminal lines at and . We can identify six different sedimentation sequences, including a floating isotropic phase NIN, a double floating isotropic NINI and nematic ININ. Such states with four layers arise from the curvature change of the bulk binodal. The four stack can be understood as a fractionation between two double stacks, the lower one being rich in heavier platelets, and the upper one being rich in the lighter platelets. This interpretation applies to the inverted sequence, which appears in the region of negative buoyant masses.
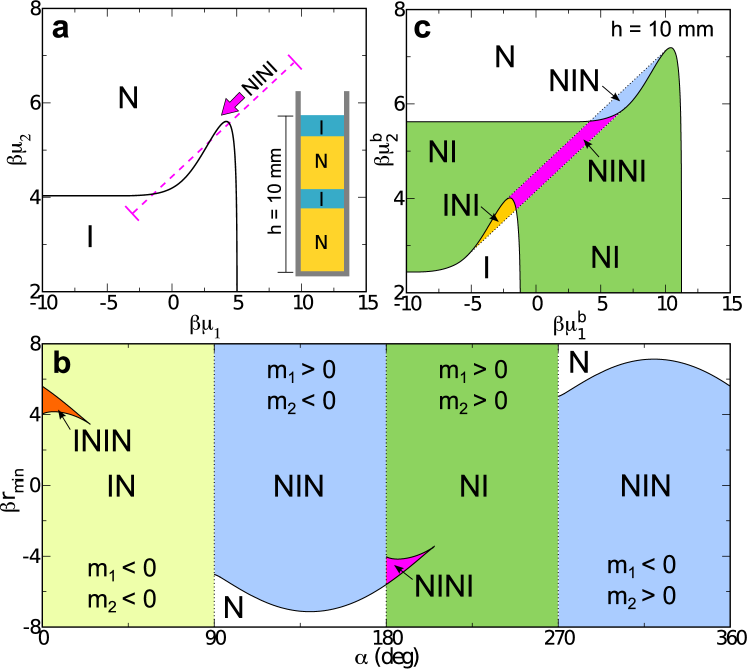
Real samples possess a finite height , such that there is only an interval of the corresponding infinite sedimentation path accessible. In order to characterize such a state, four variables are required, which we choose to be the slope of the path, the two reference chemical potentials and , cf. Eq. (1), and the sample height . We adopt the convention that the origin of the coordinate system is in the middle of the sample, such that . As a consequence at the local chemical potentials . We choose and , which is compatible with, e.g., a colloidal mixture of gibbsite platelets (species : average diameter and thickness ) and smectite (species : average diameter and thickness ) dispersed in water at room temperature (see e.g. floating and references therein). We obtain or , and we choose the vessel height as . An example of a sedimentation path and the corresponding sedimentation sequence for these conditions is shown in Fig. 3 (a). The stacking diagram for finite height is shown in Fig. 3 (c). Due to the finite sample height, additional sedimentation binodals arise when a sedimentation path starts or ends at the bulk binodal. While for infinite sedimentation paths there are only two sedimentation phases, NI and NINI, for finite height we find six different stacks I, N, NI, NIN, INI, and NINI. Hence the main effect of the finite length of the sedimentation path is that new sedimentation stacks appear. These are formed by removing layer(s) on top or bottom of the infinite stacking sequences. Note that the plane can be converted to the plane of average densities by calculating the density profiles and average density of those paths that form the phase boundaries of the stacking diagram.
III Discussion
A colloidal mixture under gravity can be represented by a straight line in the plane of chemical potentials, which we refer to as a sedimentation path. A crossing between the sedimentation path and a binodal corresponds to an interface in the sample, which establishes a direct relation between the path and the observed phase stacking sequence under gravity. We have developed a general theory that relates all possible stacking sequences of a colloidal mixture to its bulk phase diagram. We have shown how to group the stacking sequences in a stacking diagram that follows in a unique way from the bulk phase diagram. The binodals, their ending points, and their asymptotic behaviour are the three distinct elements that determine the boundaries between the different sedimentation states in the stacking diagram. The stacking and the bulk phase diagrams are linked by a well defined mathematical mapping based on the Legendre transform.
In order to characterize the sedimentation states, a suitable order parameter is the array of thicknesses, , of the individual layers in a sedimented stack. When crossing a boundary in the sedimentation diagram, at least one of the , which implies a continuous phase transition in the inhomogeneous systems. Finite-size and surface effects that are beyond our LDA treatment, will modify and enrich this scenario via wetting at the upper and lower boundaries and capillary evaporation effects of very thin floating layers schmidt04aog .
The order of the individual stacks is always of decreasing total mass density, . The condition follows by imposing local thermodynamic stability along the sedimentation path, i.e. that the matrix of partial derivatives , where is the system volume, is positive definite Reichl98 . This is consistent with the findings in Debenedetti1988 ; EspositoEtAl2000 , and not in conflict with the possibility of denser particles floating on top of lighter ones, as recently reported by Piazza et al C2SM26120K , provided that the floating phase has lower mass density than the supporting phase.
Gravity induces very rich phenomenology even for the simplest of mixtures. For example, the binary hard core platelet mixture that we investigated has only isotropic and nematic phases stable in bulk. We found that the stacking diagram contains six different types of sequences, with up to four distinct layers. The maximum number of layers in a stacking sequence is not limited by the Gibbs phase rule for bulk phases. Instead, an extended Gibbs phase rule holds, which accounts for the maximum number of layers that can appear in sedimentation-diffusion equilibrium. The relevant parameters are the number of binodals and the number of their inflection points, rather than only the number of components as is relevant in bulk. As a consequence, extremely rich stacking sequences can be found even for very simple mixtures. An example is the NINI stack that we predict to occur in the binary platelet mixture. Mixtures with three binodals can lead to stacking sequences with seven distinct layers in the simplest case with no inflection points.
Our results demonstrate that the ratio between the buoyant masses of both species, , is a key parameter that controls the stacking sequence of a mixture. Changing the strength of gravity, i.e. by using centrifugal forces as in analytic centrifugation, leaves the slope invariant. However, if the species are made of different materials, one can vary experimentally by changing the density of the solvent, because , where is the particle volume, is the mass density of species , and is the solvent density. Alternatively, one could vary by designing colloids with cores made of different materials blaaderen . While clearly the average density of colloids in the sample (related to cf. Eq. (2)) plays a major role in determining the stacking sequence, our considerations for the binary platelet mixture demonstrate that the total height of the sample is a further relevant parameter that should be carefully controlled in sedimentation experiments.
Our approach is relevant for computer simulation work, as the sedimentation-diffusion equilibrium of colloidal mixtures can be predicted by simulating only the bulk phase behaviour, which can be less computationally demanding than performing simulations of inhomogeneous systems under gravity.
Although we have restricted our study to the case of binary mixtures, the theory is valid for multicomponent systems, as sedimentation paths remain lines in the space spanned by all chemical potentials, cf. Eq. (1). Our theory can also be used to describe the sedimentation of mixtures with non-colloidal components. An example are mixtures of platelets and non-adsorbing polymers where the gravitational length of the polymers is much higher than that of the colloids. We have checked that the results from our approach, using the free-volume theory of Ref. zhang:9947 to describe the bulk phase diagram of the mixture, match those of the effective one-component approach by Wensink et. al 0295-5075-66-1-125 and the experiments by van der Kooij et. al PhysRevE.62.5397 . Our theory also applies to molecular mixtures, provided that the bare rather than the buoyant masses are used.
IV Acknowledgements
We thank Thomas Fischer for useful comments on the manuscript.
References
- (1) R. Tuinier, J. Rieger, and C. De Kruif, Depletion-induced phase separation in colloid-polymer mixtures. Adv. Colloid Interface Sci. 103, 1 (2003).
- (2) M. Leunissen, C. Christova, A. Hynninen, C. Royall, A. Campbell, A. Imhof, M. Dijkstra, R. van Roij, and A. Van Blaaderen, Ionic colloidal crystals of oppositely charged particles. Nature 437, 235 (2005).
- (3) D. de las Heras, J. M. Tavares, and M. M. Telo da Gama, Bicontinuous and mixed gels in binary mixtures of patchy colloidal particles. Soft Matter 8, 1785 (2012).
- (4) F. Varrato, L. Di Michele, M. Belushkin, N. Dorsaz, S. Nathan, E. Eiser, and G. Foffi, Arrested demixing opens route to bigels. Proc. Nat. Acad. Sci. 109, 19155 (2012).
- (5) E. C. M. Vermolen, A. Kuijk, L. C. Filion, M. Hermes, J. H. J. Thijssen, M. Dijkstra, and A. van Blaaderen, Fabrication of large binary colloidal crystals with a NaCl structure. Proc. Nat. Acad. Sci. 106, 16063 (2009).
- (6) R. Piazza, S. Buzzaccaro, E. Secchi, and A. Parola, What buoyancy really is. A generalized Archimedes’ principle for sedimentation and ultracentrifugation. Soft Matter 8, 7112 (2012).
- (7) D. de las Heras, N. Doshi, T. Cosgrove, J. Phipps, D. I. Gittins, J. S. van Duijneveldt, and M. Schmidt, Floating nematic phase in colloidal platelet-sphere mixtures. Sci. Rep. 2, 789 (2012).
- (8) L. Luan, W. Li, S. Liu, and D. Sun, Phase Behavior of Mixtures of Positively Charged Colloidal Platelets and Nonadsorbing Polymer. Langmuir 25, 6349 (2009).
- (9) M. Rasa and A. P. Philipse, Evidence for a macroscopic electric field in the sedimentation profiles of charged colloids, Nature 429, 857 (2004).
- (10) D. Kleshchanok, J. M. Meijer, A. V. Petukhov, G. Portale, and H. N. W. Lekkerkerker, Sedimentation and depletion attraction directing glass and liquid crystal formation in aqueous platelet/sphere mixtures. Soft Matter 8, 191 (2012).
- (11) C. Serrano, J. McDermott, and D. Velegol, Sediments of soft spheres arranged by effective density. Nat. Mater. 10, 716 (2011)
- (12) P. G. Debenedetti, Thermodynamic stability of singlephase fluids and fluid mixtures under the influence of gravity, J. Chem. Phys. 89, 6881 (1988).
- (13) R. O. Espósito, M. Castier, F. W. Tavares, Calculations of thermodynamic equilibrium in systems subject to gravitational fields, Chem. Eng. Sci. 55, 3495 (2000).
- (14) J. P. Hansen and I. R. McDonald, Theory of Simple Liquids, 3rd ed. (Academic Press, London, 2006).
- (15) M. Schmidt, M. Dijkstra, and J.-P. Hansen, Floating Liquid Phase in Sedimenting Colloid-Polymer Mixtures. Phys. Rev. Lett. 93, 088303 (2004).
- (16) D. de las Heras, J. M. Tavares, and M. M. T. da Gama, Phase diagrams of binary mixtures of patchy colloids with distinct numbers of patches: the network fluid regime. Soft Matter 7, 5615 (2011).
- (17) J. Phillips and M. Schmidt, Bulk phase behavior of binary hard platelet mixtures from density functional theory. Phys. Rev. E 81, 041401 (2010).
- (18) M. A. Bates and D. Frenkel, Infinitely thin disks exhibit a first order nematic-columnar phase transition. Phys. Rev. E 57, 4824 (1998).
- (19) L. E. Reichl, A Modern Course in Statistical Physics, 2nd ed. (Wiley, New York, 1998).
- (20) Velikov, K. P. and van Blaaderen, A., Synthesis and Characterization of Monodisperse Core-Shell Colloidal Spheres of Zinc Sulfide and Silica. Langmuir 17, 4779 (2001).
- (21) S. Zhang, P. A. Reynolds, and J. S. van Duijneveldt, Phase behavior of mixtures of colloidal platelets and nonadsorbing polymers. J. Chem. Phys. 117, 9947 (2002).
- (22) H. H. Wensink and H. N. W. Lekkerkerker, Sedimentation and multi-phase equilibria in mixtures of platelets and ideal polymer. EPL (Europhysics Letters) 66, 125 (2004).
- (23) F. M. van der Kooij, M. Vogel, and H. N. W. Lekkerkerker, Phase behavior of a mixture of platelike colloids and nonadsorbing polymer. Phys. Rev. E 62, 5397 (2000).