Thermal properties of the middle-aged pulsar J17412054
Abstract
We present results of the spectral analysis of the X-ray emission from the middle-aged Fermi pulsar J17412054 using all Chandra archival data collected in 2010 and 2013. We confirm early findings by Romani et al. 2010 that the pulsar spectrum contains a thermal emission component. The component is best described by the blackbody model with the temperature 60 eV and the emitting area radius 17 km. The thermal emission likely originates from the entire surface of the cooling neutron star if the distance to the pulsar is 0.8 kpc. The latter is supported by a large absorbing column density inferred from the X-ray fit and empirical optical extinction–distance relations along the pulsar line of sight. The neutron star surface temperature and characteristic age make it similar to the well studied middle-aged pulsar B105552. Like the latter PSR J17412054 is hotter than the standard cooling scenario predicts.
1 Introduction
One of a few possibilities to probe the physics of the dense matter in extreme conditions inside neutron stars (NSs) is to study the thermal emission from their surfaces (Haensel et al., 2007). Nearby middle-aged pulsars are natural targets for these aims. Many of them clearly show the thermal component in their soft X-ray spectra. In some cases it can be attributed to the emission from the entire NS surface and the surface temperature can be measured. So far it has been done only for a dozen of middle-aged pulsars. Recent Fermi-LAT -ray discoveries open a new window for that.
A middle-aged -ray pulsar J17412054, hereafter J1741, has a period = 413 ms, a characteristic age = 391 kyr, a spin-down luminosity = 9.5 1033 erg s-1, and a magnetic field = 2.7 1012 G (Abdo et al., 2013). After the discovery with Fermi (Abdo et al., 2009) it was studied in various bands. A dispersion measure (DM) of 4.7 pc cm-3 (Camilo et al., 2009) implies a distance of 380 pc for the Galactic electron density model of Cordes & Lazio (2002). A bow-shock nebula was detected around the pulsar in H (Romani et al., 2010). In X-rays, a point-like object identified with the pulsar, a compact pulsar wind nebula (PWN) structure, and a PWN trail extended through 7″ and 2′ from the pulsar, respectively, were detected with Chandra (Romani et al., 2010).
Romani et al. (2010) pointed out the presence of a soft thermal component in the pulsar spectrum, however no analysis of the thermal emission have been presented so far, save for a brief conference abstract by Sivakoff et al. (2011). Here we fill this gap and report results of analysis of the pulsar thermal emission.
2 Analysis of the X-ray spectrum
| Obs ID | Instrument | Exp., ks | Start Date |
|---|---|---|---|
| 11251 | ACIS-S | 48.78 | 2010-05-21 |
| 14695 | ACIS-S | 57.15 | 2013-02-06 |
| 14696 | ACIS-S | 54.3 | 2013-02-19 |
| 15542 | ACIS-S | 28.29 | 2013-04-01 |
| 15543 | ACIS-S | 57.22 | 2013-05-17 |
| 15544 | ACIS-S | 55.73 | 2013-07-12 |
| 15638 | ACIS-S | 29.36 | 2013-04-02 |
Recently, the J1741 field has been extensively observed in X-rays with Chandra/ACIS as part of the large program111“A Legacy Study of the Relativistic Shocks of PWNe”, PN 14500153, PI Roger Romani. which aimed at studies of PWNe spatial and temporal variability. As a spin-off of the program, a substantial number of the pulsar photons has been collected. We have retrieved all the data obtained with Chandra (see Table 1). For all data sets, the data mode was VFAINT, the exposure mode was TE, and the pulsar was exposed on the S3 chip. The CIAO v.4.6 chandra_repro tool with CALDB v.4.5.9 was used to reprocess all data sets.
An image of the pulsar neighborhood in 0.7–8.0 keV obtained by merging all data sets is shown in the left panel of Fig. 1, where the pulsar is marked by an arrow. The compact PWN adjacent to the pulsar and the extended trail, enclosed in a dashed polygon, are clearly seen. Based on the analysis of the ObsID 11251, Romani et al. (2010) reported on a tentative detection of a presumed torus of the PWN within the 2″ from the pulsar containing about 11% of the total data counts in this region. This conclusion followed from the appearance of the 25 075 excess structure centered at the pulsar position after subtraction of the point-spread function (PSF) modeled by MARX. However, it is well known that the Chandra PSF does not fit well to the point-source core and that there are some anisotropic irregularities in the fit residuals.222http://cxc.harvard.edu/cal/Hrc/PSF/acis_psf_2010oct.html The Chandra team advices to treat with caution features with small spatial dimensions and strengths like the presumed torus.333http://cxc.harvard.edu/ciao/caveats/psf_artifact.html#advice
To examine how the point-like pulsar is actually contaminated by the compact PWN we modeled PSF event files for each data set using the ChaRT (Carter et al., 2003) and MARX tools. We have estimated the number of residual counts with respect to that of the point-like source as follows.444for details see the corresponding ciao thread, http://cxc.harvard.edu/sherpa/threads/2dpsf/ The data images were fitted with a sum of a symmetric 2D Gaussian, which modeled a point-like source blurring due to pointing uncertainty (see e.g., Weisskopf, 2011), and a constant background, convolved with the modeled PSFs. The 2D residuals pattern is similar to those reported by Chandra team for a number of point sources. The example for ObsID 11251 is shown in the right panel of Fig. 1. We do not see evidence of any PWN structure in the central 2″. The most prominent south-east structure correlated with the detector axis and containing of the total source counts is consistent with a “hook feature” described in the Chandra report. It is possibly related to imperfect modeling of the Chandra optics. The putative PWN torus claimed by Romani et al. (2010) could have been actually mixed up with this hook structure; in any case its detection is likely a result of an incorrect treatment of the systematic effects of the PSF subtraction.
In order to select the reliable aperture for extraction of the pulsar spectra we calculated brightness profiles from the PSFs and data event files using concentric annuli centered at the pulsar position with radii from 0 to 10″ through 029 and summed up the data and PSF profiles over all data sets. The resulting profiles are shown in Fig. 2. It is seen that the data are dominated by the point source within the central 2″. We conservatively chose the 15-radius aperture which contains 95% of the source counts. For the background, we used a region free of any sources in each data set. We extracted spectra with the CIAO v.4.6 specextract tools. The spectra were grouped to ensure 25 counts per energy bin. Using the XSPEC v.12.8.1 we then fitted the spectra in 0.3–10 keV range simultaneously by an absorbed composite model, a sum of a power law (PL), which models the pulsar magnetosphere emission, and a thermal component, which models emission from the NS surface. For the thermal component, we have tried magnetized neutron star atmosphere models NSA (Pavlov et al., 1995) and NSMAX (Ho et al., 2008), and the blackbody (BB) model.
The goodness-of-fit test shows that the hydrogen atmosphere models can be rejected for any reasonable model parameters. The reduced chi-squared value is (dof ) for the NSA+PL and NSMAX+PL models. The single BB and PL, and BB+BB models give even worse fits: (dof ), = 1.91 (dof ), and (dof ), respectively.
In contrast, the BB+PL model is statistically acceptable (, dof ). It is compared with the data in Fig. 2 and its best-fit parameters are presented in Table 2. At the DM distance, the emitting area radius inferred from the fit is too large for a hot polar cap, which should be about 200 m for a 400 ms pulsar according to Sturrock (1971). At the same time, rather large emitting area radius suggests that the thermal emission originates from a substantial part of the NS surface.
| absorption | |
|---|---|
| column density | 1021 cm-2 |
| photon index | |
| PL normalization | 10-4 |
| ph keV-1 cm-2 s-1 | |
| emitting area radius | km |
| temperature | eV |
| (dof) | 1.06 (557) |
Fitting the PWN trail spectrum extracted from the dashed polygon in Fig. 1 with the absorbed PL model we get = (1.6 0.5) 1021 cm-2 and photon index 1.78 0.15 (errors are at 90%), which is in agreement with the results of Romani et al. (2010) and with the inferred from the BB+PL fit (Table 2). An independent limit on the absorption column density, based on the H nebula spectroscopy, is 2.5 1021 cm-2 (Romani et al., 2010). To reconcile the large values followed from both the X-ray and the H nebula spectroscopy with the electron column density 1.4 1019 cm-2 deduced from the DM one needs to assume a low ionization ratio of about 0.01 along the line of sight (Romani et al., 2010).
3 Discussion
It is possible that the thermal component of the NS X-ray emission originates from the entire surface of the NS. The apparent radius of an NS with canonical parameters ( and km) is approximately 13 km. In Fig. 4, we show the confidence contours of the effective temperature and the absorbing column density vs. the distance to the pulsar evaluated from the BB normalization. One sees that the pulsar should be at (0.8 0.2) kpc which is a factor of two larger than the DM distance.
We may estimate the distance independently as follows. The value derived from the X-ray fit is nearly half the entire Galactic in the pulsar direction, 3 1021 cm-2, according to the HI survey by Dickey & Lockman (1990). Assuming the Galactic gaseous disk half-thickness of 0.1 kpc and taking the pulsar latitude = 49 the maximal distance inside the Galactic disk in the pulsar direction is about 1.4 kpc. Making a rough assumption that is proportional to the distance, we conclude that the pulsar must be approximately at half the maximal distance, which is 0.7 kpc. One of precautions this estimate should be taken with is that values from HI surveys may underestimate a column density responsible for the X-ray absorption. However, the similar value of kpc is obtained from the optical extinction () – distance fit in the pulsar direction (Chen et al., 1998), where is derived from the standard relation (Predehl & Schmitt, 1995). Taking another –distance fit from Drimmel et al. (2003) we get the distance of 0.9 kpc. While the use of the extinction maps can underestimate the value along the specific line of sight due to the lack of high spatial resolution information, these distance estimates are in agreement with that obtained from the X-ray fit (see Fig. 4). For completeness, the distance can be also estimated from an empirical correlation between the pulsar distances and -ray fluxes above 100 GeV. This “pseudo-distance” relation (e.g., Saz Parkinson et al., 2010) suggests a value 450 pc. However this is the most uncertain estimate (within a factor of 2-3) and thus is consistent with all other.
An increase in the distance means also an increase in the X-ray and -ray efficiencies, i.e. ratios of the X-ray nonthermal and -ray luminosities to . The X-ray efficiency in the 2–10 keV range derived from the X-ray fit is 9.7 10-5 . The -ray efficiency is 0.97 (Abdo et al., 2013). Such a high -ray efficiency is not unusual. There are -ray pulsars, Geminga for instance, with efficiencies almost equal or even greater than one (Abdo et al., 2013).
It is natural to compare J1741 with “The Three Musketeers”, Geminga, PSR B0656+14, and PSR B105552, well-studied middle-aged pulsars with observed thermal emission (Becker & Trümper, 1997). Like the Three Musketeers, J1741 demonstrates a soft thermal emission in X-rays, which is well fitted by the blackbody model, while all hydrogen atmosphere models fail giving too large normalizations. In contrast to the Three Musketeers, however, the J1741 spectrum does not show an additional hot BB component. The thermal component of J1741 is not as prominent with respect to the nonthermal one as the thermal components of the Three Musketeers. This can explain the lack of a hot spot component in the spectral fit – it is possibly hidden under the strong nonthermal component. It is worth noting that J1741 has a relatively large power-law photon index () in comparison with the musketeers ().
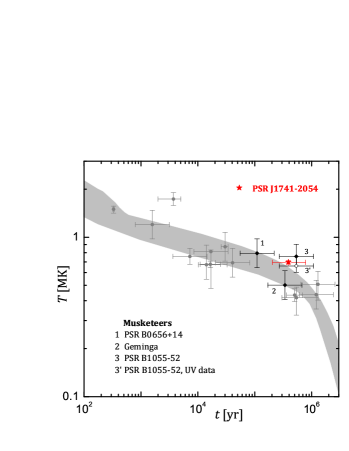
Let us compare the thermal properties of J1741 with data on other isolated NSs. In Fig. 5, we show the standard NS cooling theory predictions (filled region; e.g., Yakovlev & Pethick, 2004) along with the observational data on the age–temperature plane. The data are taken from the same references as cited in Shternin et al. (2011) with addition of the data on PSR J0357+0325 from Kirichenko et al. (2014). The three musketeers are marked by black diamonds and numbered. The J1741 position is shown with a star. From the point of view of the NS cooling theory J1741 is most similar to PSR B105552. Like the latter, it is located at the “knee” of the cooling curve, which corresponds to the transition from the neutrino cooling stage to the photon cooling stage (Yakovlev & Pethick, 2004). One sees that J1741 is somewhat older and hotter than the standard cooling theories predict, but not as strongly as PSR B105552.
The standard cooling scenario assumes that NSs are cooling down via the modified Urca neutrino emission process and any processes of enhanced neutrino emission are not allowed. This scenario is largely independent of the dense matter equation of state and stars which cool in such a way can be regarded as “standard candles” of NS cooling theory (Yakovlev et al., 2011). If J1741 is actually 390 kyr old and has the effective temperature of 7 105 K, calculations show that the neutrino emissivity inside the star has been suppressed with respect to the standard level throughout its life (Fig. 5), approximately by a factor of 4.
The suppression of the neutrino emission can be realized in the framework of the minimal cooling theory (Gusakov et al., 2004; Page et al., 2004) which includes effects of the nucleon superfluidity. In this model, the modified Urca processes are suppressed by the strong proton superfluidity. However, the minimal cooling also assumes the presence of the neutron superfluidity which enhances the cooling with respect to the standard level (see e.g., Gusakov et al., 2004; Page et al., 2004, for details). This enhancement is required to explain the coldest sources in Fig. 5, however it makes impossible to fit the data for hot sources utilizing the usual models for neutron superfluidity (Page et al., 2004, 2009). The sources at the “knee”, such as PSR B105552 and now J1741, can be reconciled with the minimal cooling if one shifts the neutron superfluidity to high densities, so that it does not take place in low-mass stars (with low central density) and operates in high-mass stars (Gusakov et al., 2004). This assumption makes it possible to explain all current data on cooling isolated neutron stars in the unified way, including the possibly real-time cooling NS in supernova remnant Cassiopeia A (Shternin et al., 2011). In this model the J1741 should have a low mass while the cold NSs should be massive. These considerations remain true if J1741 is several times younger and/or colder. In this case the J1741 position on the cooling plane will agree with the standard cooling scenario. Nevertheless, the presence of the superfluidity inside the NSs is almost undoubted and the question remains only about its quantitative characteristics.
It is indeed possible that further analysis will result in lower age or surface temperature of J1741. An NS characteristic age can be several times larger than its true age (see e.g., Brisken et al., 2003; Thorsett et al., 2003). The lower temperature of the stellar surface also can not be ruled out. For instance, the UV observations of PSR B105552 show a Rayleigh–Jeans component which exceeds the extrapolation of the X-ray thermal spectrum by a factor of 4. This led Mignani et al. (2010) to suggest that the X-ray emission in fact comes from the smaller hot region on the stellar surface (this is possible if the pulsar is closer), while the entire surface is colder, being invisible in X-rays and showing itself in UV. For illustration, with the open diamond and the label 3’ in Fig. 5 we show the position of the PSR B105552 according to the UV observations by Mignani et al. (2010) (for the distance 350 pc). This makes the positions of PSRs B105552 and J1741 similar with respect to standard cooling curves. Note, that for the other two musketeers an extrapolation of X-ray thermal spectra agrees with the UV data, while for RX J1856.53754 and other NSs of the “Magnificent seven” the situation is similar to that of PSR B105552 (Kaplan et al., 2011). It is therefore interesting to investigate which is the case for the J1741 in the UV.
To conclude, the X-ray spectra of J1741 can be well described by a sum of a power law and a single blackbody with temperature of about 60 eV. If the blackbody component is interpreted as a thermal emission from the entire surface of the neutron star, the distance to the pulsar should be approximately 0.8 kpc. Similar value follows from the analysis of the extinction towards the pulsar, supporting this interpretation. The J1741 is a rather hot middle-aged neutron star and its further studies will be useful to constrain the physical input of the modern cooling theories.
References
- Abdo et al. (2009) Abdo, A. A., Ackermann, M., Ajello, M., et al. 2009, Science, 325, 840
- Abdo et al. (2013) Abdo, A. A., Ajello, M., Allafort, A., et al. 2013, ApJS, 208, 17
- Becker & Trümper (1997) Becker, W., & Trümper, J. 1997, A&A, 326, 682
- Brisken et al. (2003) Brisken, W. F., Fruchter, A. S., Goss, W. M., Herrnstein, R. M., & Thorsett, S. E. 2003, AJ, 126, 3090
- Camilo et al. (2009) Camilo, F., Ray, P. S., Ransom, S. M., et al. 2009, ApJ, 705, 1
- Carter et al. (2003) Carter, C., Karovska, M., Jerius, D., Glotfelty, K., & Beikman, S. 2003, in Astronomical Society of the Pacific Conference Series, Vol. 295, Astronomical Data Analysis Software and Systems XII, ed. H. E. Payne, R. I. Jedrzejewski, & R. N. Hook, 477
- Chen et al. (1998) Chen, B., Vergely, J. L., Valette, B., & Carraro, G. 1998, A&A, 336, 137
- Cordes & Lazio (2002) Cordes, J. M., & Lazio, T. J. W. 2002, ArXiv Astrophysics e-prints, arXiv:astro-ph/0207156
- Dickey & Lockman (1990) Dickey, J. M., & Lockman, F. J. 1990, ARA&A, 28, 215
- Drimmel et al. (2003) Drimmel, R., Cabrera-Lavers, A., & López-Corredoira, M. 2003, A&A, 409, 205
- Gusakov et al. (2004) Gusakov, M. E., Kaminker, A. D., Yakovlev, D. G., & Gnedin, O. Y. 2004, A&A, 423, 1063
- Haensel et al. (2007) Haensel, P., Potekhin, A. Y., & Yakovlev, D. G. 2007, Neutron stars 1. Equation of state and structure (New-York: Springer)
- Ho et al. (2008) Ho, W. C. G., Potekhin, A. Y., & Chabrier, G. 2008, ApJS, 178, 102
- Kaminker et al. (2006) Kaminker, A. D., Gusakov, M. E., Yakovlev, D. G., & Gnedin, O. Y. 2006, MNRAS, 365, 1300
- Kaplan et al. (2011) Kaplan, D. L., Kamble, A., van Kerkwijk, M. H., & Ho, W. C. G. 2011, ApJ, 736, 117
- Kirichenko et al. (2014) Kirichenko, A., Danilenko, A., Shibanov, Y., et al. 2014, A&A, 564, A81
- Mignani et al. (2010) Mignani, R. P., Pavlov, G. G., & Kargaltsev, O. 2010, ApJ, 720, 1635
- Page et al. (2004) Page, D., Lattimer, J. M., Prakash, M., & Steiner, A. W. 2004, ApJS, 155, 623
- Page et al. (2009) —. 2009, ApJ, 707, 1131
- Pavlov et al. (1995) Pavlov, G. G., Shibanov, Y. A., Zavlin, V. E., & Meyer, R. D. 1995, in The Lives of the Neutron Stars, ed. M. A. Alpar, U. Kiziloglu, & J. van Paradijs, 71
- Predehl & Schmitt (1995) Predehl, P., & Schmitt, J. H. M. M. 1995, A&A, 293, 889
- Romani et al. (2010) Romani, R. W., Shaw, M. S., Camilo, F., Cotter, G., & Sivakoff, G. R. 2010, ApJ, 724, 908
- Saz Parkinson et al. (2010) Saz Parkinson, P. M., Dormody, M., Ziegler, M., et al. 2010, ApJ, 725, 571
- Shternin et al. (2011) Shternin, P. S., Yakovlev, D. G., Heinke, C. O., Ho, W. C. G., & Patnaude, D. J. 2011, MNRAS, 412, L108
- Sivakoff et al. (2011) Sivakoff, G. R., Camilo, F., de Luca, A., et al. 2011, in AAS/High Energy Astrophysics Division, Vol. 12, AAS/High Energy Astrophysics Division, #42.09
- Sturrock (1971) Sturrock, P. A. 1971, ApJ, 164, 529
- Thorsett et al. (2003) Thorsett, S. E., Benjamin, R. A., Brisken, W. F., Golden, A., & Goss, W. M. 2003, ApJ, 592, L71
- Weisskopf (2011) Weisskopf, M. C. 2011, ArXiv e-prints, arXiv:1110.4020
- Yakovlev et al. (2008) Yakovlev, D. G., Gnedin, O. Y., Kaminker, A. D., & Potekhin, A. Y. 2008, in American Institute of Physics Conference Series, Vol. 983, 40 Years of Pulsars: Millisecond Pulsars, Magnetars and More, ed. C. Bassa, Z. Wang, A. Cumming, & V. M. Kaspi, 379–387
- Yakovlev et al. (2011) Yakovlev, D. G., Ho, W. C. G., Shternin, P. S., Heinke, C. O., & Potekhin, A. Y. 2011, MNRAS, 411, 1977
- Yakovlev & Pethick (2004) Yakovlev, D. G., & Pethick, C. J. 2004, ARA&A, 42, 169