The Double Galaxy Cluster Abell 2465 II. Star Formation in the Cluster
Abstract
We investigate the star formation rate and its location in the major merger cluster Abell 2465 at = 0.245. Optical properties of the cluster are described in Paper I. Measurements of the H and infrared dust emission of galaxies in the cluster were made with an interference filter centred on the redshifted line at a wavelength of 817 nm and utilized data from the WISE satellite 12 m band. Imaging in the Johnson and bands was obtained, and along with SDSS and was used to study the blue fraction, which appears enhanced, as a further signatures of star formation in the cluster. Star formation rates were calculated using standard calibrations. The total star formation rate normalized by the cluster mass, compared to compilations for other clusters indicate that the components of Abell 2465 lie above the mean and relations, suggestive that interacting galaxy clusters have enhanced star formation. The projected radial distribution of the star forming galaxies does not follow a NFW profile and is relatively flat indicating that fewer star forming galaxies are in the cluster centre. The morphologies of the H sources within for the cluster as a whole indicate that many are disturbed or merging, suggesting that a combination of merging or harassment is working.
keywords:
galaxies: clusters: general – galaxies: clusters: individual: Abell 2465; galaxies: evolution; galaxies: starburst1 INTRODUCTION
Merging galaxy clusters can provide information on several aspects of cosmology. One sees the interaction of different matter components in their gravitational fields and is provided clues about galaxy evolution. The dynamics in galaxy cluster collisions including the galaxies’, baryonic and dark matter components, have been studied by several authors (e.g., Roettiger et al. 1996, 1997; Ricker 1998; Tazikawa 2000; Ricker & Sarazin 2001; Ritchie & Thomas 2002; Springel & Farrar 2007; Mastropietro & Burkert 2008; Poole et al. 2008; Planelles & Quilis 2009; Vijayaraghavan & Ricker 2013) although the effects of cluster collisions on star formation rates (SFR) have received less attention.
It is generally held that galaxy clusters grow from merging and their less relaxed exterior regions are more gas rich whilst interior sections having undergone more interactions are gas depleted, leading to differences in star formation. For most low redshift ( galaxy clusters in the local universe the total SFR per cluster mass drops with decreasing , and also cluster mass, (e.g., Finn et al. 2005; Koyama et al. 2010; Chung et al. 2011; Popesso et al. 2012; Webb et al. 2013). This is related to the general process of ’downsizing’ in which the star formation decreases with the lowering of redshift (e.g., Le Floc’h et al. 2005) and the SFR-surface density relation (e.g., Martinex et al. 2002; Gómez et al. 2003). Using X-ray and optical data, Lagana et al. (2008) found that massive ’hot’ clusters have less star formation than ’cold’ clusters of lower mass.
However in collisions between clusters, enhancements of star formation have been reported at lower redshifts (e.g., Miller 2005; Cortese et al. 2004; Ferrari et al. 2005; Miller & Owen 2003; Hwang & Lee 2009; Chung et al. 2009; 2010; Rawle et al. 2010; Ma et al. 2010; Russell et al. 2010; Biviano et al. 2011; Bourdin et al. 2011; Owers et al. 2011; Canning et al. 2012; Dawson et al. 2012; Rawle et al. 2014). Not all objects show this effect, however, and it is of interest to compare the regions of star formation and the distributions of the displaced baryonic and dark matter components produced by the cluster interactions.
Mechanisms contributing to the star formation in galaxy evolution are complicated, the dominant one for a particular object probably depends on the environment, and include ram pressure stripping, strangulation, galaxy harassment, galaxy-galaxy interactions, and tidal effects on the cluster galaxies (Bekki 1999, 2013; Gnedin 2003a,b). Martig & Bournaud (2008) found that star formation in mergers can be enhanced by the tidal field in galaxy clusters and complicated substructure can induce appreciable effects.
Substructure in galaxy clasters has been long known (e.g., Geller & Beers 1982) and used to study their formation and relaxation (e.g., Burgett et al. 2004). Investigations of the star formation rates among galaxies in the substructure of clusters (e.g., Cohen et al. 2014; Cohen, Hickox, & Wegner 2014) are complicated due to the difficulties of assessing their dynamical states, but show a weak but significant correlation with substructure in the sense that the unrelaxed clusters, as defined by the number of their subcomponents, have higher star formation which also increases outwards with clustercentric distance.
Interpretation is further complicated by a lack of knowledge of the phase and geometry of the collision when the clusters are observed, e.g., before or after closest core passage, whether it is a first or second passage of the merger, or if the orbit is linear or parabolic. Bekki (2013) finds that ram pressure stripping enhances or reduces star formation in groups and clusters of galaxies depending on their initial morphologies and geometrical conditions. Vijayaraghavan & Ricker (2013) have modelled ram pressure stripping in cluster collisions and find that it can affect galaxies at large distances as well as stopping star formation in most central regions of clusters.
This paper examines star formation in the double galaxy cluster Abell 2465. It has the relatively simple structure of two subclusters, referred to here as the SW and NE clumps. It is a double X-ray source and the basic properties are given in Wegner (2011; hereafter Paper I) where Mpc and for each subcluster although their other properties differ. In Paper I an apparent overabundance of galaxies showing H emission was suggested; 37 percent of the 158 spectroscopically observed cluster members show emission lines and fall predominantly in the star forming region of the diagnostic diagram. Most of these sources are closer to the cluster centres, whereas in single galaxy clusters, emission line galaxies tend to be more numerous in the outer infall regions of the clusters (e.g., Balogh et al. 2004; Rines et al. 2005).
The detection of H emission photometrically by combining narrow and broad band filters is employed, a technique used by many authors, including Kennicut & Kent (1983), Salzer et al. (2005), Werk et al. (2010), Kellar et al. (2012). In particular, Finn et al. (2005), Morioka et al. (2008), Shioya et al. (2008), Westra & Jones (2008), James et al. (2004), Fujita et al. (2003), Kodama et al. (2004), and Koyama et al. (2010, 2011) have targeted galaxy clusters at intermediate redshifts employing this technique. For Abell 2465, the redshift is and H appears at a wavelength near 817 nm with individual cluster members emitting between 814 and 820 nm.
The other well known technique for studying star formation is using infrared dust emission. Abell 2465 is covered by the Wide-fileld Infrared Survey Explorer (WISE; Wright et al. 2010) satellite and although the galaxy cluster is near the sensitivity limit of this instrument, it provides a valuable check on the H measurement.
In addition to , and imaging obtained by the CFHT and described in Paper I and Wegner et al. (in preparation) Abell 2465 is now included in the Sloan Digital Sky Survey data release 9 (DR9; Ahn et al. 2012). For this study, and observations were secured at the MDM Observatory to further study possible star forming galaxies. These data can be used for studying the blue fraction of the galaxies in the cluster which can also be taken as an indicator of the SFR.
This paper reports H and imaging in Abell 2465, used to estimate the extent of star formation in this double system. Section 2 describes the H observations. Section 3 gives the resulting H SFR. Section 4 gives the SFR determined from WISE data and Section 5 compares these results with star formation rates in other galaxy clusters. Section 6 discusses the morphologies of the galaxies. Section 7 describes the and measurements and colour-colour and colour-magnitude diagrams qnd blue fraction. Section 8 discusses possible mechanisms for causing star formation and Section 9 gives conclusions. The WMAP 5-year cosmological parameters as implemented in NED are used in this paper.
2 The H imaging
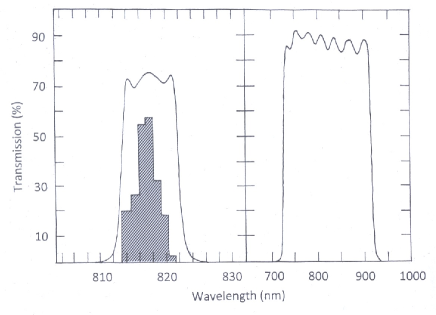
The wavelength of the H line at the redshift of Abell 2465 is near 817 nm in a clear spectral region between the many telluric emission lines. A custom narrow band filter for observing H was obtained from the Andover Corp. It has a peak transmission at 817.7 nm () and a full width half maximum (FWHM) of 8.77 nm. The wide filter was a Gunn () filter with nearly the same central wavelength of 820 nm and a FWHM of 185 nm, was manufactured by Custom Scientific. The transmissions of the two filters are given in Figure 1 and compared with the spectroscopic redshifts measured in the cluster.
2.1 The H observations and reductions
H observations of Abell 2465 were obtained 2012 September 19-23 using the 2.4 m Hiltner telescope at the MDM Observatory on Kitt Peak. The ‘Nellie’ CCD was used111Further details of these instruments can be found on the MDM Observatory’s web-page: http://www.astro.lsa.umich.edu/obs/mdm/technical/index.html. . This is a thick front illuminated Tektronix 2048 2048 Space Telescope Imaging Spectrograph (STIS) detector. The readout noise is 4.38 e-, the gain is 2.94 ADU, and with the 2.4 m telescope the image scale is 0.24 arcsec per pixel. With the 817 nm filter, the field is about 8.3 arcmin in diameter and the field is a square of the same size. A series of three 20 minute exposures were made of 18 overlapping fields in Abell 2465 with the 817 nm filter plus two 5 minute exposures with the filter in the sequence and the images were dithered by a few pixels. Standard data reduction procedures employed IRAF 222IRAF is distributed by the National Optical Astronomy Observatories which are operated by the Association of Universities for Research in Astronomy, Inc. under cooperative agreement with the National Science Foundation. . Ten bias frames were taken every night, averaged, and subtracted from each image. Flat fields were made inside the telescope dome. Four bad columns were corrected using fixpix. Each set of three images was averaged using imcombine with positional offsets measured from matching stars on each frame and the ccdclip option was employed for cosmic ray rejection. For the pairs, cosmic rays were eliminated with the lacosmic program (van Dokkum 2001) before summing. The seeing FWHM measured on the images was arcsec.
World Coordinate System (WCS) coordinates were found using the IRAF programs ccmap for a first approximation followed with msctpeak with the US Naval Observatory (USNO) b catalog. This gave fits accurate to about arcsec for all averaged images.
The magnitudes of all objects on each frame were determined with the program Sextractor (Bertin & Arnouts 1996) using the mag_auto measurements. The image was first measured with the single image mode and sources were matched by measuring the image with the double image mode. The zeropoints were found from five refererence stars on each image employing band photometry from the SDSS DR9 which gave a mean zeropoint error of mag. per image for the comparison stars with mag. Stars were separated from galaxies using the Sextractor stellarity parameters and objects were further inspected by eye.
2.2 Calibration of the H emission
The wide and narrow band filters provide two equations for the continuum level, , and the emission near H, . This is simplified by assuming rectangular responses and constant . The ratio of the FWHM of the two filters is , which gives:
| (1) |
where the zeropoints, were obtained from the magnitudes using .
The galaxy J339.80887-5.74450 which has strong H + [N II] emission (EW = 82 Å for H) and its corresponding galaxy magnitudes are:
Employing Anglo-Australian Telescope (AAT) and MDM data in Paper I, two cluster galaxies J339.85236-5.78806 and J339.91864-5.72389 calibrated the AAT data which were in common with calibrated MDM spectra obtained 2008 September 26 and 27 on photometric nights with the irscal flux standards Hiltner 102 and HD19445 included in the IRAF onedspec tasks standard, sensfunc, and calibrate. Using the mean Kitt Peak atmospheric extinction, the flux relative to J339.80887-5.74450 through the two filters is:
erg s-1 cm-2 with estimated errors of %. The continuum for each galaxy is obtained from:
which gives the emission component:
To correct for the [N II] emission at 6548 and 6583, the final H apparent luminosity is taken to be
| (2) |
found using spectroscopic measurements of 42 galaxies in Paper I, comparable to 0.75 found by Kennicut(1983) and Tresse et al. (1999; 2002).
2.3 Galaxy selection
The same photometric standards were used for the and zero points, so the ratio for a galaxy with no H emission. When H is present, this ratio increases. Plotting against produces the linear relation in Figure 2. A linear fit to the dense region in Figure 2a gives a slope of and an intercept which checks the approximations above, which predict from .


The scatter in Figure 2 grows for fainter galaxies, but sources with H emission also produce asymmetry in the vertical scatter seen in Figure 3 which is a histogram of all the measured H equivalent widths. This was used to disentangle the effects of the emission lines from the observational errors. Above the line, the scatter is larger than below as emission line sources only occur above the line. Absorption line galaxies below the line are weaker with smaller equivalent widths, as demonstrated e.g., by Gómez et al. (2003), so the residuals below the line were used as an approximation for the observational errors and fitted to Gaussians with maxima on the line. Their standard deviations are denoted here by . A function of , was fit by . In Figure 2, the loci of in the photometric error are shown as the dashed curves and sources above this curve were selected as emission line sources.

The measurement of the background correction and the choice of the 2.5 selection are illustrated in Figures 2c and d. Higher redshift galaxies could have emission lines in the 817 nm filter, e.g., 5007 at . Three fields of total area 111.6 arcmin2 displaced about 13 arcmin from the cluster centre were summed. A 2 cut eliminates fewer objects, 3 removes more sources, and the curves remove background sources well as seen in Figure 2c. Consequently, the number of detected objects is taken to lie between these limits as an estimate of the choice for pruning.
Figures 2b and 2d show the objects remaining with the condition that . In all, 2192 objects were detected near the centre of Abell 2465 and 222 emission line objects remained after pruning. In Figure 2a, 137 objects lie below the lower curve. This is more than expected from a Gaussian error distribution and these are expected to represent absorption line sources in the sample.
The spectroscopy in Paper I is neither as extensive nor reaches as faint as the present photometric determinations, 22 measurements of the equivalent width of H can be compared in Figure 4. The photometric measures tend to be the larger and a least squares fit gives . This empirical correction is considered due to the simplifications in deriving the equivalent widths. This and galactic extinction are not applied to the measures in Tables 2.3 and 2, but are used in the SFR estimates in Table 3.

Table 2.3 presents the measurements of the galaxies described. Columns 1 and 2 give the measured (J2000) coordinates. Columns 3 - 6 are the measured and filter magnitudes and their errors from the Sextractor program. Column 7 and 8 are the resulting equivalent widths of H and their errors in Å according to equation 2, positive values denote emission and negative absorption. Column 6 is H flux multiplied by in ergs-1cm-2arcmin-2 units.
| EW H | |||||||||
|---|---|---|---|---|---|---|---|---|---|
| (1) | (2) | (3) | (4) | (5) | (6) | (7) | (8) | (9) | (10) |
| 339.68359 | -5.76283 | 20.004 | 0.011 | 19.238 | 0.046 | 100.5 | 15.8 | 44.38 | 4.82 |
| 339.68852 | -5.77682 | 22.126 | 0.023 | 22.704 | 0.298 | -19.1 | 9.4 | -1.31 | 1.31 |
| 339.69149 | -5.85340 | 22.039 | 0.042 | 24.003 | 1.799 | -50.6 | 102.8 | -3.84 | 2.43 |
| 339.69190 | -5.91493 | 20.835 | 0.022 | 21.010 | 0.183 | 1.3 | 0.5 | 0.29 | 3.89 |
| 339.69195 | -5.92532 | 18.769 | 0.008 | 18.962 | 0.071 | 0.2 | 0.0 | 0.25 | 9.90 |
| 339.69220 | -5.89481 | 22.493 | 0.065 | 21.521 | 0.187 | 140.1 | 118.5 | 6.08 | 2.48 |
| 339.69225 | -5.87150 | 22.284 | 0.038 | 22.619 | 0.366 | -7.8 | 5.4 | -0.46 | 1.77 |
| 339.69318 | -5.80899 | 21.657 | 0.017 | 21.209 | 0.087 | 55.2 | 13.9 | 5.50 | 1.52 |
| 339.69322 | -5.89046 | 19.927 | 0.008 | 20.260 | 0.072 | -7.7 | 1.1 | -3.96 | 3.07 |
| 339.69352 | -5.67319 | 19.771 | 0.008 | 19.749 | 0.054 | 14.7 | 1.8 | 8.57 | 3.65 |
| This table is available in it entirety in machine readable and Virtual Observatory (VO) forms in the online journal. A portion is shown here for guidance regarding its form and content. |
3 The H distribution and star forming rate
The SFR rate is obtained from Kennicutt’s (1998) H calibration. which is sensitive to absorption. Comparisons between H and [OII] and infrared measurements which are less sensitive to reddening indicate that H does not produce systematic errors, but has larger errors, typically varying by 15% to 30% (Moustakas et al. 2006). The distributions of the H galaxies can be compared with those found for continuum sources.
3.1 The H star forming rate in Abell 2465
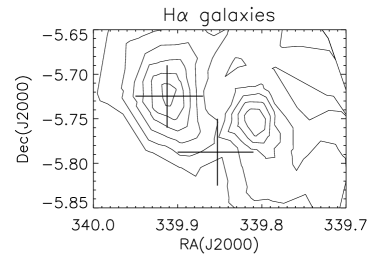
The locations of H emission sources on the sky using the 2.5 cut are in Figures 5 and 6. Due to the double structure of Abell 2465, the subclusters are considered separately and combined for the whole cluster. Both SW and NE components of Abell 2465, have Mpc (Paper I), the 5.2 arcmin circles in Figure 5 centred on the brightest cluster galaxies (BCGs) also lie near the X-ray centres. For the whole cluster, and were defined using standard formulae (e.g., Carlberg, Yee, & Ellingson 1997; Koyama et al. 2010), Mpc and The redshift data in Paper I give km s-1 , so Mpc and shown as the outer dotted circle centred midway between the two BCGs in Figure 5. In the following, and will be used interchangebly.
The Figure 6 isophotes were constructed from the using adaptive kernal smoothing (Silverman 1986) and compare with the continuum luminosity in Paper I. The emission seems displaced from the continuum and X-ray peaks, but closer to the NE component than the SW component.
The three samples derived from the cuts, as emission line galaxies located in Figure 2 using 2, 2.5, and 3 cuts was used to estimate the range in the total H flux, from the selection method. Total values inside were derived for the SW and NE and for the whole cluster defined above, after subtracting the background scaled to the same solid angles.


Using Table 2, the SFR for each entry was calculated, taking the luminosity distance to Abell 2465 as 1224 Mpc and the 817 nm galactic extinction as 0.08 mag. from NED. Including the cosmological correction, to the equivalent widths, the absolute luminosity of H is: L_Hα = 1.55 ×10^56 L_Hα ergs s^-1 cm^-2.
The luminosity function (LF) of , constructed from binning the data is in Figure 7; errors bars are Poisson errors from the number counts and an internal reddening correction for the galaxies is not applied. Bai et al. (2009) and others, e.g., Hwang et al. (2012a) show that the Schecheter (1976) function, Φ(L) = (Φ*L*)( LL*)^αexp(-L/L^*). fits the starforming LF. Bai et al. (2009) showed that a fixed fits a number of galaxy clusters well. Adopting gives in Figure 8. Used as a completeness test of the H data, it shows a low luminosity cutoff limit, which corresponds to SFR = 1.5 M⊙ yr or
For the above, the total luminosity density is the well-known relation with the -finction, , where
However, for a lower non-zero cutoff in , , the total luminosity is: L_x = ∫^∞_xdLLΦ(L) = Φ^*L^*Γ(α+ 2, x), where is the incomplete gamma function.
Knowing and gives and the observed can be corrected for incompleteness. Usually a low luminosity cutoff near 0.3 is chosen (e.g., Bai et al. 2009). For the H data this corresponds to . so the corrected luminosity is L_0.3 = L_xΓ(0.6,0.012)/Γ(0.6,0.063), hence
Table 2 shows the H flux measurements. In the summation of the fluxes, all sources above the cutoff in Figure 7 were included. Column 1 is the cut sample, Columns 2-5 give and their estimated jackknife errors, for each region in erg s-1cm-2 units and Column 5 is the background determination in units of erg s-1 cm-2arcmin-2.

| Sample | WHOLE | SW | NE | Background |
|---|---|---|---|---|
| 1013 | 1013 | 1013 | 1015 arcmin-2 | |
| (1) | (2) | (3) | (4) | (5) |
| 2 | 3.10.6 | 1.20.2 | 1.50.6 | 0.30.1 |
| 2.5 | 2.50.5 | 1.00.2 | 1.250.6 | 0.250.1 |
| 3 | 1.850.4 | 0.80.2 | 0.80.3 | 0.20.1 |
The SFR calculated using Kennicutt (1998), yr-1, also requires a correction for the internal reddening of the galaxies. For the 42 galaxies in Paper I with emission, and the standard interstellar extinction curve (Osterbrock 1989) gives the mean extinction for H of mag., similar to the 1.1 mag. in Kennicutt (1998). Consequently a 1.0 mag. correction was made along with the 0.76 factor in Section 2.3 and the 1.2 factor found above, giving a 2.29 multiplicative correction which was used to get the final values of SFR in Table 3, where Column 1 gives the cut sample, Columns 2-4 give SFR and their errors in yr-1 for the different regions.
| Sample | SW | NE | WHOLE | |
|---|---|---|---|---|
| (1) | (2) | (3) | (4)) | |
| 2 | 27648 | 364161 | 180 | |
| 2.5 | 21762 | 290158 | 533163 | |
| 3 | 17562 | 19799 | 412116 | |
| 4 | 4 | 12 |
The spectroscopic H measurements of galaxies in Table 3 of Paper I give a lower limit to the SFR. They are an incomplete sample of cluster galaxies brighter than . The sum of the H fluxes for the SW + NE components inside their Mpc radii is ergs sec-1 cm-2, or yr-1 for 17 spectroscopically verified cluster members inside the 1.2 Mpc circles in Figure 5.
4 Star formation rate from WISE satellite data
WISE satellite data (Wright et al. 2010; Jarrett et al. 2011; and WISE Explanatory Supplement 333http://wise2.ipac.caltech.edu/docs/release/allsky/expsup/) provide an independent determination of the SFR from infrared dust emission. Stern et al. (2012), Chung et al. (2011), Hwang et al. (2012a), and others have discussed these data for galaxy clusters. At , many cluster members in Abell 2465 are near the limit of WISE and few objects are detected with its 22 m band, so the 12 m and shorter wavelength and bands were employed. Objects with magnitudes 5 or better were selected. Following Jarrett et al. (2011) and Stern et al. (2012), star forming galaxies were chosen with and to eliminate AGNs. The total flux using was calculated as in Hwang et al. (2012a) employing the zero point calibration in Jarrett et al. (2011), 31.674 Jy for a 0 mag. Vega source. The total infrared dust luminosity, , was estimated from the Chary & Elbaz (2001) templates employing a top hat response, using 11.56 m for central wavelength and 5.51 m resolution (Jarrett et al. 2011). A ring of radii 18-28 arcmin centred on the cluster was used to estimate the background. The SFR was calculated using SFR = 1.72 ×10^-10(L_IR/L_⊙) M_⊙ yr^-1 which is Kennicutt’s (1998) relation for a Salpeter initial mass function (IMF). Chen et al. (2013) note that the Chabrier (2003) initial mass function lowers SFR by about 1.6. Hwang et al. (2012a, b) show that the SFRs from the spectral energy distribution fitting to the WISE flux densities of galaxies agree with those from optical spectra,
The IR luminosity function for the whole cluster is shown in Figure 8 fitted with as in Section 3, with The cutoff corresponding to the selection limit is at SFR = 2.5 M⊙yr-1 which is shown in the diagram and corresponds to

The binned number counts and Poisson errors is in Figure 8 where there is a cutoff below , which corresponds to yr-1 at Abell 2465. The total to 0.3 yr-1, for comparison with that of H and other clusters in the literature, is again calculated using: L_0.3 = Γ(0.6, 0.055)/Γ(0.6, 0.51)L_IR = 2.15 The SFR using this method for the same three cluster divisions as defined for H are in Table 4. Considering the observational uncertainties of the two methods, the agreement between Tables 3 and 4, which is better than a factor of two, seems satisfactory.
| Sample | SW | NE | WHOLE |
|---|---|---|---|
| (1) | (2) | (3) | (4)) |
| SFR (M⊙yr | 20675 | 445142 | 890114 |
| No objects | 42 | 52 | 127 |
5 Comparison with other galaxy clusters
5.1 Projected distribution of the SF galaxies
The galaxy counts herein have been made inside and for SFR M⊙yr-1, but many authors employ 0.5 and alternate cutoffs for SFR. As shown above, a correction for the different SFR cutoffs can be made assuming the form of , but a conversion for the different choise of radius depends on how the SFR changes within the cluster, and as suggested by many investigators, it may not obey the mass profile. Figure 9 shows the accumulated projected sum of the H and IR SFR in Abell 2465, after background subtraction, within a given radius for the cluster as a whole and for the SW and NE sub-clusters. Although the H SFR in the SW region appears weakly more concentrated, the star forming galaxies in Abell 2465 do not follow the NFW profile found for the -band light in Paper I. Defining the factor to be the ratio of projected galaxies inside 0.5 to those inside , K = ∑SFR (0.5R_200)/∑SFR (R_200) ≈0.4. This result seems to confirm Chung et al. (2011) using WISE and Webb et al. (2013) employing Spitzer Multiband Imaging Photometer for Spitzer (MIPS) data. For an NFW profile with a concentration parameter (Łokas & Mamon 2001) and for a uniformly filled circle, This agrees with the finding that star forming galaxies are less concentrated to the centres of their clusters (e.g., Rines et al. 2005, Koyama et al. 2010; Webb et al. 2013; Muzzin et al. 2012).
5.2 Position of Abell 2465 in the redshift and mass relations
Studies of the SFR in galaxy clusters employing optical and infrared data over a range of redshifts include Finn et al. (2005), Bai et al. (2007; 2009), Koyama et al. (2010), Chung et al. (2011), Biviano et al. (2011), Shim et al. (2011), Popesso et al. (2012), and Webb et al. (2013). The total SFR normalized by the cluster mass, has been compared with redshift, and total . There is considerable scatter in these relations; often clusters without marked substructure are mixed with interacting ones.
¿From Tables 3 and 4, in Abell 2465 is plotted against and in Figure 10. Several studies, following Finn et al. (2005), have found relations between and redshift: (Koyama et al. 2010), (Bai et al. 2007; 2009) with similar results by Biviano et al. (2011) and Popesso et al. (2012) who obtained a relation. These empirical functions generally give similar fits to the data when allowance is made for their different radial and SFR cutoffs. Figure 10a plots the components of Abell 2465 with the relation of Webb et al. (2013) which uses galaxies within , but has been corrected to account for their 3 M⊙yr-1cutoff compared to 0.3 M⊙yr-1in this paper. In this case, both sub-components of Abell 2465 and the cluster taken as a whole lie above the mean relation by a factor of .
For the mass dependence, the situation is more complicated. The scatter is larger and is less well determined compared to . Also must be converted for redshift as well as cutoff. Finn et al. (2005) suggested an inverse relation between SFR and and Bai et al. (2007) found a decline. Figure 10b shows the Abell 2465 data with the curve from Webb et al. (2013) which has been converted from and SFR M⊙yr-1 to and 0.3 M⊙yr-1. The SFR for all components is at least an order of magnitude above the mean relation.
Although the scatters in the relations are large, Abell 2465 indicates a higher SFR for its redshift and mass. For comparison, three additional galaxy clusters are plotted in Figure 10. For details on other galaxy clusters, the reader is referred to the references above. The Bullet Cluster (Chung et al. 2010) and Cl0024+1654 (Bai et al. 2007; Umetsu et al. 2010) are both considered merging systems and also show enhanced SFR. By contrast, the Coma Cluster (e.g., Finn et al. 2005; Bai et al. 2007) is a relatively symmetrical and quiet galaxy cluster and it lies lower in Figure 10. This adds to the evidence that interacting clusters can have a higher SFR and suggests that a cluster’s dynamical state cluster is an additional parameter in these plots.


6 Morphologies of the strongest H sources
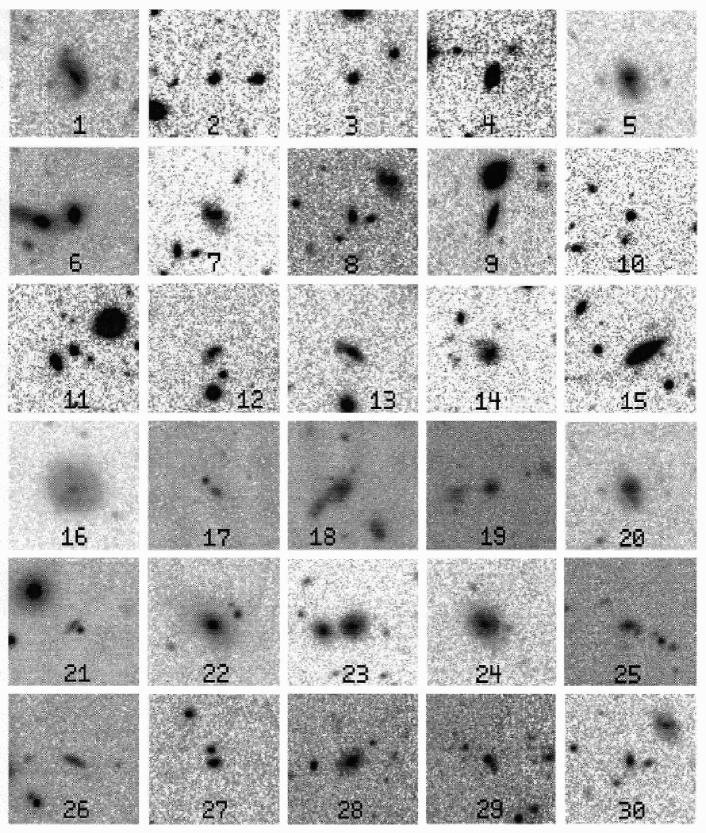
Thirty strong H emission line sources in Table 2.3 are shown in Figure 11 in 20 arcsec square (77 kpc) sections. These are from the CFHT image described in Paper I with FWHM = 0.47 arcsec seeing. Figure 12 is similarly a sample of 25 among the brightest IR WISE sources found here. Although a census of morphological types for the smaller galaxies in Abell 2465 using the currently available resolution seems outside the scope of this paper, many of these H sources appear to be interacting or have a disturbed appearance. Examples in Figure 11 include 8, 11, 12, 14, 18, 19, 25, and 30 which may be multiple mergers. Further binary mergers could include the systems 6, 9, 10, 13, 17, 23, 27, and 29, while 1, 5, 7, 15, 16, 20, and 24 appear disturbed and asymmetrical.
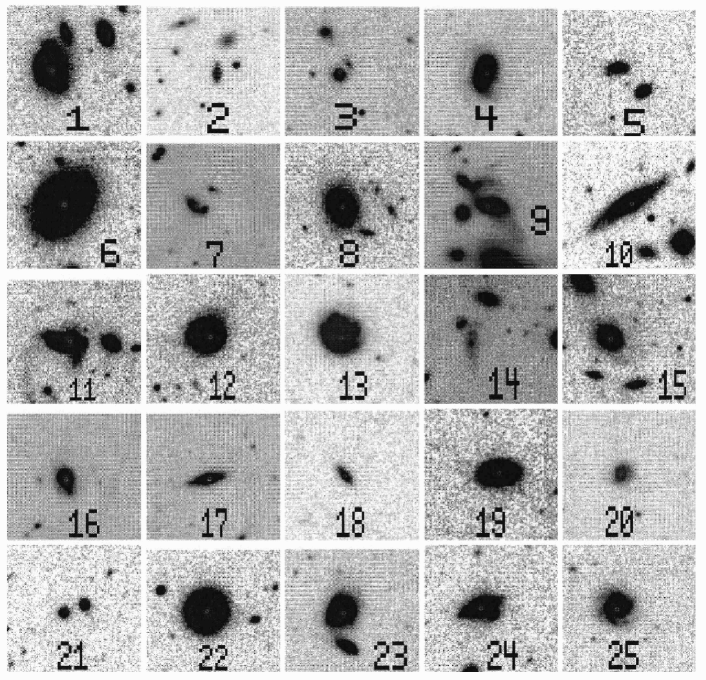
For WISE IR sources without redshifts, the interpretation is more difficult. Although for the H sources, the likelihood that a bright redshifted line, e.g., 5077 at would fall in the bandpass of the H filter is under a few percent (e.g., Kellar et al. 2012), the distances to the IR sources is unrestrained and although a background correction was made for the whole sample, individual galaxies could be in the fore- or background. As a result, all galaxies in, except number 7, in Figure 12 were chosen to be either H detections or spectroscopic redshifts placing them in Abell 2465. Objects that appear interacting (4, 7, 9, 11, 14), have a possible companion (1, 2, 3, 5, 21, 23) or seem disturbed (2, 3, 13, 18, 20, 24) in some way.
Many of the H and IR sources are not detected congruently. This appears to be because many of them are faint and close to the detection limits of the H survey and WISE which are different. The H data reach fainter sources than WISE IR ( M⊙yr-1 compared to M⊙yr-1). On the one hand, objects detected only in H would have weaker IR, but on the other hand, sources found only in the IR are likely to be very dusty and hide the H and shorter wavelengths of light. This is indicated from comparisons between the H and IR SFR which show that the IR can give the higher value (e.g., Hopkins et al. 2001; Bai et al. 2007), although in general H and IR flux densities correlate well (Kennicutt et al. 2009).
7 The and observations
Abell 2465 was observed 2009 October 14-18 through Johnson filters with the 4K CCD camera444Details of this instrument can be found at: http://www.astronomy.ohio-state.edu/MDM/MDM4K attached to the 1.3 m telescope at the MDM Observatory. This device has 40642 pixels and covers 21.3 arcmin 21.3 arcmin. The gain was 2.3 ADU with a readout noise of 5 e-. At readout, 2 2 pixel binning was employed yielding 0.63 arcsec per pixel. All images were inspected to reject guiding jumps, a problem with the 1.3 m telescope, and 45 ten minute exposures of the cluster in and 30 in were secured at airmasses less than 1.5, yielding total summed integrations of 27000 s and 18000 s in and respectively. Stars in both and final images have FWHM = 2.1 arcsec. Data reductions used IRAF as above, viz. bias subtraction, flatfielding from dome flats, and cosmic ray rejection.
The images were calibrated to the Johnson system using standard stars in the SA92 field (Landolt 1992) observed with airmasses of 1.17 to 2.06 on the photometric nights of 2009 October 15, 16, and 17 giving extinction coefficients of and A colour transformation, , was found from standard stars with and applied to the data. Equatorial coordinates were obtained as above using IRAF and the USNO-b catalogue.
Photometry was made with SExtractor (Bertin & Arnouts 1996), first measuring the deeper image with the single image mode and second finding corresponding objects in the image by running the double image mode.
Abell 2465 is included in the DR9 of the SDSS (Ahn et al. 2012). Whilst its and data cover brighter cluster members, the measurements have errors about twice those of our measurements. Consequently, the current data and the SDSS are used.


7.1 Colour-magnitude diagrams
7.1.1 Spectroscopically verified cluster members
Galaxies with redshifts consistent with membership in Abell 2465 are in Table 2 of Paper I. We matched the measurements with the SDSS DR9 data. The diagram in Paper I from CFHT data shows a well defined red sequence. Figures 13 and 14 show the and the diagrams for spectroscopically verified members and H sources within Mpc. In Figure 13, the spectroscopic sample of Paper I, which covers a larger arcmin2 region, is compared to galaxies for which H was measured. The spectroscopic sample was primarily selected using the red sequence which resulted in most objects being redder than in Figure 13a. Possible members in the SW or NE subclusters are assigned different symbols, but no significant differences in their distributions are seen. The galaxies with H in the 2.5 sample are in Figure 13b where a weaker red sequence and more fainter objects bluer than are evident.
7.1.2 The cluster’s blue fraction from using the data
The measurements are useful for comparing the blue fractions of Abell 2465 determined for field galaxies and other galaxy clusters. The blue fraction determined from the data is taken to be another indicator of the star formation activity. For this section, the whole cluster as defined in Sections 3 and 4 will be studied. The blue fraction, is defined as , where and are respectively the numbers of blue (late-type) galaxies counted within in the cluster and a comparison field; and are the corresponding numbers of all galaxies in the two areas. Goto et al. (2003) give an expression for the error, , in terms of these quantities.
The evolution of with has been extensively studied and its rise with and relation to other cluster properties are well known (e.g., Margoniner et al. 2001; Goto et al. 2003; De Propris et al. 2004; Tovmassian, Plionis & Andernach 2004; Martinez et al. 2006; Blanton 2006; Gerke et al. 2007).
The measurements of Abell 2465 can be compared with field galaxies. Using and , Cooper et al. (2008) examined field galaxies. For low they divided the red and blue sequences using the restframe division of Willmer et al. (2006): (U-B) = -0.032(M_B+21.52)+0.204 This uses the Vega system (also Baldry et al. 2004). Galactic extinctions in NED for Abell 2465 and terms from Fukugita et al. (1995) and Blanton & Roweis (2007) were applied. The measurements reach fainter than the as seen in Figure 14b corresponding to a limit of mag. Using a distance modulus of 40.44 mag., this is equivalent to mag. The vertical dotted line at mag. cuts the data and gives a colour independent magnitude limited sample from which, the blue galaxy fraction is obtained. For the data, the region centred on the cluster covers 78.9 arcmin2 and two background regions of area 114.7 arcmin2 centered at (: (339.73, -5.74) and (339.90, -5.92) were used. This yields .
A further estimate, of was obtained following Goto et al. (2003) from the SDSS DR9 and data and also Margoniner et al. (2001). Galaxies were selected within (6.09 arcmin). All objects were assumed to have , were corrected for galactic extinction and -terms. Galaxies fainter than = -19.44 mag. were excluded and the division between red and blue sequences was .
Due to the cluster’s elongated shape, rather than a circular annulus, two background regions of diameter 5.0 arcmin centered at ): (339.6, -5.5) and (340.1, -6.0) degrees were employed and yields .
Noting that systematic errors arise between different galaxy samples and analysis methods, the estimates of and for Abell 2465, are compared with the average for field galaxies and galaxy clusters at its redshift of . For the field, Cooper et al. (2008) would indicate . For galaxy clusters, (Margoniner et al. 2001), while Goto et al. (2003) find and . De Propris et al. (2004) derive for spectroscopic cluster members from Two-degree Field Galaxy Redshift Survey (2dFGRS) data for a somewhat lower redshift range. Defining the richness of the cluster (Goto et al. 2003) as the number of galaxies corrected for the background within 0.7 Mpc brighter than mag., the richness number of Abell 2465 is 70 and the correlations for richness of Goto et al. (2003) would put the expected and lower than the mean relations. Although the scatters in these relations are large, Abell 2465 exceeds the mean relations. Taking and as indicators of star formation activity also suggests an increased rate in Abell 2465.


8 Discussion of possible star formation mechanisms
Observations and simulations both show that in galaxy clusters, galaxies can rapidly undergo morphological changes. Most interactions in galaxy clusters decrease SFR, which drops with lowering redshift and increasing local density due to a range of quenching effects. Galaxies are stripped of gas and without renewal of a fresh supply, the SFR rapidly dies.
So what can trigger the apparent SFR excess in some of the double galaxy clusters? Galaxy evolution processes have been explored extensively in many studies and reviews (e.g., Moore 2004; Boselli & Gavazzi 2006; Park & Hwang 2009; Cattaneo et al. 2011). These processes are of two basic types: either dynamical, involving collisional or tidal interactions, or hydrodynamical stripping. Although each could operate under proper conditions, observations argue that the hydrodynamical processes are often most important. Nearby dynamical interactions could enhance SF while hydrodynamical ones would quench it.
The operation of ram pressure stripping during mergers is complicated (Quilis, Moore, & Bower 2000; Bekki 1999; 2013). Simulations sometimes indicate that star formation in galaxies, although usually diminished can be enhanced, depending on the inclinations and directions of their motion in the cluster although this is probably not a major effect (Mastropietro, Burkert, & Moore 2008). Vijayaragharan & Ricker (2013) simulated galaxy groups passing through a larger cluster and predict that ram pressure ’pre-processing’ operating as far as can reduce SFR. The interactions and SFR can thus only be before the first passage through pericentre.
The conditions in major mergers involving galaxy cluster collisions differ from single galaxy clusters as high velocities are possible when the cluster centres pass each other and the large-scale collisional velocities are added to the motions of the galaxies in each cluster. The evolution of the double density structures of the merging clusters would produce a time variable potential, so it is of interest to reconsider dynamical processes that increas SFR. Many galaxies in Figures 11 and 12 appear to be interacting or disturbed. Merging is limited to distances, regions, and times when galaxies pass below a maximum velocity and mergers of the two different galaxy families are only possible when the two overlapping clusters have low enough relative velocity. A simple estimate for head-on mergers (Binney & Tremaine 1987) is that velocity, , be below , where and is the galaxy’s internal mean square velocity. For a representative velocity dispersion of km s-1 , km s-1 . Parabolic encounters can merge at larger separations, but rapid merging is limited to , where is the galactic median radius.
When the clusters pass through one another velocities could reach thousands of km s-1 ; in many cases is expected and multiple high speed passages, or harassment (Moore et al. 1996) should operate. Many of the objects shown in Figures 11 and 12 seem to have the properties of harassed galaxies. Since SF requires that the galaxies are not stripped of their gas supply, this limits it to the outer regions of the clusters where many galaxies are falling inward for the first time. The radial distribution of the SF galaxies in Figure 9 is not as peaked as an NFW profile and would be consistent with their being distributed in the outer regions of the cluster.
Park & Choi (2009) considered the role of impact interactions between galaxies and the larger scale density distribution in clusters. They indicate that galaxy-galaxy collisions will only be important within a limiting radius and that there is only a weak dependence of galaxy properties on the large-scale density. This seems to be confirmed, e.g., by Patton et al. (2013) and others who find that enhanced star formation effectively stops beyond a projected separation of kpc in a given galaxy pair.
9 Conclusions
The goal of this investigation was to determine how the merging of the double components of the Abell 2465 galaxy cluster affects the star formation. Consequently the H and IR emission of cluster galaxies was measured and converted to SFR and as check, the blue fraction of galaxies was measured. From this we draw the following conclusions.
(1) Comparing Abell 2465 with other galaxy clusters for which star formation rates have been measured using the mass normalized SFR, , where is the total mass inside the virial radius, taken here to be . Using the available relations as a function of redshift and and , the SW and NE subclusters and the cluster taken as a whole, show an excess of star formation. This places Abell 2465 in the regions of the diagrams with other merging galaxy clusters and suggests that the dynamics of the interaction affect the position of a cluster placing them higher in the and diagrams.
(2) Observations in the and bands were obtained of Abell 2465. From the magnitude limited sample, the blue fraction of galaxies is 0.53 0.02, compared to a value which would be expected for the field galaxies near 0.2 also indicating a higher star formation rate. Using from the SDSS gives similar results.
(3) The distribution of the star formation,H and IR sources, is less concentrated to the centres of the clustar than is the mass which tends to follow an NFW distribution.
(4) The morphologies of the strongest infrared and H sources often show evidence of interactions. From a consideration of the high velocities possible in the passage of the two clusters and the strong general evidence for gas stripping in clusters, it is considered likely that harassment of galaxies in the outer regions of the clusters is operating.
Fundamental to interpreting these observations is knowing whether the merger of the subclusters of Abell 2465 has passed or still lies in the future. Unlike hotter and closer cluster pairs such as the ’Bullet Cluster’ and Cl0024+1658 where the intergalactic gas observed in X-rays is hot, the projected separation of the SW and NE centres (5.5 Mpc) and the lower X-ray temperature 4 keV (Paper I). It is hoped that X-ray and weak lensing studies now underway will help resolve some of these questions.
Acknowledgements
Some imaging data in this paper were based on observations obtained with MegaPrime/MegaCam, a joint project of CFHT and CEA/DAPNIA, at the Canada-France-Hawaii Telescope (CFHT) which is operated by the National Research Council (NRC) of Canada, the Institut National des Science de l’Univers of the Centre National de la Recherche Scientifique (CNRS) of France, and the University of Hawaii. This work is based in part on data products produced at TERAPIX and the Canadian Astronomy Data Centre as part of the Canada-France-Hawaii Telescope Legacy Survey, a collaborative project of NRC and CNRS. I thank the Canadian TAC for granting the time and the QSO team for obtaining the imaging data. This research has made use of the NASA/IPAC Extragalactic Database (NED) which is operated by the Jet Propulsion Laboratory, California Institute of Technology, under contract with the National Aeronautics and Space Administration. Many thanks to Dr. Dane Owen who helped with the imaging at MDM Observatory.
References
- [] Ahn C. P. et al. 2012, ApJS, 2013, 21
- [] Bai L. et al. 2007, ApJ, 664, 181
- [] Bai L., Rieke G. H., Rieke M. J., Christlein D., Zabludoff A. I. 2009, ApJ, 693, 1840
- [] Baldry I. K., Glazebrook K., Brinkmann J., Ivesić Ž., Lupton R. H., Nichol R. C., Szalay A. S. 2004, ApJ, 600, 681
- [] Balogh, M. et al. 2004, MNRAS, 348, 1355
- [] Bekki K. 1999, ApJ, 510, L15
- [] Bekki K. 2013, arXiv1311.3010
- [] Bertin E., Arnouts S. 1996, A&AS, 117, 393
- [] Binney J. & Tremaine S. 1987, Galactic Dynamics (Princeton: Univ Princeton Press) pp. 454 - 456
- [] Biviano A., Fadda D., Durret F., Edwards L. O. V., Marleau F. 2011, A&A, 532, A77
- [] Blanton M. R. 2006, ApJ, 648, 268
- [] Blanton, M. R., Roweis, S. 2007, AJ, 133, 734
- [] Boselli A., Gavazzi G. 2006, PASP, 118, 517
- [] Bourdin H. et al. 2011, A&A, 57, A21
- [] Burgettt W. S. 2004, MNRAS, 352, 605
- [] Canning R. E. A. et al. 2012, MNRAS,420, 2956
- [] Carlberg R. G., Yee H. K. C., Ellingsen E.1997, ApJ, 478, 462
- [] Cattaneo A., Mamon G. A., Warnick K., Knebe A. 2011, A&A, 533, A5
- [] Chabrier G. 2003, PASP, 115, 763
- [] Chary R., Elbaz D. 2001, ApJ, 556, 562
- [] Chen C.-T. et al. 2013, ApJ, 773, 3
- [] Cohen S. A., Hickox R. C., Wegner G. A., Einasto M., Vennik J. 2014, ApJ, 783, 186
- [] Cohen S. A., Hickox R. C., Wegner G. A. 2014, preprint
- [] Corteses L., Gavazzi G., Boselli A., Iglesias-Parmo J., Carrasco L. 2004, A&A, 425, 429
- [] Chung S. M., Gonzalez A. H., Clowe D., Zaritsky D., Markevitch M., Jones C. 2009, ApJ, 691, 963
- [] Chung S. M., Gonzalez A. H., Clowe D., Markevitch K., Zaritsky D. 2010, ApJ, 725, 1536
- [] Chung S. M., Eisenhardt P. R., Gonzales A. H., Stanford S. A., Brodwin M., Stern D., Jarrett T. 2011, ApJ, 743, 34
- [] Cooper M. C. et al. 2008, MNRAS, 383, 1058
- [] Dawson W. A. et al. 2012, ApJ, 747, L42
- [] De Propris R. et al. 2004, MNRAS, 351, 125
- [] Ferrari C., Benoist C., Maurogordato S., Cappi A., Slezak E. 2005, A&A, 430, 19
- [] Finn R. A. et al. 2005, ApJ, 630, 206
- [] Fujita S. S. et al. 2003, ApJ, 586, 115
- [] Fukugita, M., Shimasaku, K., Ichikawa, T. 1995, PASP, 107, 945
- [] Geller M. J., Beers T. C. 1982 PASP, 94, 421
- [] Gerke B. F. et al. 2007, MNRAS, 376, 1425
- [] Gnedin O. Y. 2003a, ApJ, 582, 141
- [] Gnedin O. Y. 2003b, ApJ, 589, 752
- [] Gómez P. L. et al. 2003, ApJ, 584, 210
- [] Goto T. et al. 2003, PASJ, 55, 739
- [] Hopkins A. M., Connolly A. J., Haarsma D. B., Cram L. E. 2001, AJ, 122, 288
- [] Hwang H. S., Geller M. J., Diaferio A., Rines K. J. 2012a, ApJ, 752, 64
- [] Hwang H. S., Geller M. J., Kurtz M. J., Dell’Antonio I. P., Fabricant, D. G. 2012b, ApJ, 758, 25
- [] Hwang, H. S., Lee, M. G. 2009, MNRAS, 397, 2111
- [] James P. A. 2004, A&A, 414, 23
- [] Jarrett T. H. et al. 2011, ApJ, 735, 112
- [] Kellar J. A., Salzer J. J., Wegner G., Gronwall C., Williams A. 2012, AJ, 143, 145
- [] Kennicutt R. C., Jr. 1983, ApJ, 272, 54
- [] Kennicutt R. C., Jr. 1998, ApJ, 498, 541
- [] Kennicutt R. C., Jr, Kent S. M. 1983, AJ, 88, 1094
- [] Kennicutt R. C., Jr. et al. 2009, ApJ, 691, 1828
- [] Kodama T., Balogh M. L., Smail I., Bower R. G. 2004, MNRAS, 354, 1103
- [] Koyama Y., Kodama T., Shimasaku K., Hayashi M., Okamura S., Tanaka I., Tokoku C. 2010, MNRAS, 403, 1611
- [] Laganá T. F. Neto G. B. L., Andrade-Santos F., Cypriano E. S. 2008, A&, 485, 633
- [] Landolt A. U. 1992, AJ, 104, 340
- [] Le Floc’h E. et al. 2005, ApJ, 632, 169
- [] Łokas, E. L., Mamon, G. A. 2001, MNRAS, 321, 155
- [] Ma C.-J., Ebeling H., Marshall P., Shrabback T. 2010, MNRAS, 406, 121
- [] Martig M., Bournand F. 2008, MNRAS, 385, L38
- [] Martinez H. J., Zandevarez A., Dominguez M., Merchán M. E., Lambas D. G. 2002, MRAS, 333, 31
- [] Martinez H. J., O’Mill A. L., Lambas D. G. 2006, MNRAS, 372, 253
- [] Margoniner V. E., de Carvalho R. R., Gal R. R., Gjorgovski S. G. 2001, ApJ, 548, 143
- [] Matropetro C., Burkert A. 2008, MNRAS, 389, 967
- [] Mastropietro C, Burkert A., Moore B. 2008, PASA, 25, 138
- [] Miller N. A. 2005, AJ, 130, 2541
- [] Miller N. A., Owen F. N. 2003, AJ, 2427
- [] Moore B. 2004, in Carnegie Observatories Astrophysics Series, Vol. 3, Clusters of Galaxies: Probes of Cosmological Structure and Galaxy Evolution, ed. J. S. Mulchaey, A. Dressler, A. Oemler (Cambridge: Cambridge Univ. Press), p. 295
- [] Moore B., Katz N., Lake G., Dressler A., Oemler A. 1996, Nature, 379, 613
- [] Morioka T., Nakajima A., Taniguchi Y., Shioya Y., Murayama T., Sasaki S. S. 2008, PASJ, 60, 1219
- [] Moustakas J., Kennicutt R. C. Jr., Tremonti C. A. 2006, ApJ 642, 775
- [] Muzzin A. et al. 2012, ApJ, 746, 188
- [] Osterbrock,D. E. 1989, Astrophysics of Gaseous Nebulae and Active Galactic Nuclei (Mill Valley: University Science Books)
- [] Owers M. S., Randall S. W., Nulsen P. E. J., Couch W. J., David L. P, Kempner J. C. 2011, ApJ, 728, 27
- [] Park C., Choi Y.-Y. 2009, ApJ, 691, 1828
- [] Park C., Hwang H. S. 2009, ApJ, 699, 1595
- [] Patton D. R., Torrey P., Ellison S. L., Mendel T., Scudder J. M. 2013, MNRAS, 433, 59
- [] Planelles S., Quilis V. 2009, MNRAS, 399, 410
- [] Poole G. B., Babul A., Mcarthy I. G., Sanderson I. G. R., Fardal M. A. 2008, MNRAS, 391, 1163
- [] Popesso P. et al. 2012, A&A, 537, 58
- [] Quilis V., Moore B., Bower R. 2000, Science, 288, 1617
- [] Rawle T. D. et al. 2010, A&A, 518, L14
- [] Rawle T. D. et al. 2014, MNRAS, 442, 196
- [] Ricker P. M. 1998, ApJ, 496, 670
- [] Ricker P. M., Sarazin C. L. 2001, ApJ, 561, 621
- [] Rines, K., Geller, M. J., Kurtz, M. J., Diaferio, A. 2005, AJ 130, 1482
- [] Ritchie P. W. Thomas P. A. 2002, MNRAS, 239, 675
- [] Roettiger K., Loken C., Burns J. O. 1996, ApJ, 473, 651
- [] Roettiger K., Loken C., Burns J. O. 1997, ApJS, 109, 307
- [] Russell H. R. et al. 2010, MNRAS, 406, 721
- [] Salzer J. J., Lee J. C., Melbourne J., Hinz J. L., Alonso-Herrero A., Jangren A. 2005, ApJ, 624, 661
- [] Schechter, P. 1976, ApJ, 203, 297
- [] Shim H. et al. 2011, ApJ, 727, 14
- [] Shioya Y. et al. 2008, ApJS, 175, 128
- [] Silverman, B. W. 1986, Density Estimation for Statistics and Data Analysis, Chapman and Hall, London
- [] Springel V., Farrar G. R. 2007, MNRAS, 380, 911
- [] Stern D. et al. 2012, ApJ, 753, 30
- [] Tazikawa M. 2000, ApJ, 532, 183
- [] Tovmassian H. M., Plionis M., Andernach H. 2005, ApJ, 617, L111
- [] Tresse L., Maddox S., Loveday J., Singleton C. 1999, MNRAS, 310, 262
- [] Tresse L., Maddox S., LeFevre O., Cuby J.-G. 2002, MNRAS, 337, 369
- [] Umetsu K., Medezinski E., Broadhurst T., Zitrin A., Okabe N., Hsieh, B-C., Molnar S. M. 2010, ApJ, 714, 1470
- [] van Dokkum P. 2001, PASP, 113, 420
- [] Vijayaragharan R., Ricker P. M. 2013, MNRAS, 435, 2713
- [] Webb T. M. A. et al. 2013. AJ, 146, 84
- [] Wegner G. A. 2011, MNRAS, 413, 1333
- [] Werk J. K. et al. 2010, AJ, 139, 279
- [] Westra E., Jones J. P. 2008, MNRAS, 383, 339
- [] Willmer C. N. A., et al. 2006, MNRAS, 383, 1058
- [] Wright E. L. et al. 2010, AJ, 140, 1868