Intra-cluster Globular Clusters in a Simulated Galaxy Cluster
Abstract
Using a cosmological dark matter simulation of a galaxy-cluster halo, we follow the temporal evolution of its globular cluster population. To mimic the red and blue globular cluster populations, we select at high redshift two sets of particles from individual galactic halos constrained by the fact that, at redshift , they have density profiles similar to observed ones. At redshift , approximately 60% of our selected globular clusters were removed from their original halos building up the intra-cluster globular cluster population, while the remaining 40% are still gravitationally bound to their original galactic halos. Since the blue population is more extended than the red one, the intra-cluster globular cluster population is dominated by blue globular clusters, with a relative fraction that grows from 60% at redshift up to 83% for redshift . In agreement with observational results for the Virgo galaxy cluster, the blue intra-cluster globular cluster population is more spatially extended than the red one, pointing to a tidally disrupted origin.
Subject headings:
galaxies:clusters:general - galaxies:star clusters:general - methods:numerical1. Introduction
Galaxy clusters are extreme environments in which galaxies are subject to both strong mutual interactions and intense tidal force generated by the central gravitational potential of the cluster. These processes have a dramatic impact on galaxy morphology and their intrinsic properties such as stellar mass, gas content, star formation rate, colors, etc. (Dressler 1980, Goto et al. 2003, Coenda et al. 2006, Coenda and Muriel 2009). Tidal stripping removes mass from individual galaxies, which becomes part of the intra-cluster medium as it is bound to the central potential of the cluster (Moore et al., 1999).
Diverse observational evidence points to the presence of stellar material removed from galaxies in the intra-cluster medium. Durrell et al. (2002) identified red giant star candidates in the intra-cluster medium of the Virgo galaxy cluster. In nearby galaxy clusters, there is evidence of the presence of planetary nebulae in the intra-cluster medium (Méndez et al., 1997; Gerhard et al., 2007; Castro-Rodriguéz et al., 2009; Longobardi et al., 2013), novae (Neill et al., 2005) and supernovae (Gal-Yam et al., 2003; Sand et al., 2011; Graham et al., 2015). Stars that have been removed from their parent galaxy can be observed in galaxy clusters as a diffuse light, called intra-cluster light. However, its observational detection is very difficult due to the extremely low surface brightness of the intra-cluster light, which contains of the total optical luminosity of the galaxy clusters (Gregg and West, 1998; Feldmeier et al., 2002; Mihos et al., 2005; Krick and Bernstein, 2007; Burke et al., 2012; Mihos, 2015).
Globular cluster systems are one of the more extended baryonic components of galaxies, so it is expected that these objects will be especially prone to being removed by tidal stripping. White (1987), was the first author to hypothesize the existence of intra-cluster globular clusters; i.e. globular clusters that are no longer bound to individual galaxies. West et al. (1995) suggested that a large intra-cluster globular cluster population could explain the high specific frequency values for large ellipticals in the centers of clusters. A small number of intra-cluster globular clusters have been confirmed in the Virgo () (Williams et al., 2007) and Fornax galaxy clusters () (Bassino et al., 2003; Bergond et al., 2007; Schuberth et al., 2008). Coenda et al. (2009) analyzed the of early type galaxies in Virgo and found that larger values are at greater cluster-centric distances. They suggested that galaxies closer to the Virgo center are losing a significant fraction of their globular clusters due to tidal stripping. The first statistically significant detection of intra-cluster globular clusters was carried out by Lee et al. (2010), estimating that there are about intra-cluster globular clusters in Virgo. Peng et al. (2011) identified globular clusters in the Coma galaxy cluster, finding intra-cluster globular clusters inside a radius of from its center. Those authors estimated that about 30% to 40% of globular clusters in Coma are intra-cluster globular clusters. West et al. (2011) confirmed the presence of globular clusters in the Abell 1185 galaxy cluster that apparently are not bound to any galaxy. Recently, Harris and Mulholland (2017) estimate intra-cluster globular clusters in the Perseus cluster, with a radial distribution extending several kiloparsecs away from the cluster center.
The are several studies in slightly more distant clusters. Alamo-Martínez et al. (2013) identified intra-cluster globular clusters within the central in Abell 1689. D’Abrusco et al. (2016) found an asymmetric structure that links the globular cluster system of NGC 1399 with near galaxies in the Fornax galaxy cluster. Lee and Jang (2016) identified globular clusters and Ultra Compact Dwarf (UCD) galaxies in Abell 2744, finding intra-cluster globular clusters. Those authors found that intra-cluster globular clusters have a number density profile steeper than the dark matter profile.
From the theoretical point of view, Yahagi and Bekki (2005) used a cosmological N-body numerical simulation and randomly selected dark matter particles as globular clusters inside galactic halos. They found that nearly 30% of globular clusters inside a galaxy cluster are intra-cluster globular clusters and that a small fraction of globular clusters removed from their halo can be found outside the virial radius of the galaxy cluster (inter-cluster globular clusters). Bekki and Yahagi (2006) obtained similar results, finding that between 20% and 40% of total globular clusters inside a galaxy cluster are intra-cluster globular clusters with a density profile that is steeper than the dark matter profile. In Ramos et al. (2015), we used a dark matter-only numerical simulation to study tidal stripping of globular clusters in galaxies orbiting a galaxy cluster. We found that halos lose on average 29% (16%) of blue (red) globular clusters, and that the fraction of globular clusters that are removed from an individual halo depends strongly on the orbital trajectory.
The intra-cluster globular clusters are mostly metal-poor, with colors typical of globular clusters of dwarf galaxies, and they are found even far from massive galaxies (Lee et al., 2010; Peng et al., 2011; Alamo-Martínez et al., 2013; Durrell et al., 2014). Bekki and Yahagi (2009) argue that intra-cluster globular clusters are formed as a result of tidal stripping of globular clusters, initially within galaxy-scale halos during hierarchical growth of clusters via halo merging. Lee et al. (2010) suggest a mixture scenario for the origin of globular clusters: metal-poor globular clusters would form in low-mass dwarf galaxies and metal-rich globular clusters would form later in massive galaxies or in dissipational merging galaxies. Alternatively, several authors suggest that intra-cluster globular clusters were formed in intra-cluster medium through gravitational instability of primordial density fluctuations, without ever residing in galaxies Yahagi and Bekki (2005); Griffen et al. (2010). Another possibility about the origin of intra-cluster globular clusters is that they form in thermal instabilities in cooling flows and gas-rich environments (Cen, 2001; Griffen et al., 2010).
Using a cosmological N-body numerical simulation in the framework of the Cold Dark Matter model, we study the blue and red intra-cluster globular cluster populations in a Virgo-like galaxy cluster. The aim of this work is to test whether the loss of globular clusters by gravitational interactions can explain the observed population of intra-cluster globular clusters. In section 2 we describe the methods that we applied in order to mimic the globular cluster population. In section 3 we present the main results about intra-cluster globular cluster populations. Finally in 4 we summarize the results and conclusions.
2. Methods
2.1. Numerical Simulation
As in Ramos et al. (2015), we use a dark matter-only cosmological numerical simulation that follows the formation of a Virgo-like galaxy cluster-sized halo (the halo labeled ”h14” in Table 1 of Ludlow et al. (2010)). Briefly, the simulation was performed using the GADGET2 code (Springel, 2005) in a cosmological box of 100 comoving on a side, assuming the following cosmological parameters: , and . Then, the region was resimulated at a higher resolution using the zoom-in technique of Klypin et al. (2001), which has dark matter particles with masses of and a gravitational softening of . At redshift the halo has a virial mass , which corresponds to a virial radius of ; i.e. the radius where the inner mass density is 200 times the critical mass density of the universe. There are dark matter particles within the virial radius and its shape is fairly close to spherical with normalized semi-axis ratios given by and . Using the SUBFIND algorithm (Springel et al., 2001), Ludlow et al. (2010) selected the main halos and their respective subhalos in all 100 snapshots, equally spaced in (here is the expansion factor of the universe), from redshift to . Further technical details can be found in Ludlow et al. (2010).
2.2. Globular cluster selection
We select all dark matter subhalos accreted by the central halo that are resolved by at least 200 particles at accretion time , defined as the time when its cluster-centric distance is typically . We follow the temporal evolution of each subhalo, computing its mass, density profile and orbital evolution in the galaxy cluster potential. Our sample comprises 625 galactic subhalos that at have virial masses ranging between and with a median of . Subhalos are continuously accreted from the beginning of the simulation to the present time with a median accretion time of which corresponds to redshift . As in Ramos et al. (2015), we follow the method described by Bullock and Johnston (2005) and Peñarrubia et al. (2008). Briefly, we assume that the dark matter density profile of each subhalo in our sample can be approximated by a Navarro-Frenk-White (NFW) fitting equation (Navarro et al., 1996):
| (1) |
where is the characteristic density and is the scale length. To mimic the red and blue globular cluster system in each galactic subhalo, we select at accretion time dark matter particles as tracers of the corresponding globular cluster populations with a Hernquist (1990) density profile:
| (2) |
where and are a characteristic density and scale length, respectively. The corresponding energy distribution function are given by:
| (3) |
where is the relative specific energy and is the relative gravitational potential.
The method outlined by Bullock and Johnston (2005) selects dark matter particles in bins according to a probability given by the ratio , where the subscripts and refer to a NFW and Hernquist density profile, respectively. Following Bekki and Yahagi (2006), we truncate our selection of dark matter particles up to a radius , where is the half mass radius of the dark matter subhalo. This truncation radius is imposed in order to take into account that in general the baryonic components, including the globular cluster system, are less extended than the dark matter subhalo.
We have fitted a NFW profile for each subhalo at its accretion time finding scale length parameters that range between and , with a median of . We have assumed a linear relation between the NFW and Hernquist scale length, with values chosen to give at redshift a projected number density profile similar to the power laws observed for red and blue populations. We adjusted following the results of Coenda et al. (2009) for the Virgo cluster which find logarithmic slopes of and for red and blue globular clusters, respectively. Applying this constrains we obtain for blue and for red globular cluster populations.
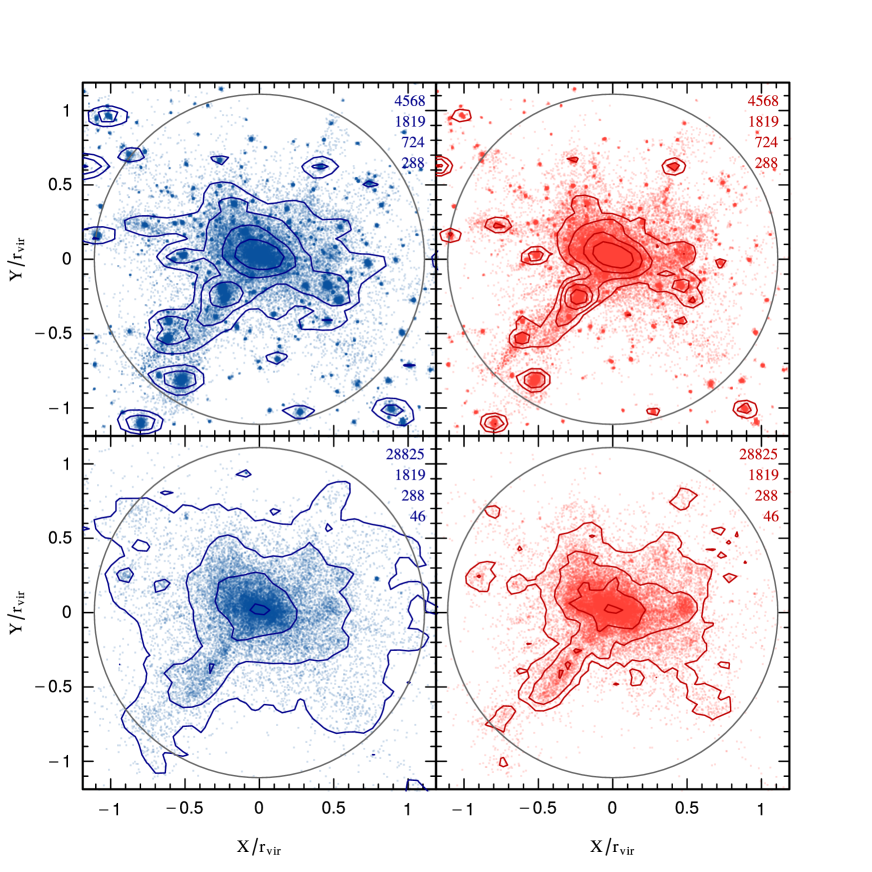
Upper panels in Figure 1 show the projected spatial distribution, at redshift , of all dark matter particles selected at accretion time, , as blue (left panel) and red (right panel) globular clusters. Lower panels correspond only to particles removed from their original galactic subhalos that at redshift are part of the intra-cluster medium. As in Ramos et al. (2015), we use a spatial criterion to determine if a globular cluster particle is still associated to its subhalo or if it was removed. We consider that a particle was removed from it subhalo when its distance to the subhalo center is greater than the distance of the farthest particle identified by SUBFIND algorithm and by the following two snapshots and also at . Particles selected as globular clusters and removed from their original subhalos build up the intra-cluster globular clusters population. From a total of 625 subhalos tagged at , there are 488 identified as self bound structures while 137 merged with the central galaxy cluster at redshift .
2.3. Globular cluster mass
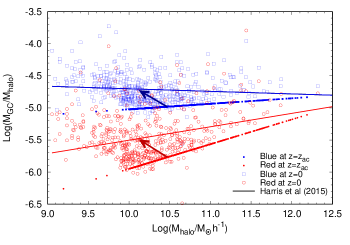
In order to assign a globular cluster mass to each individual dark matter particle selected as a tracer of the globular clusters population, we use the observational results described by Harris et al. (2015). Using a sample of 419 galaxies (Harris et al. 2013), they find a correlation between the total halo mass of a galaxy and its total mass in globular cluster for blue and red systems. They provide a power law fitting equation that can be written as: with and for (blue, red) globular clusters. At selection time , we assume that the relation between and follows a power law (without any scatter), with parameters adjusted to reproduce, at redshift z=0, the observational trends obtained by Harris et al. (2015). For 488 subhalos that are identified as self-bound structures by SUBFIND (Springel et al., 2001), we show in Figure 2, the ratio between globular cluster mass and dark matter halo mass as a function of .
 |
The correlation is shown both at redshift (open symbols) and at accretion time (solid symbols). Solid lines show the correlation obtained by Harris et al. (2015) which fits the relation for redshift (open squares). Arrows show the median loss of a subhalo mass and the relative increase in the ratio from selection time to redshift . At redshift , galactic subhalos have a mean loss of 55% of their original mass at accretion time , while intra-cluster globular clusters have a loss of only 18%. Thus the ratio increases by a factor of 1.8, as shown by the arrows in Figure 2. This probably reflects the fact that intra-cluster globular clusters have a more concentrated density profile than dark matter and thus less prone to tidal removal. On average subhalos lose 16% and 29% of their blue and red globular cluster population, respectively (Ramos et al., 2015).
It should be stressed that our model does not include the effect of globular cluster destruction: each dark matter particle selected as a globular cluster at high redshift remains intact to redshift keeping constant the total number of globular clusters. Our model only takes into account changes in the ratio between the number of globular clusters in galaxies and in the intra-cluster medium. Globular clusters can lose mass, and eventually be completely dissolved, by several effects such as stellar evolution (ejecta, stellar winds or supernovae) or dynamical processes (escapes by two-body scattering, gravitational shocks or dynamical friction). Fall and Zhang (2001) use analytical models to compute these effects finding that the globular cluster mass function can be seriously affected for masses below . Then, for the more massive globular clusters or those that stay away from strong gravitational field generated by the baryonic components of galaxies, mass loss is not probably a concern. In any case, it should be taken into account that most of our predictions are an upper limit.
3. Results
3.1. Number density of intra-cluster globular clusters
In order to compare our numerical simulation predictions with observational results, we compute number density isocontours (see Figure 1) and profiles (see Figure 3), assuming a constant mean mass of (Brodie and Strader, 2006), for both blue and red globular clusters. Figure 1 shows four isocontour levels which correspond, from inside to outside, to a projected number density in units of Number/Mpc2 indicated in the labels shown in the upper right corner of each panel. Number density isocontours of the globular clusters are smooth, similar to observational results found by Lee et al. (2010) for globular clusters in the Virgo galaxy cluster, and by Lee and Jang (2016) for globular clusters plus ultra compact dwarfs in Abell 2744. However, simulated isocontours also show the presence of a large tidal stream that corresponds to a massive subhalo, which has recently been disrupted by the galaxy cluster gravitational potential (see the bottom-left part of each panel in Figure 1). This structure is the result of the tidal disruption of the second most massive subhalo ( at ), which enters the galaxy cluster virial radius. This tidal stream arises after the third pericentric passage of the subhalo at redshift . No observational evidence of such tidal streams of intra-cluster globular clusters has been reported so far. However, a density structure in the spatial distribution of intra-cluster globular clusters connecting galaxies has been reported in Fornax by Bassino et al. (2006) and confirmed by D’Abrusco et al. (2016). These authors suggest that the galaxy NGC 1399 has stripped globular clusters from the less massive galaxy NGC 1387 forming this structure. They also report other elongated structures, mostly formed by blue globular Clusters, whose origins could be due to stripping events.
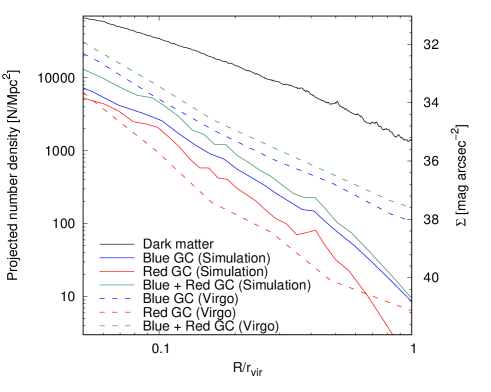
In Figure 3, we show the projected number density profile of intra-cluster globular clusters as a function of the projected cluster-centric distance , normalized to the galaxy cluster virial radius . Blue, red and green lines show the profile of blue, red and blue plus red globular clusters, respectively, with solid lines corresponding to our simulation and dashed lines corresponding to the observed globular clusters in the Virgo galaxy cluster (Lee et al., 2010). The solid black line shows the dark matter density profile arbitrarily normalized.
As a test of our mass assignment scheme we run a Montecarlo procedure over and parameters taking into account uncertainties given by Harris et al. (2015) obtaining very stable results. Errors in the projected number density profiles presented in Figure 3 are less than 0.2 dex.
Blue intra-cluster globular clusters have a more extended spatial distribution than the red ones, analogous to the observational results of Lee et al. (2010). This may be explained by the extended spatial distribution of blue globular clusters in galaxies being more prone to tidal stripping from their subhalos and therefore, at a greater cluster-centric distance than red ones. The latter may be removed when the halos pass through the central region of the cluster, where tidal forces are larger.
Figure 3 also shows that the projected number densities of both blue and red intra-cluster globular clusters have a much steeper profile than that of the dark matter. A similar result was found by Bekki and Yahagi (2006) using numerical simulations and by Lee and Jang (2016) in Abell 2744. This result is consistent with the scenario in which galaxies that are approaching the central region of clusters suffer a significant loss of globular clusters due to tidal effects.
3.2. Kinematics of intra-cluster globular clusters
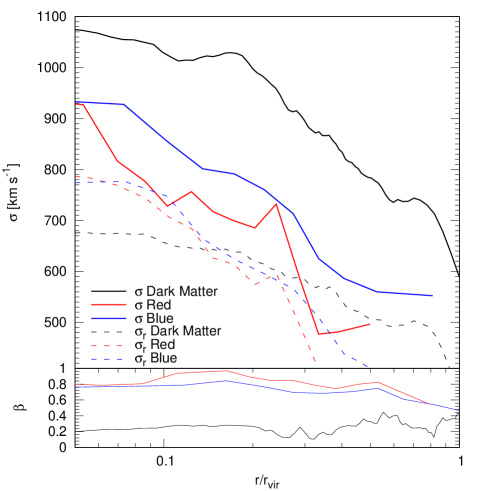
The main panel of Figure 4 shows the total velocity dispersion as a function of cluster-centric distance , normalized to the virial radius for dark matter (solid black line), and blue and red intra-cluster globular clusters (solid blue and solid red lines, respectively). Dashed lines correspond to the radial component of the velocity dispersion using the same color coding. In the inner regions, dark matter particles have a total velocity dispersion of while that of intra-cluster globular clusters is . In the outer regions, drops up to for dark matter, and to slightly lower values for intra-cluster globular clusters, , with blue ones always having higher velocity dispersion than red ones. This result agrees with Schuberth et al. (2008), who found higher velocity dispersion for blue intra-cluster globular clusters in the Fornax cluster. The bottom panel shows the anisotropy parameter:
| (4) |
with and , the tangential and radial components of the velocity dispersion, using the same color coding as the main panel. While dark matter has , indicating orbits that are only slightly radially biased, intra-cluster globular clusters have , pointing up orbits that are strongly supported by radial velocity dispersion. These results suggest that intra-cluster globular clusters are removed from their galactic subhalos when they cross the central regions of the galaxy cluster. Since they are preferentially on radial orbits, they are prone to suffer strong tidal destruction. Given that our model does not include tidal destruction our high value of the anisotropy parameter should be considered only as an upper limit.
| Subsample | N | % Blue | % Red |
|---|---|---|---|
| (1) | (2) | (3) | (4) |
| Merged | 137 | 65 | 79 |
| Low mass | 244 | 27 | 18 |
| High mass | 244 | 8 | 3 |
Note: Fraction of blue and red intra-cluster globular clusters according to their host galactic subhalo mass at redshift in three different bins (column 1): those merged, low mass and high mass (see text for definition). Column 2 is the number of subhalos in each sample while columns 3 and 4 are the relative fraction of blue and red, respectively.
3.3. Evolution of intra-cluster globular clusters
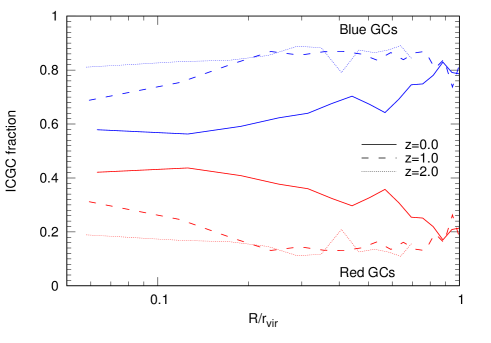
Figure 5 shows blue and red intra-cluster globular clusters fractions as a function of cluster-centric distance for three different redshifts (, and ) as indicated by the labels. In the inner regions, blue intra-cluster globular clusters represent nearly 60% of the total intra-cluster globular cluster population and reach up to 80% in the outer parts. At higher redshifts, the fraction of blue intra-cluster globular clusters at large radii remains almost unchanged ( 80%) but increases from 60% to 80% in the inner regions. At redshift , it is almost constant for all radii.
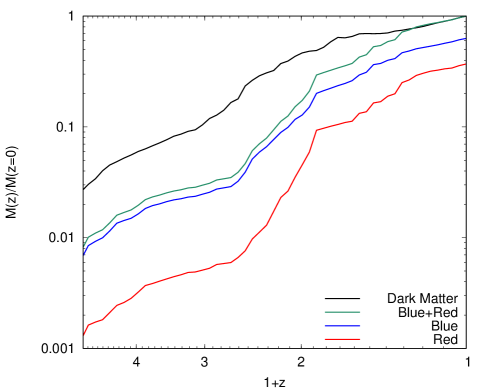
Figure 6 shows the temporal evolution of the intra-cluster globular cluster mass, normalized to the total intra-cluster globular cluster mass of redshift , for blue (blue lines), red (red lines), blue plus red (green lines) and dark matter (black lines). At redshift , the total mass in intra-cluster globular clusters was 50% of the final mass. Blue globular clusters dominate the intra-cluster globular cluster population in the whole range of redshifts; approximately 60% of the total intra-cluster globular cluster mass at redshift corresponds to the blue population. The relative importance of blue intra-cluster globular clusters decreases with time from 80% at redshift z3 to 60% at redshift .
3.4. Origin of intra-cluster globular cluster
It has been proposed that blue intra-cluster globular clusters could be the result of globular clusters being stripped from low-mass dwarf galaxies, and red ones from giant elliptical galaxies (Lee et al., 2010). To test possible systematic effects of the origin of intra-cluster globular clusters, we analyzed their contribution by number, taking into account the subhalo mass at redshift . We defined three different bins in mass: high mass (), low mass (), and merged (). The mass limits between high and low bins correspond to the mean of our sample of 488 subhalos that survived at as self-bound structures, while the limit between low mass and merged corresponds to the limit detection of SUBFIND. Table 1 shows blue and red fractions of intra-cluster globular clusters from the three different bins in our sub-samples. By far, most of the intra-cluster globular clusters come from merged subhalos, with a higher fraction for red than blue ones. The second most important contribution corresponds to globular clusters stripped from massive halos (27 and 18% for blue and red intra-cluster globular clusters, respectively) while low mass subhalos contribute only 8% and 3% for blue and red, respectively. We also analyzed the mass function of subhalos which, at , are merged with the main galaxy cluster halo. We found that the fraction of merged subhalos is nearly independent of the subhalo mass at selection time . Since the number of globular clusters is proportional to the host subhalo mass, the main contribution to the intra-cluster globular clusters comes from high mass halos.
4. Conclusions
We investigated the properties of blue and red populations of intra-cluster globular clusters, using a cosmological N-body numerical simulation that follows the formation and evolution of a dark matter halo which, at redshift , has a mass similar to the Virgo galaxy cluster (, ). We used the method outlined by Bullock and Johnston (2005) and Peñarrubia et al. (2008) to select blue and red globular cluster populations. The final sample comprises dark matter galactic subhalos that crossed the virial radius of the cluster with a virial mass greater than . We used observational results described by Harris et al. (2015) to assign mass to the particles selected as globular clusters. The results can be summarized as follows:
-
•
At redshift , we obtain a total intra-cluster globular cluster mass of . In agreement with previous works, intra-cluster globular clusters are dominated by blue populations because they are more prone to be tidally stripped. At redshift , approximately 60% of the intra-cluster globular clusters are blue.
- •
-
•
We also found that the projected number density of both red and blue intra-cluster globular clusters have a much steeper profile than that of the dark matter component. This result agrees with the findings of Lee and Jang (2016) analyzing the globular cluster population in Abell 2744. Taking into account that globular clusters are a subset of dark matter particles selected to be a relatively more tightly bound than the dark matter as a whole, galaxies will need to get closer to the central region of clusters in order to lose their globular clusters due to tidal stripping.
-
•
At the cluster center, blue intra-cluster globular clusters represent almost 60% of the total population of intra-cluster globular clusters. The different density profiles of blue and red intra-cluster globular clusters mean that the fraction of blue intra-cluster globular clusters grows with the cluster-centric distanse, reaching 80% in the outer parts. We found that this behavior strongly depends on redshift. At , the same fraction is obtained at , indicating that the stripping of globular clusters starts with the blue population. At redshift , the total intra-cluster globular cluster mass is approximately half of that at .
-
•
At any cluster-centric distance, dark matter total velocity dispersion is systematically higher than that for intra-cluster globular clusters. While dark matter particles are preferentially supported by slightly radial orbits, intra-cluster globular clusters are basically orbiting in radially biased orbits.
-
•
We found that most of the intra-cluster globular clusters (65% and 79% for blue and red, respectively) come from halos that, at , merged with the main galaxy cluster halo. The smallest contribution corresponds to low mass halos ( at ). We also found that the fraction of merged subhalos is nearly independent of the halo mass; consequently, massive halos are the main progenitors of the intra-cluster globular clusters.
Our results are in good agreement with available observations of intra-cluster globular clusters in nearby galaxy clusters. According to our results, a Virgo-like galaxy cluster could be expected to contain thousands of intra-cluster globular clusters, even at large distances from the cluster center. These results make intra-cluster globular clusters a powerful alternative to the study of diffuse intra-cluster light. We show that gravitational interactions (tidal stripping and/or destruction of halos) can completely explain the observed population of intra-cluster globular clusters.
References
- Dressler (1980) A. Dressler, ApJ 236, 351 (1980).
- Goto et al. (2003) T. Goto, C. Yamauchi, Y. Fujita, S. Okamura, M. Sekiguchi, I. Smail, M. Bernardi, and P. L. Gomez, MNRAS 346, 601 (2003), astro-ph/0312043.
- Coenda et al. (2006) V. Coenda, H. Muriel, C. J. Donzelli, H. Quintana, L. Infante, and D. García Lambas, AJ 131, 1989 (2006), astro-ph/0601085.
- Coenda and Muriel (2009) V. Coenda and H. Muriel, A&A 504, 347 (2009), 0906.1939.
- Moore et al. (1999) B. Moore, G. Lake, T. Quinn, and J. Stadel, MNRAS 304, 465 (1999), astro-ph/9811127.
- Durrell et al. (2002) P. R. Durrell, R. Ciardullo, J. J. Feldmeier, G. H. Jacoby, and S. Sigurdsson, ApJ 570, 119 (2002).
- Méndez et al. (1997) R. H. Méndez, M. A. Guerrero, K. C. Freeman, M. Arnaboldi, R. P. Kudritzki, U. Hopp, M. Capaccioli, and H. Ford, ApJL 491, L23 (1997), astro-ph/9710179.
- Gerhard et al. (2007) O. Gerhard, M. Arnaboldi, K. C. Freeman, S. Okamura, N. Kashikawa, and N. Yasuda, A&A 468, 815 (2007).
- Castro-Rodriguéz et al. (2009) N. Castro-Rodriguéz, M. Arnaboldi, J. A. L. Aguerri, O. Gerhard, S. Okamura, N. Yasuda, and K. C. Freeman, A&A 507, 621 (2009), 0908.3848.
- Longobardi et al. (2013) A. Longobardi, M. Arnaboldi, O. Gerhard, L. Coccato, S. Okamura, and K. C. Freeman, A&A 558, A42 (2013), 1309.0006.
- Neill et al. (2005) J. D. Neill, M. M. Shara, and W. R. Oegerle, ApJ 618, 692 (2005), astro-ph/0409265.
- Gal-Yam et al. (2003) A. Gal-Yam, D. Maoz, P. Guhathakurta, and A. V. Filippenko, AJ 125, 1087 (2003), astro-ph/0211334.
- Sand et al. (2011) D. J. Sand, M. L. Graham, C. Bildfell, R. J. Foley, C. Pritchet, D. Zaritsky, H. Hoekstra, D. W. Just, S. Herbert-Fort, and S. Sivanandam, ApJ 729, 142 (2011), 1011.1310.
- Graham et al. (2015) M. L. Graham, D. J. Sand, D. Zaritsky, and C. J. Pritchet, ApJ 807, 83 (2015), 1505.03407.
- Gregg and West (1998) M. D. Gregg and M. J. West, Nature 396, 549 (1998), astro-ph/9812033.
- Feldmeier et al. (2002) J. J. Feldmeier, J. C. Mihos, H. L. Morrison, S. A. Rodney, and P. Harding, ApJ 575, 779 (2002), astro-ph/0204467.
- Mihos et al. (2005) J. C. Mihos, P. Harding, J. Feldmeier, and H. Morrison, ApJL 631, L41 (2005).
- Krick and Bernstein (2007) J. E. Krick and R. A. Bernstein, AJ 134, 466 (2007), 0704.1664.
- Burke et al. (2012) C. Burke, C. A. Collins, J. P. Stott, and M. Hilton, MNRAS 425, 2058 (2012), 1206.4735.
- Mihos (2015) C. Mihos, IAU General Assembly 22, 2247903 (2015).
- White (1987) R. E. White, III, MNRAS 227, 185 (1987).
- West et al. (1995) M. J. West, P. Cote, C. Jones, W. Forman, and R. O. Marzke, ApJL 453, L77 (1995), astro-ph/9508141.
- Williams et al. (2007) B. F. Williams, R. Ciardullo, P. R. Durrell, J. J. Feldmeier, S. Sigurdsson, M. Vinciguerra, G. H. Jacoby, T. von Hippel, H. C. Ferguson, N. R. Tanvir, et al., ApJ 654, 835 (2007).
- Bassino et al. (2003) L. P. Bassino, S. A. Cellone, J. C. Forte, and B. Dirsch, A&A 399, 489 (2003), astro-ph/0212532.
- Bergond et al. (2007) G. Bergond, E. Athanassoula, S. Leon, C. Balkowski, V. Cayatte, L. Chemin, R. Guzmán, G. Meylan, and P. Prugniel, A&A 464, L21 (2007).
- Schuberth et al. (2008) Y. Schuberth, T. Richtler, L. Bassino, and M. Hilker, A&A 477, L9 (2008), 0710.3400.
- Coenda et al. (2009) V. Coenda, H. Muriel, and C. Donzelli, ApJ 700, 1382 (2009), 0905.1646.
- Lee et al. (2010) M. G. Lee, H. S. Park, and H. S. Hwang, Science 328, 334 (2010), 1003.2499.
- Peng et al. (2011) E. W. Peng, H. C. Ferguson, P. Goudfrooij, D. Hammer, J. R. Lucey, R. O. Marzke, T. H. Puzia, D. Carter, M. Balcells, T. Bridges, et al., ApJ 730, 23 (2011).
- West et al. (2011) M. J. West, A. Jordán, J. P. Blakeslee, P. Côté, M. D. Gregg, M. Takamiya, and R. O. Marzke, A&A 528, A115 (2011).
- Harris and Mulholland (2017) W. E. Harris and C. J. Mulholland, ApJ 839, 102 (2017), 1703.10204.
- Alamo-Martínez et al. (2013) K. A. Alamo-Martínez, J. P. Blakeslee, M. J. Jee, P. Côté, L. Ferrarese, R. A. González-Lópezlira, A. Jordán, G. R. Meurer, E. W. Peng, and M. J. West, ApJ 775, 20 (2013), 1308.1958.
- D’Abrusco et al. (2016) R. D’Abrusco, M. Cantiello, M. Paolillo, V. Pota, N. R. Napolitano, L. Limatola, M. Spavone, A. Grado, E. Iodice, M. Capaccioli, et al., ApJL 819, L31 (2016).
- Lee and Jang (2016) M. G. Lee and I. S. Jang, ApJ 831, 108 (2016).
- Yahagi and Bekki (2005) H. Yahagi and K. Bekki, MNRAS 364, L86 (2005), astro-ph/0509744.
- Bekki and Yahagi (2006) K. Bekki and H. Yahagi, MNRAS 372, 1019 (2006).
- Ramos et al. (2015) F. Ramos, V. Coenda, H. Muriel, and M. Abadi, ApJ 806, 242 (2015), 1505.05506.
- Durrell et al. (2014) P. R. Durrell, P. Côté, E. W. Peng, J. P. Blakeslee, L. Ferrarese, J. C. Mihos, T. H. Puzia, A. Lançon, C. Liu, H. Zhang, et al., ApJ 794, 103 (2014), 1408.2821.
- Bekki and Yahagi (2009) K. Bekki and H. Yahagi, Formation of Intracluster and Intercluster Globular Clusters (2009), p. 373.
- Griffen et al. (2010) B. F. Griffen, M. J. Drinkwater, P. A. Thomas, J. C. Helly, and K. A. Pimbblet, MNRAS 405, 375 (2010), 0910.0310.
- Cen (2001) R. Cen, ApJ 560, 592 (2001), astro-ph/0101197.
- Harris et al. (2015) W. E. Harris, G. L. Harris, and M. J. Hudson, ApJ 806, 36 (2015).
- Ludlow et al. (2010) A. D. Ludlow, J. F. Navarro, V. Springel, M. Vogelsberger, J. Wang, S. D. M. White, A. Jenkins, and C. S. Frenk, MNRAS 406, 137 (2010).
- Springel (2005) V. Springel, MNRAS 364, 1105 (2005), astro-ph/0505010.
- Klypin et al. (2001) A. Klypin, A. V. Kravtsov, J. S. Bullock, and J. R. Primack, ApJ 554, 903 (2001).
- Springel et al. (2001) V. Springel, S. D. M. White, G. Tormen, and G. Kauffmann, MNRAS 328, 726 (2001).
- Bullock and Johnston (2005) J. S. Bullock and K. V. Johnston, ApJ 635, 931 (2005).
- Peñarrubia et al. (2008) J. Peñarrubia, J. F. Navarro, and A. W. McConnachie, ApJ 673, 226-240 (2008), 0708.3087.
- Navarro et al. (1996) J. F. Navarro, C. S. Frenk, and S. D. M. White, ApJ 462, 563 (1996).
- Hernquist (1990) L. Hernquist, ApJ 356, 359 (1990).
- Harris et al. (2013) W. E. Harris, G. L. H. Harris, and M. Alessi, ApJ 772, 82 (2013).
- Fall and Zhang (2001) S. M. Fall and Q. Zhang, ApJ 561, 751 (2001), astro-ph/0107298.
- Brodie and Strader (2006) J. P. Brodie and J. Strader, ARA&A 44, 193 (2006), astro-ph/0602601.
- Bassino et al. (2006) L. P. Bassino, F. R. Faifer, J. C. Forte, B. Dirsch, T. Richtler, D. Geisler, and Y. Schuberth, A&A 451, 789 (2006).